Higher Degrees:
Postgraduate Study in the
UK 2000/01 to 2005/06
Jane Artess, Charlie Ball and Pearl Mok
Higher Degrees:
Postgraduate Study in the UK
2000/01 to 2005/06
Jane Artess, Charlie Ball and Pearl Mok
Higher Education Careers Service Unit (HECSU)
DIUS Research Report 08-16
© Higher Education Careers Service Unit 2008
Contents
Page
Executive summary 3
Research questions 9
1. Postgraduate study:
student record analysis 10
1.1 Participation in post graduate study 10
1.2 Region of domicile 13
1.3 Gender 15
1.4 Qualification aim 17
1.5 Age 25
1.6 Mode of study 32
1.7 Highest qualification on entry 40
1.8 Ethnicity
1.9 Subjects of study
43 46 1.10 Institution type 53 1.11 Socio-economic classifications 56 1.12 Routes into post graduate study 56 1.13 Relationship between
undergraduate and postgraduate study
56
2. Postgraduate study: finance
58
2.1 Funding data fields 2.2 Supply-side:
2.2.1 Qualification aim 2.2.2 Institution
2.2.3 Country of domicile 2.2.4 Mode of study
2.2.5 Eligibility to pay home fees by domicile
2.2.6 Eligibility to pay home fees & mode of study
2.2.7 Subject of study 2.3 Demand-side:
2.3.1 Fee band and country of domicile 2.3.2 Subject of study
2.3.3 Fee band by qualification aim 2.3.4 Institutional type and fee band 2.3.5 Selected sources of tuition fee support by institutional type
59 63 63 63 64 66 67 68 69 72 72 74 76 77 79
3. Postgraduate study: student destinations
82
3.1 Masters outcomes: 83
3.1.1 Graduates entering the workplace 85
3.1.2 Unemployment 85
3.1.3 Types of work of Masters graduates
86
3.1.4 Gender 88
3.1.5 Mode of study 91
3.1.6 Types of work by mode of study 93
3.1.7 Age 94
3.1.8 Ethnicity 97
3.1.9 Domicile 99
3.1.10 By institution 102
3.2 Doctorate outcomes: 110
3.2.1 Gender
3.2.2 Mode of Study
114 116
3.2.3 Age 118
3.2.4 Ethnicity 120
3.2.5 Domicile 120
3.2.6 By institution 124
3.2.7 By subject 126
Appendices
Appendix A - Tables A – F
Qualification aim by age and domicile
Appendix B - Tables G - L
Postgraduates by qualification aim, mode of study and domicile
Appendix C - Tables M - O
Postgraduates by mode of study, age and domicile
Appendix D - Tables P - R
Postgraduates by subject areas and domicile
Appendix E - Tables S - AB Number of postgraduates by qualification aim, subject area and domicile
Appendix F - Tables AC - AD
Gender distribution across subject areas by domicile
Appendix G - Types of institutions
129
136
142
145
148
158
160
Executive summary
Postgraduate study: Student Record Analysis:
Numbers are rising
Between 2000/01 and 2005/06, the number of postgraduates studying at HEIs in the UK rose by 21.5% from 448,696 in 2000/01 to 545,369 in 2005/06. Within this period, the largest growth was in the number of non-EU students, which rose by 51,862 (71.4%), compared with 36,453 of UK students (10.8%) and 8,358 (21.6%) of other EU students. In 2005/06, just under a quarter (22.8%) of postgraduate students were domiciled outside the EU, and one in eleven (8.6%) were from other EU countries. The size of the postgraduate population was less than a third of that of the
undergraduate population, but in terms of percentage growth, it had risen more than the undergraduate population during the period 2000/01 and 2005/06, owing to the much bigger growth in non-UK domiciled students amongst the postgraduate cohort. This rise in the number of postgraduates, however, was not constant over the period. Between 2003/04 and 2004/05, there was a 3.2% drop in the number of UK
domiciled new starters, although this was followed by a rise again in 2005/06. Amongst other EU domiciled postgraduates, numbers rose only marginally between 2004/05 and 2005/06; at the same time, the number of non-EU postgraduate new entrants fell marginally by 0.1%.
More students from China and India
The number of non-EU students from the People’s Republic of China rose by 20,780 between 2000/01 and 2005/06. The number of overseas students from India has also grown rapidly since 2000/01. In 2005/06, there were over four times more postgraduate students from India than in 2000/01 and it now has the second largest number of postgraduate students in the UK after China.
More females
Females accounted for just over half (53.4%) of the postgraduate student population in 2005/06, slightly lower than that for undergraduates (58.5%). Amongst UK
domiciled postgraduates, there had been much faster growth in the number of female students than male students.
Qualification aim
Overall, 82.9% of postgraduate study in the UK in 2005/06 was represented by three qualifications: masters degree not mainly by research (50.8% of all qualifications), doctorate degree mainly by research (16.8%) and postgraduate diploma or certificate (not PGCE) (15.3%). Growth rates of different qualifications have been very
different. For instance the number taking Research Doctorates have increased by 10% over the period, while Taught Masters have increased by 39%.
Domicile
There have been much higher growth rates of postgraduate study across all qualification aims amongst EU and non-EU students than UK domiciled students, showing rates of 21%, 71% and 11%, respectively. The number of UK domiciled students studying for Research Doctorates has grown by only 1% over the whole period, compared to 23% and 27% for EU and non-EU students. For Taught Masters the figures are 21%, 23% and 107% for UK, EU and non-EU students, respectively.
A younger population
Between 2000/01 and 2005/06, there was a general shift towards a younger
Balance of full and part time
Over half of the postgraduates studied part-time. However, between 2000/01 and 2005/06, there was a steady increase in the share of those studying full-time and a decline in those opting for part-time study. On the contrary, the percentage of undergraduates opting for full-time study fell marginally during this period.
Prior postgraduate experience
The number of UK-domiciled postgraduate students who already possessed a postgraduate qualification (excluding PGCE) rose by 44% between 2000/01 and 2005/06. Figures for non-UK students reveal that the UK was attracting more other EU postgraduates directly from overseas in 2005/06 than in 2000/01, whilst the number of graduates who stayed on after their first degree fell during this period. For non-EU postgraduates, the numbers coming directly from overseas and those
staying on after a first degree both rose during this period, although students from the former category had risen more rapidly.
Ethnic trends
Between 2000/01 and 2005/06, there was faster percentage growth in minority ethnic postgraduates than in White postgraduates. Between 2000/01 and 2005/06, the only ethnic group amongst UK domiciled postgraduates with declining numbers was other black background.
Subject choices
Between 2002/03 and 2005/06, education saw the highest increase in numbers – up by 14,227 students. This was followed by subjects allied to medicine, which went up by over 12,000 students. Overall, the most popular subject area for postgraduate study was business and administrative studies, which accounted for just under one in five (19%) postgraduates in 2005/06, followed by education, which represented just under one in six (15.9%) postgraduate students. For UK domiciled postgraduates, education was the most popular subject area, followed by business and
administrative studies and subjects allied to medicine. Amongst UK postgraduates, the numbers studying mathematical and computer sciences or engineering and technologies fell by 10.6% and 2.9% respectively between 2002/02 and 2005/06. On the contrary, the numbers of non-EU students on these courses rose by 22% and 29% respectively during this time.
Institution attended
Between 2000/01 and 2005/06, there was an 18% increase in the number of postgraduate students in both Russell Group and pre-92 universities, whilst
postgraduate enrolments at the ‘others’ institutions went up by almost 30%. A higher proportion of UK domiciled male postgraduates compared with their female
counterparts studied at a Russell Group or pre-92 university, and there were few changes between the two years.
Postgraduate study: Finance
Programmes funded by funding councils
The clear majority of postgraduate students are in programmes of study that are fundable by a Funding Council, although this has fallen by around 9% between 2000/01 and 2005/06. There has been a 7% rise in the number of students in programmes of study that are not fundable by a Funding Council; the programme of study most likely to be not fundable by a Funding Council is 'Masters not mainly by research' which has nearly doubled in this period.
Nineteen Russell Group institutions account for around 25% of fundable
institutions they account for around half of the fundable programmes of study and the Open University is the largest single provider of fundable postgraduate study.
Postgraduate study fundable by a Funding Council by country of domicile is relatively stable across the period in respect of the UK, the EU and the Non EU domiciled. However, postgraduate study that is not fundable by a Funding Council is rising amongst Non EU domiciled. There are more part time students in programmes of study fundable by a Funding Council than full time students. This is reversed in programmes of study that are not fundable where full time students increasingly outnumber part time students.
Eligibility to pay home fees
Eligibility to pay home fees has fallen for those domiciled in Scotland, Wales and Northern Ireland and remained stable for those domiciled in England. Eligibility to pay home fees is rising for Non EU domiciled students albeit from a very low base; the overwhelming majority of Non EU students remain ineligible to pay home fees. Ineligibility to pay home fees amongst Non EU students is rising.
Fees paid by students
It might be expected that postgraduate study would be categorised as falling into the prescribed Postgraduate fee band (full or half). In fact a small proportion of students are required to pay undergraduate fees and around two thirds are categorised as No fee band which means that they will be charged a fee that is not prescribed by a funding body. Fee banding is differentiated by qualification aim; for example, students are nearly twice as likely to be required to pay the prescribed postgraduate fee for a Doctorate mainly by research as for a Masters mainly by research. Fee banding varies by institution and the differential is consistent between 2000/01 and 2005/06. For example, 53% of students at Russell Group institutions are categorised as No fee band as compared to up to 99% of Open University students. This may be a function of mode of study as there appear to be more part time students
categorised as No fee band.
Tuition fee support
Students receive support with tuition fees from a very wide range of sources. There is some evidence that tuition support from students' employers is rising albeit from a low base. Between 4% - 20% depending upon institution type, of postgraduate students received tuition fee support from employers in 2005/06. This may under-estimate the actual contribution of employers to, particularly, part time postgraduate study. Research Council support of tuition fees also varies with institution; for
example, students are more likely to receive financial support from research councils at Russell Group institutions.
Postgraduate study: destinations
Part time, mature, white Masters graduates
There are clear differences in overall outcomes for certain groups of Masters graduates. In particular, part-time, mature and white graduates seem to do a great deal better than graduates in other groups. This suggests that there are factors at play in the employment market for Masters graduates that work to the advantage of these groups, and that social capital issues that have been identified by other research may be very important.
to the advantage of those with more experience of the UK employment market, and to those who are already in post, and against younger and less experienced
graduates. It also means that, for example, when outcomes are looked at groups of universities as a whole, the post-92 institutions do as well as others. However, this disguises the much larger proportion of part-time students that they educate, and, in fact, when measured on a like-for-like basis by mode of study, Russell Group and other pre-92 institutions have a much more favourable outcome.
In particular, it appears that many of those positions for which a Masters may be a requirement or an advantage, and which might be expected to be openly advertised, are effectively inaccessible to full-time Masters graduates as they are being taken by internal candidates whose part time training has been funded by employers and others. The converse is that there may be more of a market for universities prepared to be flexible with regards to an employer need for a more skilled senior workforce.
Gendered employment choices
When looking at the kind of work that Masters graduates do, there are notable differences between sections of the population. Women are very much more likely than men to go into education and health, and less likely to go into management and business – this mirrors the undergraduate situation.
Minority ethnic employment choices
Types of work are spread by ethnicity, with some ethnic groups more likely than white graduates to go into management or business. However, some niche areas are dominated by white graduates – university research at Masters level, environmental professions, surveying, and white graduates are least likely to be working in a job that did not require a degree on completing their Masters.
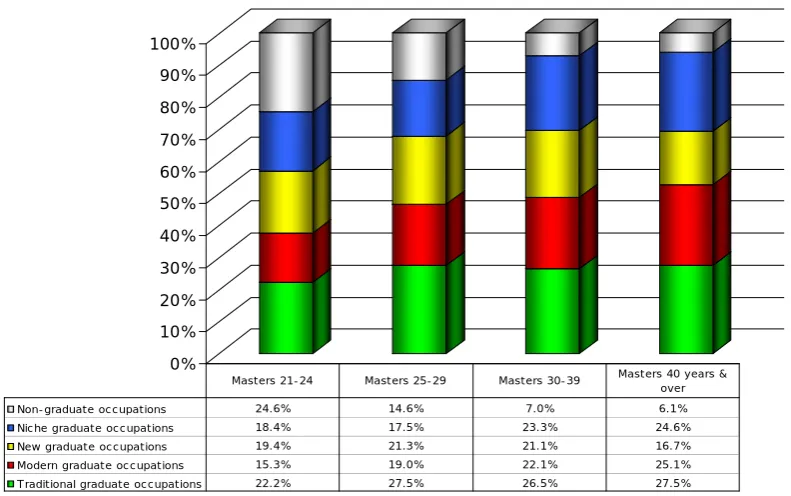
Age
Older graduates are far more likely to be working in management, health or education than younger students, and less likely to have entered a business and finance profession. Nearly a quarter of graduates aged 21-24 from 2006 were in a job that did not require a first degree, as opposed to around 6% for those over 40. Again like the overall outcomes, these seem to be a factor of whether a student has studied part time or full time.
Salaries
Salaries have been rising gradually by year, and in 2006, the median salary for a Masters graduate was £26,000 six months after graduating. The effect of the types of work done can be seen when comparing salaries by gender – median male salary was £29,000 and median salaries for women were £25,000. The median salary for a graduate of 21-24 years was £19,000, and this rose with age to £35,000 for those aged over 40 on graduating. Again, the major difference was between part time and full time graduates. The median salary in 2006 for a full time Masters graduate six months after graduating was £21,000. For their part time counterpart, it was £32,000.
Labour market trends
Masters graduates contain a higher proportion of mature and part time students than other degrees. There appears to be no obvious disadvantage to women graduates, although the overall choice of jobs does differ between men and women. There appears to be little disadvantage for mature students. There does appear to be some advantage for white graduates, with lower unemployment rates and less chance of starting in a job that does not require a degree. Salaries are rather higher for white graduates than for other minority groups.
There is a strong advantage for part time graduates, by every measure. There may be an issue for young, full time Masters students who may not be achieving the outcomes that they might be expecting, especially in light of the fees of some Masters courses. Unemployment rates amongst younger postgraduates are much higher than for older or part-time postgraduates; salaries are lower and the likelihood of being in a job that does not require even a first degree six months after graduating is higher.
There needs to be more transparency in reporting outcomes for full time as opposed to part time Masters students. Full time Masters students may need more advisory support in order to reduce their chances of an unfavourable outcome. In terms of outcomes, a part-time student at a new, post-92 university can expect a more favourable initial outcome than a full-time student at a Russell Group institution.
Salaries continue to rise, and are, overall, well above that for a first degree, but the gap rises with age. Salaries for Masters degrees are not a great deal below those for Doctorates, but a young, full-time Masters graduate may not earn much more than they would with their first degree alone.
Increasing numbers of Doctorates
There is a long term trend of gentle increase in the number of Doctoral graduates every year, but that does not mean year-on-year increase. One individual year may have fewer graduates than the year before. The proportion of women gaining Doctorates is increasing, and it will not be long - probably less than a decade - before they make up a majority of Doctoral graduates, and, ultimately, new
academics. This has very profound implications for the long-term culture of UK higher education.
Employment in academia and elsewhere
Employment outcomes remain very stable for Doctoral graduates. By far the most common initial destination is academic employment but contrary to previous
expectation only about half of Doctoral graduates enter academia. The key issues in Doctoral employment outcomes were outlined by the 'Roberts Review'1 and
subsequently explored by the UK GRAD Programme publication ‘What Do PhDs Do?’2 using HESA data analysed by HECSU. The issue identified (in 2002) by Roberts of job insecurity and poor career prospects for graduates going into academia remains and is becoming better understood.
There is no real evidence of an oversupply of Doctoral graduates in general or of individual subjects in particular. Some local subject difficulties are more likely to be related to the expectations of graduates. However, despite warnings from industry about the lack of science graduates, chemistry Doctorates make up the largest group of unemployed Doctoral graduates, and physical science PhDs are the most likely
1
See also
subject group to be unemployed. There is demand from non-academic employers for Doctoral graduates, but there may still be issues with mutual understanding of the needs of employers and Doctorate employees, with research skills.
Whilst Masters graduates often compete with first degree graduates for jobs, there are more niches, especially in the sciences and academia, for Doctoral graduates that are not accessible to those without a Doctoral qualification. Little research has been undertaken to determine what level of non-academic employment is available for those with a Doctoral qualification, nor how many Doctoral graduates might be thought to be using their degree. Employment opportunities for Doctoral graduates are more dispersed around the UK and, by and large, less concentrated in the capital than for first degrees.
Salaries
Median salaries for Doctoral graduates are a little higher than those for Masters graduates, but the two sets of graduates do not really compete for the same roles, so direct salary comparisons are difficult. Without segmenting for age or mode of study, outcomes for institution type appear relatively similar. Russell Group universities produce the majority of science graduates. Median salaries for post-92 institutions are actually higher than those for pre-92, but this is also a reflection of the kinds of jobs graduates from each institution go into, with post-Doctoral research more common for the more established institutions
Research Questions
This mapping exercise has been carried out using mainly bi-variate analyses of coded variables within two major sets of HESA data. We are persuaded that there would be much to gain by multi-variate analyses and/or modelling; the following topics are suggested:
1. The possible correlation between mode of study, country of domicile and fee banding.
2. The relationship between mode of study, fee banding and selected qualification aim (eg to better understand the differential between Doctorate/Masters mainly by research and Doctorate/Masters not mainly by research).
3. The selection of subject of study: by age, country of domicile and highest prior qualification.
4. Linking undergraduate and postgraduate student records to ascertain whether analysis of routes into postgraduate study is practicable and reliable.
5. Analyses of the HESA's new longitudinal DLHE in respect of postgraduate awards.
This exercise also suggests a range of other research questions, which might be focussed upon the behaviours and motivation of students and graduates:
A. The reasons for take up of postgraduate study, by age, gender and country of domicile.
B. The reasons underlying the selection of full and part time modes of study. C. The selection of subject of study and the availability of information, advice and
guidance in support of decision-making.
D. Anticipated outcomes of postgraduate study; economic, social and personal. E. The availability and nature of pre-entry information, advice and guidance to those
planning to undertake postgraduate study.
F. The extent to which postgraduate award holders perceive their qualification to be utilised in employment.
Financial considerations are understood to play a part in both decision-making to enter postgraduate study and also in retention and subsequent completion. Development of a better understanding of the behaviour of funding bodies is therefore suggested to be of particular importance:
(i) Making explicit the rationale of funding bodies in respect of allocation of funding amongst institutions.
(ii) Making explicit the rationale underlying the allocation of programmes of study to prescribed and non-prescribed fee bandings.
(iii) Examination of trends in relation to major policy shifts by country of domicile (UK).
(iv) Reasons underlying employer support of tuition fees.
(v) The institutional impact of increasing numbers of Non EU students in programmes of study not fundable by a Funding Council.
1.
Postgraduate study: Student Record Analysis
In this section the key changes in postgraduate participation in UK higher education institutions (HEIs) between the period 2000/01 and 2005/06 are identified. The analysis was carried out on the Higher Education Statistics Agency (HESA) Student Records for these years, provided by the Higher Education Funding Council in England (HEFCE).3
1.1
Participation in postgraduate study
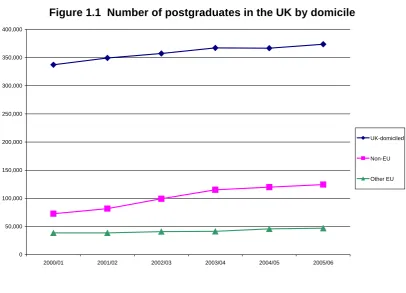
Between 2000/01 and 2005/06, the number of postgraduates studying at HEIs in the UK rose by 21.5% from 448,696 in 2000/01 to 545,369 in 2005/06. Within this period, the largest percentage increase was in the number of postgraduates domiciled outside the EU, which rose by 71.4% (51,862 students), compared with 10.8% (36,453 students) for those domiciled in the UK and 21.6% (8,358 students) for those from other EU countries (see Figure 1.1 and Table 1.1a). By 2005/06, just under a quarter (22.8%) of the postgraduate population came from non-EU countries,
compared with one in six (16.2%) in 2000/01 (Table 1.1b). Overall, non-UK domiciled students accounted for just under one in three (31.5%) of the total postgraduate student population in the UK in 2005/06, up from one in four (24.8%) in 2000/01.
Although the total number of postgraduate students rose each year during the period of study, there was a marginal year-on-year drop of 0.1% of UK domiciled
[image:12.595.95.502.433.726.2]postgraduates in 2004/05. This was, however, followed by another rise in 2005/06 to reach an all time high figure.
Figure 1.1 Number of postgraduates in the UK by domicile
0 50,000 100,000 150,000 200,000 250,000 300,000 350,000 400,000
2000/01 2001/02 2002/03 2003/04 2004/05 2005/06
UK-domiciled
Non-EU
Other EU
3
Table 1.1a Number of postgraduates in the UK by domicile (2000/01-2005/06)
Table 1.1b Percentage distribution of postgraduates by domicile (2000/01 – 2005/06)
For comparison, Tables 1.2a and 1.2b show the number and percentage distribution of undergraduates by domicile between 2000/01 and 2005/06.4 Across all years, there were around 3.3 times more undergraduates than postgraduates. In terms of percentage growth, however, the postgraduate population has risen more than the undergraduate population during this period: 21.5% compared with 16.1% for undergraduates. This is attributed to the much higher percentage growth in non-UK domiciled postgraduate students during this time: 54.1% compared with 32.6% for undergraduates. For both undergraduates and postgraduates, the percentage growth in the number of non-EU students was particularly notable: 56.1% amongst the undergraduate population and 71.4% for postgraduates, compared with only 5.9% for other EU undergraduates and 21.6% for other EU postgraduates.
Non-UK domiciled students also accounted for a much higher proportion of the postgraduate population than of the undergraduate population: just under one in three (31.5%) postgraduates were non-UK domiciled compared with around one in eleven (8.9%) for undergraduates. In fact, although the total size of the postgraduate population is much smaller than that of the undergraduate population, there is a higher number of non-EU postgraduate than undergraduate students in the UK.
Table 1.2a Number of undergraduates in the UK by domicile (2000/01 – 2005/06)
4
2000/01 2001/02 2002/03 2003/04 2004/05 2005/06
% change between 2000/01 and 2005/06
UK-domiciled 337333 349424 357334 367273 366836 373786 10.8%
Other EU 38679 38637 40882 41387 45812 47037 21.6%
Non-EU 72684 81789 99286 115167 119983 124546 71.4%
Total 448696 469850 497502 523827 532631 545369 21.5%
2000/01
2001/02
2002/03
2003/04
2004/05
2005/06
UK-domiciled 75.2% 74.4% 71.8% 70.1% 68.9% 68.5%
Other EU 8.6% 8.2% 8.2% 7.9% 8.6% 8.6%
Non-EU 16.2% 17.4% 20.0% 22.0% 22.5% 22.8%
Total 100.0% 100.0% 100.0% 100.0% 100.0% 100.0%
2000/01 2001/02 2002/03 2003/04 2004/05 2005/06
% change between 2000/01 and 2005/06
UK domiciled 1422425 1493895 1542515 1580110 1602305 1632245 14.8%
Other EU 55900 51495 49700 48155 54190 59185 5.9%
Non-EU 63605 70835 85400 95345 98410 99310 56.1%
Table 1.2b Percentage distribution of undergraduates by domicile (2000/01-2005/06)
New entrants to postgraduate study
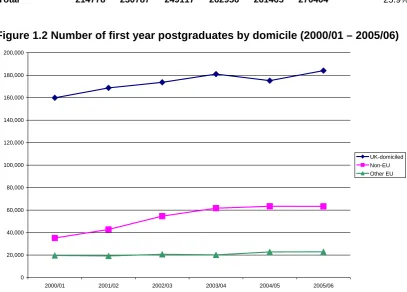
[image:14.595.94.502.408.700.2]The number of new entrants to postgraduate study between 2000/01 and 2005/06 are shown in Table 1.3 and Figure 1.2.5 Between 2003/04 and 2004/05, there was a 3.2% drop in the number of UK domiciled new starters, although this was followed by a rise again in 2005/06. Amongst other EU domiciled postgraduates, numbers rose by only 0.4% between 2004/05 and 2005/06; at the same time, the number of non-EU postgraduate new entrants fell marginally by 0.1%.
Table 1.3 Number of first year postgraduates by domicile (2000/01 – 2005/06)
Figure 1.2 Number of first year postgraduates by domicile (2000/01 – 2005/06)
0 20,000 40,000 60,000 80,000 100,000 120,000 140,000 160,000 180,000 200,000
2000/01 2001/02 2002/03 2003/04 2004/05 2005/06
UK-domiciled Non-EU Other EU
The further breakdown of first year postgraduates by qualification aim is discussed later in this report.
5
New entrants were identified from the date of commencement of the programme (variable COMDATE in the HESA Student Records). All new entrants have a COMDATE between 01/08/200X and
31/07/200Y for the 200X/0Y academic year.
2000/01
2001/02
2002/03
2003/04
2004/05
2005/06
UK domiciled 92.2% 92.4% 91.9% 91.7% 91.3% 91.1%
Other EU 3.6% 3.2% 3.0% 2.8% 3.1% 3.3%
Non-EU 4.1% 4.4% 5.1% 5.5% 5.6% 5.5%
Total 100.0% 100.0% 100.0% 100.0% 100.0% 100.0%
2000/01 2001/02 2002/03 2003/04 2004/05 2005/06
% change between 2000/01 and 2005/06
UK-domiciled 159937 168762 173722 181006 175164 184086 15.1% Other EU 19634 19208 20758 20193 22838 22936 16.8% Non-EU 35207 42817 54637 61757 63463 63382 80.0%
1.2
Region of domicile
Table 1.4 gives a more detailed breakdown of the total number of postgraduate students by region of domicile.6 As already mentioned, between 2000/01 and
2005/06, the UK postgraduate student population saw a 71.4% growth in the number of students from non-EU countries and 21.6% from other EU countries. Double digits growth was also seen in the number of students domiciled in England (10.8%), Scotland (12.7%) and the Channel Islands/Isle of Man (31.4%), whilst Wales and Northern Ireland saw more modest increases. The number of postgraduates
domiciled in Wales actually fell between 2002/03 and 2004/05 but rose again to an all time high in 2005/06. On the other hand, the number of postgraduates domiciled in Northern Ireland rose steadily between 2000/01 and 2004/05, but dropped by 2.6% between 2004/05 and 2005/06. The patterns can be seen in Figure 1.3.
Table 1.4 Number of postgraduate students by region of domicile (2000/01-2005/06)
2000/01 2001/02 2002/03 2003/04 2004/05 2005/06 % change 2000/01 - 2005/06
England 278357 286831 294777 303362 303527 308422 10.8%
Scotland 31599 33704 32892 34195 33824 35621 12.7%
Wales 16354 17208 17689 17593 17320 17830 9.0%
Northern Ireland 10331 10896 11128 11244 11302 11004 6.5%
Channel Islands / Isle of Ma 692 785 848 879 863 909 31.4%
Other European Union 38679 38637 40882 41387 45812 47037 21.6%
Non-European Union 72684 81789 99286 115167 119983 124546 71.4%
Total 448696 469850 497502 523827 532631 545369 21.5%
Figure 1.3 Number of postgraduate students by region of domicile (2000/01-2005/06) England 260000 270000 280000 290000 300000 310000 320000
2000/01 2001/02 2002/03 2003/04 2004/05 2005/06
Scotland 29000 30000 31000 32000 33000 34000 35000 36000
2000/01 2001/02 2002/03 2003/04 2004/05 2005/06
Wales 15500 16000 16500 17000 17500 18000
2000/01 2001/02 2002/03 2003/04 2004/05 2005/06
Northern Ireland 9800 10000 10200 10400 10600 10800 11000 11200 11400
2000/01 2001/02 2002/03 2003/04 2004/05 2005/06
Other European Union
35000 37000 39000 41000 43000 45000 47000 49000
2000/01 2001/02 2002/03 2003/04 2004/05 2005/06
Non-European Union 70000 80000 90000 100000 110000 120000 130000
2000/01 2001/02 2002/03 2003/04 2004/05 2005/06
Table 1.5 shows the number of postgraduates by known region of domicile in England between 2000/01 and 2005/06. During this period, the number of students domiciled in the North West saw the largest percentage rise of 25%, followed by those from the South West (21.1%).
Table 1.5 Number of postgraduates by known England region of domicile (2000/01 – 2005/06)
2000/01 2001/02 2002/03 2003/04 2004/05 2005/06
% change 2000/01 -2005/06
North East 11473 12246 12628 12417 12821 12584 9.7%
North West 32357 35951 35029 38304 38777 40458 25.0%
South East 43069 44769 46834 48087 47827 48398 12.4%
London 57426 58570 61405 63415 62942 63978 11.4%
East of England 23992 24610 25597 26344 26639 25330 5.6%
E Midlands 20630 21228 21277 22003 22173 22288 8.0%
West Midlands 23994 27103 27474 27775 27454 28162 17.4%
South West 25211 26272 27922 29480 30674 30535 21.1%
Yorkshire and Humberside 22709 24768 26121 26027 26263 25997 14.5%
Table 1.6 shows the top ten non-UK countries with the highest numbers of postgraduates studying in the UK between 2000/01 and 2005/06. In 2000/01 and 2001/02, Greece had the highest numbers of overseas postgraduate students studying in the UK, but its top position has since been superseded by the People’s Republic of China. In 2000/01, students from China accounted for 6.2% of all
overseas postgraduate students in the UK and 1.5% of the total postgraduate cohort. This rose to 17% and 5.3% respectively in 2004/05. The number of postgraduates from China fell slightly by 500 (1.8%) from an all time high of 28,171 in 2004/05 to 27,666 in 2005/06, although the latest figures from HESA have revealed that the number went up again to 27,940 in 2006/07.7
The number of overseas students from India has also grown rapidly since 2000/01. In 2005/06, there were over four times more postgraduate students from India than in 2000/01 and it now has the second largest number of postgraduate students in the UK after China.
Table 1.6 Top ten non-UK countries with the highest numbers of postgraduate students in the UK
In 2005/06, China also had the highest number of overseas undergraduate students in the UK, followed by the Republic of Ireland and Malaysia. The growth in the
number of undergraduates from China has been particularly significant: from 5,210 in 2000/01 to 23,085 in 2005/06, ie 4.4 fold, represents an even larger percentage
7
Students in Higher Education Institutions 2006/07, HESA.
Greece 14419 Greece 14655 China (People's Republic of)
17923 China (People’s Republic of) 25521
China (People's Republic of) 28171
China (People’s Republic of) 27666 China (People's
Republic of) 6885
China (People’s
Republic of) 11086 Greece 14776 Greece 14083 India 12773 India 14306
US 5323 US 5863 India 9579 India 11399 Greece 12732 Greece 11758
Germany 4765 India 5571 US 7116 US 7924 US 8453 US 8934
Irish Republic 4056 Germany 4550 Irish Republic 4954 Irish Republic 5712 Irish Republic 6435 Irish Republic 6603 France 3917 Irish Republic 4435 Germany 4898 Germany 5204 Germany 5471 Germany 5713 India 3389 France 3930 Malaysia 4375 Taiwan 4520 Taiwan 4685 Nigeria 5664 Taiwan 3345 Malaysia 3709 Taiwan 4233 Malaysia 4296 Nigeria 4563 Pakistan 5161 Malaysia 3284 Taiwan 3694 France 4018 France 4210 France 4405 Taiwan 5050
2004/05 2005/06
increase than for postgraduates which, as mentioned earlier, rose four fold during this period.
1.3 Gender
Table 1.7 shows the breakdown of postgraduates by gender and domicile. Females consisted of just over half (53.4%) of the postgraduate student population in the UK in 2005/06, up from 51.1% in 2000/01. However, amongst UK domiciled
postgraduates, in 2005/06, females accounted for a higher 57.3% of the population. Between 2000/01 and 2005/06, the number of UK domiciled female postgraduates rose by 18.3% compared with only 2.2% for males. Amongst both other EU and non-EU students, females also dominated the percentage growth during this period, but the gender differences were small compared with UK students (Table 1.8).
Table 1.7 Percentage breakdown of postgraduate students by gender and domicile
Table 1.8 Number of postgraduates by gender and domicile (2000/01 – 2005/06) 2000/01 2001/02 2002/03 2003/04 2004/05 2005/06 UK domiciled Female 53.6% 54.8% 55.3% 56.4% 56.9% 57.3% Male 46.4% 45.2% 44.7% 43.6% 43.1% 42.7%
Other EU Female 45.5% 45.6% 46.2% 46.9% 47.8% 48.9%
Male 54.5% 54.4% 53.8% 53.1% 52.2% 51.1%
Non-EU Female 42.5% 42.8% 43.1% 44.0% 43.5% 43.6%
Male 57.5% 57.2% 56.9% 56.0% 56.5% 56.4%
All postgraduates Female 51.1% 52.0% 52.1% 52.9% 53.1% 53.4% Male 48.9% 48.0% 47.9% 47.1% 46.9% 46.6%
UK domiciled
2000/01 2001/02 2002/03 2003/04 2004/05 2005/06
% change between 2000/01 and 2005/06
Female 180925 191455 197513 207232 208551 213997 18.3%
Male 156408 157969 159821 160041 158285 159789 2.2%
Total 337333 349424 357334 367273 366836 373786 10.8%
Other EU
2000/01 2001/02 2002/03 2003/04 2004/05 2005/06
% change between 2000/01 and 2005/06
Female 17594 17627 18885 19404 21919 23003 30.7%
Male 21085 21010 21997 21983 23893 24034 14.0%
Total 38679 38637 40882 41387 45812 47037 21.6%
Non-EU
2000/01 2001/02 2002/03 2003/04 2004/05 2005/06
% change between 2000/01 and 2005/06
Female 30873 35009 42790 50721 52146 54315 75.9%
Male 41811 46780 56496 64446 67837 70231 68.0%
Total 72684 81789 99286 115167 119983 124546 71.4%
All postgraduates
2000/01 2001/02 2002/03 2003/04 2004/05 2005/06
% change between 2000/01 and 2005/06
Female 229392 244091 259188 277357 282616 291315 27.0%
Male 219304 225759 238314 246470 250015 254054 15.8%
For comparison, Tables 1.9 and 1.10 show the gender distribution and number of the undergraduate population in 2000/01 and 2005/06. Females accounted for a higher percentage of the undergraduate population than of the postgraduate population: in 2005/06, 58.5% of undergraduates were females compared with 53.4% for
postgraduates. During the same period, however, there was a larger percentage growth in the number of female postgraduates than female undergraduates: 27% compared with 19% respectively. In addition, amongst UK domiciled students alone, the percentage growth of male undergraduates between 2000/01 and 2005/06 was almost five times higher than for male postgraduates: 10.5% compared with 2.2%.
Another point to note is that comparing 2000/01 and 2005/06, there was no change in the number of male other EU undergraduates, ie the difference in the number of other EU undergraduates between these two years was driven by the increase in females.
Table 1.9 Percentage of female undergraduate students by gender and domicile (2000/01 and 2005/06)
UK domiciled Other EU Non-EU All postgraduates
2000/01 57.7% 50.5% 49.5% 57.1%
2005/06 59.3% 53.3% 49.4% 58.5%
% of female undergraduates within domicile
Table 1.10 Number of undergraduates by gender and domicile (2000/01 and 2005/06)
2000/01 2005/06
% change between 2000/01 and 2005/06
UK domiciled Female 820840 967280 17.8%
Male 601580 664970 10.5%
Total 1422425 1632245 14.8%
Other EU Female 28250 31545 11.7%
Male 27645 27645 0.0%
Total 55900 59185 5.9%
Non-EU Female 31515 49040 55.6%
Male 32095 50270 56.6%
Total 63605 99310 56.1%
All undergraduates Female 880605 1047860 19.0%
Male 661325 742885 12.3%
1.4 Qualification
aim
Table 1.11a shows the breakdown of the number of postgraduate students by qualification aim and domicile between 2000/01 and 2005/06, whilst Table 1.11b shows the percentage distribution of students by domicile.8 Masters degree not mainly by research accounted for the highest numbers of postgraduate students amongst all qualifications, and in 2005/06, it accounted for half (50.8%) of the UK postgraduate student population, up from 44.2% in 2000/01. Much of this growth was driven by the increase in non-EU students, which more than doubled during this period.
On the other hand, the number of UK domiciled postgraduates undertaking a Masters degree mainly by research has declined steadily since 2000/01, and the numbers of non-UK students fluctuated during the period studied. Overall, there were 2,300 fewer postgraduates doing a Masters degree by research in 2005/06 compared with in 2000/01.
Non-UK domiciled students also dominated the growth in numbers undertaking a doctorate degree mainly by research. Between 2000/01 and 2005/06, there has been a mere 0.9% increase in UK-domiciled postgraduates aiming for this qualification, compared with 28.9% for all non-UK students.
Between 2000/01 and 2005/06, there was a significant growth in the number of PGCE students, but this slowed down in latter years. For example, between 2001/02 and 2002/03, the number of PGCE students rose by 13.7%, but the growth was only 1.6% between 2004/05 and 2005/06.
The number of UK domiciled students aiming for institutional postgraduate credits dropped by more than half between 2000/01 and 2005/06. The number of UK students studying for no formal postgraduate qualification, however, had risen 3.6 times in 2005/06 compared with 2000/01. At the same time, the number of non-UK students not aiming for a formal postgraduate qualification fell, albeit from a low base. In fact, in 2000/01, the majority (59.4%) of the postgraduates not aiming for a formal qualification were from overseas, and this dropped to just over one in five (22.1%) in 2005/06.
Overall, 82.9% of postgraduate study in the UK in 2005/06 was represented by three qualifications: masters degree not mainly by research (50.8% of all qualifications), doctorate degree mainly by research (16.8%) and postgraduate diploma or certificate (not PGCE) (15.3%).
The breakdown of qualification aim by subject areas will be discussed later in this report.
Table 1.11a Number of postgraduates by qualification aim and domicile (2000/01-2005/06)
2000/01 2001/02 2002/03 2003/04 2004/05 2005/06
% change between 2000/01 and 2005/06
Doctorate degree mainly by research
UK domiciled 53196 52606 52283 53150 52945 53675 0.9%
Other EU 9276 9369 9534 9896 11071 11705 26.2%
Non-EU 20307 21142 22642 24443 25376 26438 30.2%
Total 82779 83117 84459 87489 89392 91818 10.9%
Doctorate degree not mainly by research
UK domiciled 1242 1444 1547 1695 1988 2058 65.7%
Other EU 61 74 84 93 136 162 165.6%
Non-EU 79 133 116 101 91 142 79.7%
Total 1382 1651 1747 1889 2215 2362 70.9%
Masters degree mainly by research
UK domiciled 16354 15804 15433 14491 13597 13331 -18.5%
Other EU 2613 2457 2598 2451 2730 2659 1.8%
Non-EU 5312 5594 6057 6401 6263 5985 12.7%
Total 24279 23855 24088 23343 22590 21975 -9.5%
Masters degree not mainly by research
UK domiciled 135859 142237 147481 160376 161268 166143 22.3%
Other EU 22327 22208 23438 23758 26424 27244 22.0%
Non-EU 39976 47890 62989 75895 80019 83575 109.1%
Total 198162 212335 233908 260029 267711 276962 39.8%
Postgraduate bachelors degree
UK domiciled 474 367 276 510 706 937 97.7%
Other EU 27 31 66 79 63 74 174.1%
Non-EU 192 154 113 194 188 261 35.9%
Total 693 552 455 783 957 1272 83.5%
Postgraduate diploma or certificate (not PGCE)
UK domiciled 63001 70397 67744 75364 73738 74764 18.7%
Other EU 2898 3002 2840 3101 3044 2869 -1.0%
Non-EU 4749 5040 5486 5968 6010 5809 22.3%
Total 70648 78439 76070 84433 82792 83442 18.1%
Professional qualification at postgraduate level (not PGCE)
UK domiciled 14207 12696 13850 15395 12611 12007 -15.5%
Other EU 176 195 243 247 253 265 50.6%
Non-EU 239 244 235 441 366 291 21.8%
Total 14622 13135 14328 16083 13230 12563 -14.1%
PGCE
UK domiciled 26076 28868 32824 35251 36237 36919 41.6%
Other EU 698 700 780 928 1230 1179 68.9%
Non-EU 197 227 268 331 367 336 70.6%
Total 26971 29795 33872 36510 37834 38434 42.5%
Institutional postgraduate credit
UK domiciled 26234 23436 24390 9767 12398 11495 -56.2%
Other EU 275 287 1033 519 560 573 108.4%
Non-EU 952 574 842 958 1044 1319 38.6%
Total 27461 24297 26265 11244 14002 13387 -51.3%
No formal postgrad qualification
UK domiciled 690 1569 1506 1274 1348 2457 256.1%
Other EU 328 314 266 315 301 307 -6.4%
Non-EU 681 791 538 435 259 390 -42.7%
Table 1.11b Percentage distribution of postgraduates by qualification aim and domicile (2000/01 – 2005/06)
2000/01 2001/02 2002/03 2003/04 2004/05 2005/06
Doctorate degree mainly by research
UK domiciled 64.3% 63.3% 61.9% 60.8% 59.2% 58.5% Other EU 11.2% 11.3% 11.3% 11.3% 12.4% 12.7%
Non-EU 24.5% 25.4% 26.8% 27.9% 28.4% 28.8%
Total 100.0% 100.0% 100.0% 100.0% 100.0% 100.0%
Doctorate degree not mainly by research
UK domiciled 89.9% 87.5% 88.6% 89.7% 89.8% 87.1%
Other EU 4.4% 4.5% 4.8% 4.9% 6.1% 6.9%
Non-EU 5.7% 8.1% 6.6% 5.3% 4.1% 6.0%
Total 100.0% 100.0% 100.0% 100.0% 100.0% 100.0%
Masters degree mainly by research
UK domiciled 67.4% 66.3% 64.1% 62.1% 60.2% 60.7% Other EU 10.8% 10.3% 10.8% 10.5% 12.1% 12.1%
Non-EU 21.9% 23.5% 25.1% 27.4% 27.7% 27.2%
Total 100.0% 100.0% 100.0% 100.0% 100.0% 100.0%
Masters degree not mainly by research
UK domiciled 68.6% 67.0% 63.1% 61.7% 60.2% 60.0%
Other EU 11.3% 10.5% 10.0% 9.1% 9.9% 9.8%
Non-EU 20.2% 22.6% 26.9% 29.2% 29.9% 30.2%
Total 100.0% 100.0% 100.0% 100.0% 100.0% 100.0%
Postgraduate bachelors degree
UK domiciled 68.4% 66.5% 60.7% 65.1% 73.8% 73.7%
Other EU 3.9% 5.6% 14.5% 10.1% 6.6% 5.8%
Non-EU 27.7% 27.9% 24.8% 24.8% 19.6% 20.5%
Total 100.0% 100.0% 100.0% 100.0% 100.0% 100.0%
Postgraduate diploma or certificate (not PGCE)
UK domiciled 89.2% 89.7% 89.1% 89.3% 89.1% 89.6%
Other EU 4.1% 3.8% 3.7% 3.7% 3.7% 3.4%
Non-EU 6.7% 6.4% 7.2% 7.1% 7.3% 7.0%
Total 100.0% 100.0% 100.0% 100.0% 100.0% 100.0%
Professional qualification at postgraduate level (not PGCE)
UK domiciled 97.2% 96.7% 96.7% 95.7% 95.3% 95.6%
Other EU 1.2% 1.5% 1.7% 1.5% 1.9% 2.1%
Non-EU 1.6% 1.9% 1.6% 2.7% 2.8% 2.3%
Total 100.0% 100.0% 100.0% 100.0% 100.0% 100.0%
PGCE
UK domiciled 96.7% 96.9% 96.9% 96.6% 95.8% 96.1%
Other EU 2.6% 2.3% 2.3% 2.5% 3.3% 3.1%
Non-EU 0.7% 0.8% 0.8% 0.9% 1.0% 0.9%
Total 100.0% 100.0% 100.0% 100.0% 100.0% 100.0%
Institutional postgraduate credit
UK domiciled 95.5% 96.5% 92.9% 86.9% 88.5% 85.9%
Other EU 1.0% 1.2% 3.9% 4.6% 4.0% 4.3%
Non-EU 3.5% 2.4% 3.2% 8.5% 7.5% 9.9%
Total 100.0% 100.0% 100.0% 100.0% 100.0% 100.0%
No formal postgrad qualification
UK domiciled 40.6% 58.7% 65.2% 62.9% 70.6% 77.9% Other EU 19.3% 11.7% 11.5% 15.6% 15.8% 9.7%
Non-EU 40.1% 29.6% 23.3% 21.5% 13.6% 12.4%
New entrants by qualification aim
The figures above refer to the total number of postgraduates, we will now look at new entrants alone. Table 1.12 and Figures 1.4a-j show the number of first year
postgraduates by qualification aim and domicile.
Figures 1.4 a-j. Number of first year postgraduates by qualification aim and domicile.
(a) Doctorate degree mainly by research
0 2000 4000 6000 8000 10000 12000
2000/01 2001/02 2002/03 2003/04 2004/05 2005/06 UK Non-EU Other EU
(b) Doctorate degree not mainly by research
0 100 200 300 400 500 600 700
2000/01 2001/02 2002/03 2003/04 2004/05 2005/06 UK Non-EU Other EU
(c) Masters degree mainly by research
0 1000 2000 3000 4000 5000 6000 7000
2000/01 2001/02 2002/03 2003/04 2004/05 2005/06 UK Non-EU Other EU
(d) Masters degree not mainly by research
0 10000 20000 30000 40000 50000 60000 70000 80000
2000/01 2001/02 2002/03 2003/04 2004/05 2005/06 UK Non-EU Other EU
(e) Postgraduate bachelors degree
0 100 200 300 400 500 600
2000/01 2001/02 2002/03 2003/04 2004/05 2005/06 UK Non-EU Other EU
(f) Postgraduate diploma or certificate (not PGCE)
0 10000 20000 30000 40000 50000
2000/01 2001/02 2002/03 2003/04 2004/05 2005/06 UK Non-EU Other EU
(g) Professional qualification at postgraduate level (not PGCE) 0 2000 4000 6000 8000 10000 12000
2000/01 2001/02 2002/03 2003/04 2004/05 2005/06 UK Non-EU Other EU (h) PGCE 0 5000 10000 15000 20000 25000 30000 35000
2000/01 2001/02 2002/03 2003/04 2004/05 2005/06 UK Other EU Non-EU
(i) Institutional postgraduate credit
0 2000 4000 6000 8000 10000 12000 14000
2000/01 2001/02 2002/03 2003/04 2004/05 2005/06 UK Non-EU Other EU
(j) No formal postgraduate qualification
0 500 1000 1500 2000 2500
Table 1.12. Number of first year postgraduates by domicile (2000/01 – 2005/06)
2000/01 2001/02 2002/03 2003/04 2004/05 2005/06
% change 2000/01 - 2005/06
Doctorate degree mainly by research
UK 9604 9647 9607 10255 9896 10255 6.8%
Other EU 1806 1692 1745 1923 2309 2420 34.0%
Non-EU 4127 4385 4760 5255 5290 5201 26.0%
Total 15537 15724 16112 17433 17495 17876 15.1%
Doctorate degree not mainly by research
UK 405 492 505 479 542 650 60.5%
Other EU 27 19 46 27 50 41 51.9%
Non-EU 17 45 56 35 24 68 300.0%
Total 449 556 607 541 616 759 69.0%
Masters degree mainly by research
UK 6480 6061 5994 5759 5432 5698 -12.1%
Other EU 1235 1139 1219 1106 1383 1294 4.8%
Non-EU 2602 2831 3024 3248 3044 2982 14.6%
Total 10317 10031 10237 10113 9859 9974 -3.3%
Masters degree not mainly by research
UK 61495 63868 67071 70408 68482 72835 18.4%
Other EU 13415 13108 13821 13601 15259 15460 15.2%
Non-EU 23891 30699 41510 47586 49340 49365 106.6%
Total 98801 107675 122402 131595 133081 137660 39.3%
Postgraduate bachelors degree
UK 161 152 152 371 420 511 217.4%
Other EU 16 19 39 54 37 50 212.5%
Non-EU 114 74 79 132 126 198 73.7%
Total 291 245 270 557 583 759 160.8%
Postgraduate diploma or certificate (not PGCE)
UK 35558 40939 38341 43636 40770 43039 21.0%
Other EU 1867 1937 1816 1815 1843 1798 -3.7%
Non-EU 3023 3317 3735 3756 4002 3790 25.4%
Total 40448 46193 43892 49207 46615 48627 20.2%
Professional qualification at postgraduate level (not PGCE)
UK 10481 8791 9757 11101 8499 8032 -23.4%
Other EU 105 139 167 154 165 163 55.2%
Non-EU 198 178 171 349 268 196 -1.0%
Total 10784 9108 10095 11604 8932 8391 -22.2%
PGCE
UK 23862 26004 28844 30577 31289 31731 33.0%
Other EU 669 678 755 897 1170 1098 64.1%
Non-EU 191 211 252 297 333 286 49.7%
Total 24722 26893 29851 31771 32792 33115 33.9%
Institutional postgraduate credit
UK 11405 11728 12350 7554 8882 9388 -17.7%
Other EU 213 218 926 359 369 384 80.3%
Non-EU 426 375 593 719 806 959 125.1%
Total 12044 12321 13869 8632 10057 10731 -10.9%
No formal postgraduate qualification
UK 486 1080 1101 866 952 1947 300.6%
Other EU 281 259 224 257 253 228 -18.9%
Non-EU 618 702 457 380 230 337 -45.5%
As expected, the trends in the numbers of new starters across the years mirror those of the total enrolments seen in Table 1.12:
• (a) Doctorate degree mainly by research – The number of new entrants had been growing between 2000/01 and 2005/06, with much of the percentage growth attributed to non-UK domiciled students. Overall, non-UK students accounted for around two in five of the first year cohort.
• (b) Doctorate degree not mainly by research – The numbers here were very small compared with other postgraduate qualifications (except postgraduate bachelors degree). Overseas students accounted for a much smaller
proportion of the total first year cohort here: between one in ten and one in six across the years. Despite a drop in 2003/04, the numbers of new entrants have since risen.
• (c)Masters degree mainly by research – There was a general decline in the number of UK-domiciled new starters over the years although in 2005/06, there was a 4.9% year-on-year rise. Conversely, the number of non-UK domiciled first year students rose steadily between 2000/01 and 2004/05, but in 2005/06, this fell slightly by 3.4% (6.4% and 2% drop of other EU students and non-EU students respectively).
• (d) Masters degree not mainly by research – This had the highest numbers of new starters amongst all postgraduate courses and non-EU students
accounted for an increasing proportion of the new starters, from just under a quarter (24.2%) in 2000/01 to over a third (35.9%) in 2005/06. In 2005/06, just under half (47.1%) of the new starters were from overseas.
• (e) Postgraduate bachelors degree – Despite accounting for less than 1% of the first year postgraduate population, the number of students undertaking postgraduate bachelors degrees rose rapidly from 2002/03 onwards. Between 2000/01 and 2005/06, the number of UK domiciled new starters rose by over three fold whilst non-UK domiciled students almost doubled, albeit from a very low base.
• (f) Postgraduate diploma or certificate (not PGCE) – This accounted for just under one in five of all first year postgraduate students and non-UK domiciled students accounted for around one in nine of the new starters. Although the number of new starters went up by 20.2% between 2000/01 and 2005/06, there were ups and downs during this period.
• (g) Professional qualification at postgraduate level (not PGCE) – The numbers of new starters dropped by over a quarter between 2003/04 and 2005/06. Overall, there were 2,400 fewer first year students in 2005/06 compared with 2000/01.
• (h) PGCE - The number of new entrants rose steadily between 2000/01 and 2005/06, although the rates of growth had fallen since 2003/04. In 2005/06, PGCE students accounted for one in eight (12.2%) of all postgraduate new starters.
Qualification aim by gender
Table 1.13 shows the percentage of female postgraduates by qualification aim and domicile between 2000/01 and 2005/06.
Table 1.13. Percentage of female postgraduates by qualification aim and domicile (2000/01 – 2005/06)
2000/01 2001/02 2002/03 2003/04 2004/05 2005/06 Doctorate degree mainly by research
UK domiciled 43.8% 44.9% 44.9% 45.6% 46.0% 46.3%
Other EU 43.0% 43.2% 43.3% 43.7% 44.1% 44.6%
Non-EU 35.8% 36.3% 37.2% 38.7% 38.9% 39.4%
Total 41.7% 42.5% 42.6% 43.5% 43.7% 44.1%
Doctorate degree not mainly by research
UK domiciled 67.0% 67.2% 63.9% 66.7% 67.5% 69.1%
Other EU 36.1% 37.8% 40.5% 48.4% 49.3% 49.4%
Non-EU 39.2% 45.1% 36.2% 40.6% 42.9% 26.8%
Total 64.0% 64.1% 61.0% 64.4% 65.4% 65.2%
Masters degree mainly by research
UK domiciled 45.5% 46.0% 46.4% 46.4% 47.6% 48.2%
Other EU 45.6% 44.2% 46.1% 46.5% 47.1% 46.8%
Non-EU 39.6% 40.0% 39.8% 39.8% 40.3% 41.1%
Total 44.2% 44.4% 44.7% 44.6% 45.5% 46.1%
Masters degree not mainly by research
UK domiciled 51.4% 52.3% 52.5% 53.4% 54.2% 54.9%
Other EU 44.6% 44.7% 45.2% 46.3% 47.3% 49.0%
Non-EU 45.7% 45.4% 45.3% 45.9% 45.0% 45.0%
Total 49.5% 50.0% 49.8% 50.5% 50.8% 51.3%
Postgrad bachelors degree
UK domiciled 57.6% 62.4% 50.0% 52.7% 55.1% 61.2%
Other EU 48.1% 38.7% 36.4% 31.6% 42.9% 50.0%
Non-EU 67.7% 63.0% 31.0% 42.3% 31.4% 42.5%
Total 60.0% 61.2% 43.3% 48.0% 49.6% 56.7%
Postgrad dip or cert
UK domiciled 59.8% 61.3% 62.4% 62.4% 62.1% 62.9%
Other EU 49.6% 51.5% 51.0% 51.3% 52.1% 53.8%
Non-EU 42.4% 45.3% 44.1% 44.4% 42.8% 44.0%
Total 58.2% 59.9% 60.7% 60.7% 60.4% 61.2%
Professional qualification
UK domiciled 65.0% 66.2% 68.4% 67.5% 66.9% 67.4%
Other EU 49.4% 55.9% 61.3% 55.9% 56.5% 57.7%
Non-EU 53.1% 49.2% 52.3% 53.5% 54.6% 48.8%
Total 64.7% 65.7% 68.0% 67.0% 66.4% 66.7%
PGCE
UK domiciled 70.2% 70.1% 69.5% 69.1% 69.3% 69.2%
Other EU 79.4% 78.3% 78.6% 76.4% 79.5% 77.7%
Non-EU 76.1% 73.1% 67.9% 63.7% 62.9% 60.4%
Total 70.5% 70.3% 69.7% 69.2% 69.6% 69.4%
Institutional postgrad credit
UK domiciled 51.8% 51.5% 52.3% 67.6% 66.8% 61.4%
Other EU 61.5% 56.8% 54.6% 48.4% 51.4% 52.0%
Non-EU 51.5% 56.1% 51.7% 47.7% 48.0% 51.2%
Total 51.9% 51.7% 52.4% 65.1% 64.7% 60.0%
No formal postgrad qualification
UK domiciled 65.4% 68.5% 70.9% 70.1% 66.5% 75.3%
Other EU 54.3% 53.8% 47.7% 57.8% 53.8% 49.8%
Non-EU 40.1% 39.7% 39.2% 50.1% 48.3% 36.7%
Total 53.1% 58.3% 60.9% 63.9% 62.1% 68.0%
All postgraduates
UK domiciled 53.6% 54.8% 55.3% 56.4% 56.9% 57.3%
Other EU 45.5% 45.6% 46.2% 46.9% 47.8% 48.9%
Non-EU 42.5% 42.8% 43.1% 44.0% 43.5% 43.6%
Total 51.1% 52.0% 52.1% 52.9% 53.1% 53.4%
During this period, the largest rise in the percentage of females amongst all qualifications were in students enrolling on courses with no formal postgraduate qualifications (from 53.1% females in 2000/01 to 68% in 2005/06), and those taking institutional postgraduate credits (from 51.9% to 60%). With the exceptions of
doctorate/masters degree mainly by research, females accounted for over half of the postgraduate population across all qualification aims. In addition, breakdown by domicile shows that females accounted for a higher proportion of UK-domiciled postgraduates compared with other EU and non-EU postgraduates. The only exception of which was PGCE, where there was a higher proportion of females amongst other EU students compared with for UK-domiciled students.
1.5 Age
Table 1.14 shows the number of postgraduates by age and domicile between
2000/01 and 2005/06, whilst Table 1.15 gives the percentage distribution across age group by domicile. Table 1.16 compares the mean and median age by domicile in 2000/01 and 2005/06.
Table 1.14 Number of postgraduates by age and domicile (2000/01 – 2005/06)
2000/01 2001/02 2002/03 2003/04 2004/05 2005/06
% change between 2000/01 and 2005/06
UK-domiciled Under 21 years 115 137 186 99 83 91 -20.9% 21-24 years 52802 56235 59164 60603 60062 60895 15.3% 25-29 years 74685 75078 77585 82078 85299 89359 19.6% 30-39 years 108809 111188 110273 109908 106649 105776 -2.8% 40-49 years 69790 73390 74342 76717 76429 78241 12.1% 50-59 years 25373 27342 29030 30883 31384 32408 27.7% Over 60 years 3598 3955 4288 4623 4909 5346 48.6%
Unknown 2161 2099 2466 2362 2021 1670 -22.7%
All ages 337333 349424 357334 367273 366836 373786 10.8%
% of students of unknown age 0.6% 0.6% 0.7% 0.6% 0.6% 0.4%
Other EU Under 21 years 21 12 10 15 15 14 -33.3%
21-24 years 11534 11313 11069 10661 11295 11146 -3.4% 25-29 years 16036 16313 17396 17544 19738 20569 28.3% 30-39 years 8347 8211 9104 9547 10656 11026 32.1%
40-49 years 1983 2023 2367 2583 2966 3073 55.0%
50-59 years 610 602 699 812 916 961 57.5%
Over 60 years 83 95 104 124 151 179 115.7%
Unknown 65 68 133 101 75 69 6.2%
All ages 38679 38637 40882 41387 45812 47037 21.6%
% of students of unknown age 0.2% 0.2% 0.3% 0.2% 0.2% 0.1%
Non-EU Under 21 years 90 117 123 125 117 119 32.2%
21-24 years 11027 14543 21190 26011 28458 30453 176.2% 25-29 years 24053 27887 34974 42343 44952 46437 93.1% 30-39 years 25679 28020 31196 33929 33955 34555 34.6%
40-49 years 9207 8788 9205 9948 9728 10037 9.0%
50-59 years 2141 2029 2126 2329 2316 2454 14.6%
Over 60 years 235 229 243 282 298 357 51.9%
Unknown 252 176 229 200 159 134 -46.8%
All ages 72684 81789 99286 115167 119983 124546 71.4%
% of students of unknown age 0.3% 0.2% 0.2% 0.2% 0.1% 0.1%
All postgraduates Under 21 years 226 266 319 239 215 224 -0.9% 21-24 years 75363 82091 91423 97275 99815 102494 36.0% 25-29 years 114774 119278 129955 141965 149989 156365 36.2% 30-39 years 142835 147419 150573 153384 151260 151357 6.0% 40-49 years 80980 84201 85914 89248 89123 91351 12.8% 50-59 years 28124 29973 31855 34024 34616 35823 27.4% Over 60 years 3916 4279 4635 5029 5358 5882 50.2%
Unknown 2478 2343 2828 2663 2255 1873 -24.4%
All ages 448696 469850 497502 523827 532631 545369 21.5%
Table 1.15 Age distribution of postgraduates 2000/01-2005/06
Table 1.16 Mean and median age of postgraduates in 2000/01 and 2005/06 by domicile
2000/01 2001/02 2002/03 2003/04 2004/05 2005/06
UK-domiciled Under 21 years 0.0% 0.0% 0.1% 0.0% 0.0% 0.0%
21-24 years 15.8% 16.2% 16.7% 16.6% 16.5% 16.4%
25-29 years 22.3% 21.6% 21.9% 22.5% 23.4% 24.0%
30-39 years 32.5% 32.0% 31.1% 30.1% 29.2% 28.4%
40-49 years 20.8% 21.1% 20.9% 21.0% 21.0% 21.0%
50-59 years 7.6% 7.9% 8.2% 8.5% 8.6% 8.7%
Over 60 years 1.1% 1.1% 1.2% 1.3% 1.3% 1.4%
Total of known age 100.0% 100.0% 100.0% 100.0% 100.0% 100.0%
% of students whose age
was unknown 0.6% 0.6% 0.7% 0.6% 0.6% 0.4%
Other EU Under 21 years 0.1% 0.0% 0.0% 0.0% 0.0% 0.0%
21-24 years 29.9% 29.3% 27.2% 25.8% 24.7% 23.7%
25-29 years 41.5% 42.3% 42.7% 42.5% 43.2% 43.8%
30-39 years 21.6% 21.3% 22.3% 23.1% 23.3% 23.5%
40-49 years 5.1% 5.2% 5.8% 6.3% 6.5% 6.5%
50-59 years 1.6% 1.6% 1.7% 2.0% 2.0% 2.0%
Over 60 years 0.2% 0.2% 0.3% 0.3% 0.3% 0.4%
Total of known age 100.0% 100.0% 100.0% 100.0% 100.0% 100.0%
% of students whose age
was unknown 0.2% 0.2% 0.3% 0.2% 0.2% 0.1%
Non-EU Under 21 years 0.1% 0.1% 0.1% 0.1% 0.1% 0.1%
21-24 years 15.2% 17.8% 21.4% 22.6% 23.7% 24.5%
25-29 years 33.2% 34.2% 35.3% 36.8% 37.5% 37.3%
30-39 years 35.5% 34.3% 31.5% 29.5% 28.3% 27.8%
40-49 years 12.7% 10.8% 9.3% 8.7% 8.1% 8.1%
50-59 years 3.0% 2.5% 2.1% 2.0% 1.9% 2.0%
Over 60 years 0.3% 0.3% 0.2% 0.2% 0.2% 0.3%
Total of known age 100.0% 100.0% 100.0% 100.0% 100.0% 100.0%
% of students whose age
was unknown 0.3% 0.2% 0.2% 0.2% 0.1% 0.1%
All postgraduates Under 21 years 0.1% 0.1% 0.1% 0.0% 0.0% 0.0%
21-24 years 16.9% 17.6% 18.5% 18.7% 18.8% 18.9%
25-29 years 25.7% 25.5% 26.3% 27.2% 28.3% 28.8%
30-39 years 32.0% 31.5% 30.4% 29.4% 28.5% 27.8%
40-49 years 18.1% 18.0% 17.4% 17.1% 16.8% 16.8%
50-59 years 6.3% 6.4% 6.4% 6.5% 6.5% 6.6%
Over 60 years 0.9% 0.9% 0.9% 1.0% 1.0% 1.1%
Total of known age 100.0% 100.0% 100.0% 100.0% 100.0% 100.0%
% of students whose age
was unknown 0.6% 0.5% 0.6% 0.5% 0.4% 0.3%
UK domiciled
Other EU Non-EU All postgraduatesMean age 2000/01 35 28 32 34
2005/06 35 29 30 33
Median age 2000/01 33 26 30 31
Between 2000/01 and 2005/06, there was a general shift towards a younger
postgraduate population, and this was mainly attributed to a younger and larger non-EU student population. Amongst all postgraduates, the largest increase was in those from the 25-29 age group (up by 41,591), followed by those aged 21-24 (up by 27,131). Amongst UK domiciled students alone, the largest rise in numbers was also seen in those aged 25-29 (up 14,674), but the second highest rise was for those aged 40-49. At the same time, there was a drop of over 3,000 in the number of UK students aged 30-39, although in terms of percentage, this was only a 2.8% fall.
In 2005/06, a quarter (24.5%) of the non-EU postgraduate population came from the 21-24 age group compared with 15.2% in 2000/01, and three in five (61.8%) were under 30 years of age compared with under half (48.6 %) in 2000/01. On the
contrary, those from other EU countries were getting older: three in ten (29.9%) were aged 21-24 in 2000/01 and this fell to under a quarter (23.7%) in 2005/06. These changes were also represented in the changes in the mean and median age (Table 1.16).
Age and qualification aim
Table 1.17 compares the mean and median age of postgraduate students in 2000/01 and 2005/06 by qualification aim and domicile, whilst Table 1.18 and 1.19 show the numbers and percentages breakdown respectively of qualification aim by age for the academic years between 2000/01 and 2005/06.
Breakdown of qualification aim by age and domicile can be found in Appendix A (Tables A – F).
Table 1.17 Mean and median age of the 2000/01 and 2005/06 postgraduate cohorts by qualification aim.9
9
Students aged above 97 have been excluded in this analysis: students above age 97 in the HESA data were coded as ‘over 97 years old’ and did not have their actual age recorded.
2000/01 2005/06 2000/01 2005/06 Mean age Mean age Median age Median age Doctorate degree mainly by research
UK-domiciled 33 34 30 30
Other EU 30 31 29 29
Non-EU 34 33 33 32
All 33 33 30 30
Doctorate degree not mainly by research
UK-domiciled 37 38 35 37
Other EU 36 42 34 42
Non-EU 39 40 39 40
All 37 39 35 38
Masters degree mainly by research
UK-domiciled 34 34 31 30
Other EU 29 29 27 28
Non-EU 32 31 30 29
All 33 33 30 29
Masters degree not mainly by research
UK-domiciled 35 35 33 33
Other EU 27 28 25 26
Non-EU 30 28 28 26
All 33 32 31 29
Postgraduate bachelors degree
UK-domiciled 38 34 38 32
Other EU 27 27 24 26
Non-EU 30 27 27 26
All 35 32 33 30
Postgraduate diploma or certificate (not PGCE)
UK-domiciled 36 37 35 35
Other EU 30 32 27 29
Non-EU 33 32 31 30
All 35 36 34 35
Professional qualification at postgraduate level (not PGCE)
UK-domiciled 35 33 32 30
Other EU 28 27 26 26
Non-EU 29 30 28 28
All 34 33 32 30
PGCE
UK-domiciled 30 30 27 27
Other EU 26 27 24 26
Non-EU 28 31 25 28
All 30 30 26 27
Institutional postgraduate credit
UK-domiciled 39 40 38 40
Other EU 32 33 30 31
Non-EU 39 34 38 32
All 39 39 38 38
No formal postgraduate qualification
UK-domiciled 38 40 37 40
Other EU 29 28 27 27
Non-EU 32 31 30 30
Table 1.18 Number of postgraduates by qualification aim and age (2000/01 – 2005/06)
2000/01 2001/02 2002/03 2003/04 2004/05 2005/06
Change in number
2000-01 - 2005/06 % change Doctorate degree by research
Under 21 years 9 6 8 7 8 10 1 11.1%
21-24 years 9620 9895 9846 10018 9545 9146 -474 -4.9%
25-29 years 28177 27766 28541 30131 31762 33712 5535 19.6% 30-39 years 27316 27558 27603 28076 28313 28727 1411 5.2% 40-49 years 11717 11795 11905 12451 12710 12808 1091 9.3%
50-59 years 4765 4909 5156 5405 5530 5793 1028 21.6%
Over 60 years 1083 1110 1234 1326 1444 1530 447 41.3%
Unknown 92 78 166 75 80 92 0 0.0%
Total 82779 83117 84459 87489 89392 91818 9039 10.9%
Doctorate degree not mainly by research
Under 21 years 0 0 0 0 0 0 0 _
21-24 years 47 48 47 47 50 48 1 2.1%
25-29 years 371 349 389 490 602 597 226 60.9%
30-39 years 431 521 500 506 622 634 203 47.1%
40-49 years 333 454 489 500 527 636 303 91.0%
50-59 years 169 242 276 311 357 382 213 126.0%
Over 60 years 25 33 40 29 51 58 33 132.0%
Unknown 6 4 6 6 6 7 1 16.7%
Total 1382 1651 1747 1889 2215 2362 980 70.9%
Masters degree mainly by research
Under 21 years 3 5 1 5 5 5 2 66.7%
21-24 years 4929 4801 5168 4849 4600 4379 -550 -11.2%
25-29 years 6555 6594 6508 6795 6967 6872 317 4.8%
30-39 years 7218 6915 6932 6552 6161 5906 -1312 -18.2%
40-49 years 3485 3474 3406 3182 3008 2977 -508 -14.6%
50-59 years 1591 1553 1498 1426 1335 1294 -297 -18.7%
Over 60 years 470 490 509 519 499 515 45 9.6%
Unknown 28 23 66 15 15 27 -1 -3.6%
Total 24279 23855 24088 23343 22590 21975 -2304 -9.5%
Masters degree not mainly by research
Under 21 years 69 87 103 123 120 107 38 55.1%
21-24 years 38146 43283 51546 56296 59272 62007 23861 62.6% 25-29 years 50919 54772 63086 71699 76310 80506 29587 58.1% 30-39 years 62934 65706 69284 74116 73073 73233 10299 16.4% 40-49 years 33216 34774 35620 40604 41237 42427 9211 27.7% 50-59 years 10724 11476 11649 13830 14461 15271 4547 42.4%
Over 60 years 1491 1650 1760 2317 2386 2689 1198 80.3%
Unknown 663 587 860 1044 852 722 59 8.9%
Total 198162 212335 233908 260029 267711 276962 78800 39.8%
Postgraduate bachelors degree
Under 21 years 0 1 0 1 0 0 0 _
21-24 years 114 104 120 138 203 266 152 133.3%
25-29 years 164 137 125 229 280 360 196 119.5%
30-39 years 171 163 116 230 263 369 198 115.8%
40-49 years 162 102 58 145 172 210 48 29.6%
50-59 years 68 36 19 39 37 64 -4 -5.9%
Over 60 years 6 7 7 1 2 2 -4 -66.7%
Unknown 8 2 10 0 0 1 -7 -87.5%
Total 693 552 455 783 957 1272 579 83.5%
Postgraduate diploma or certificate (not PGCE)
Under 21 years 47 62 133 43 30 37 -10 -21.3%
21-24 years 8941 10449 9470 9390 9344 9482 541 6.1%
25-29 years 14368 15119 15170 16797 17187 17672 3304 23.0% 30-39 years 23843 25395 24080 27086 26126 26076 2233 9.4% 40-49 years 16599 18925 18554 20738 19919 20219 3620 21.8%
50-59 years 5535 6907 7339 8803 8540 8544 3009 54.4%
Over 60 years 355 463 433 578 636 682 327 92.1%
Unknown 960 1119 891 998 1010 730 -230 -24.0%
2000/01 2001/02 2002/03 2003/04 2004/05 2005/06