ERTHYGL YSTADEGOL STATISTICAL ARTICLE
A brief analysis of education by main equality strands
Please see footnote at end of this page for a brief summary of statistical articles and contact details for any aspect of this article.1
There were very noticeable differentials in school performance across the equality strands.
Key points on school performance at Key Stage 4:
Ethnicity
• On each of the main pupil performance measures at Key Stage 4 (KS4), Chinese pupils performed better than all other ethnic groups. On average, they achieved the highest average point score, had the highest proportion of pupils obtaining 5 or more GCSEs at grades A*-C, and the highest proportion of pupils achieving the Core Subject Indicator (CSI). Against each of these measures, the next most successful ethnic groups were the Mixed White/Asian and Indian groups.
• Against the same indicators, pupils from the Black African ethnic group achieved the lowest results, whilst pupils from the Mixed White/Black Caribbean group were in the lowest three performing ethnic groups when measured against each indicator. Whilst the proportion of pupils from both the Bangladeshi and Pakistani ethnic groups who achieved 5 or more GCSEs at grade A*-C was relatively low, the proportion achieving at least 1 GCSE at grade A*-G was high. This indicates that whilst these pupils are not attaining the highest levels, they are still gaining worthwhile qualifications. However, the Black African ethnic group, who had the lowest proportion attaining 5 or more GCSEs at grades A*-C also had the lowest proportion of pupils achieving at least 1 GCSE at grade A*-G.
• Chinese and Indian pupils were the only groups where more than 50 per cent achieved the Core Subject Indicator. The lowest proportions attaining CSI were amongst the Black African, Mixed White/Black Caribbean and Bangladeshi groups.
1
Date of Publication: 14 December 2006 Next Update: Not a regular update
Author: Robert Lee, Social Justice and Equality Statistics, Statistical Directorate E-mail: [email protected]
Telephone: 029 2082 6023
Gender
• In terms of average point score, girls performed better than boys across the majority of ethnic groups for which analysis was possible. This was particularly noticeable in the Pakistani group and to a lesser extent in the Other Mixed Background and Mixed White/Black Caribbean groups. Boys scored noticeably better than girls in just one group, the Indian group.
• The proportion of boys and girls attaining at least 1 GCSE at grade A*-G was similar across all ethnic groups, with the exception of the Mixed White/Black Caribbean group. Here, the proportion of girls attaining this level was noticeably higher than that for boys.
Socio-Economic Status
• Those pupils eligible for Free School Meals (FSMs) at KS4 achieve an average point score just over half of those who are not eligible. A link between educational attainment and FSM entitlement appears to be supported, as a relatively small proportion of Chinese and Indian pupils are eligible for FSM, compared to more than half of Black African pupils and more than one third of Bangladeshi pupils.
Key Points on Involvement in Post-16 Education
Ethnicity
• The proportion of Welsh domiciled enrolments to higher education from the ethnic minority population as a whole was greater than their overall proportion within the population, and was particularly high amongst the Asian group.
• While the proportion of students enrolled at Further Education Institutions from the minority ethnic population was above their proportion within the population as a whole, the proportion of Welsh domiciled first year students on Initial Teacher Training courses from the minority ethnic population was below this overall proportion.
Gender
• Participation in education has remained at a similar level for those aged 16 to 30 since 1999, and there is some evidence that the gap between males and females entering full-time education or training has increased in this period, with the proportion of females increasing.
• There has been a shift in the gender profile in Higher Education in Wales. Prior to 1995/96, more males entered Higher Education, but since 1996/96, when the ratio of males and females entering higher education was about 50:50, females have outnumbered males with the gap gradually increasing each year.
• In 2004/5, three quarters of first year students on Initial Teacher Training (ITT) were female.
Disability
• The proportion of Welsh domiciled enrolments to Higher Education from disabled students at both undergraduate and postgraduate level was below the proportion of disabled people recorded in the Welsh Local Labour Force Survey (WLLFS).
• The proportion of disabled students enrolling to Further Education Institutions and of Welsh domiciled disabled students in their first year of Initial Teacher Training were also below the level recorded by the WLLFS.
Key Points on Highest Qualifications
Ethnicity
• According to the 2001 Census, the Bangladeshi population has the lowest proportion with a higher level qualification and the highest proportion with no qualifications. The Other ethnic, Indian, Other Asian (not Bangladeshi, Indian or Pakistani) and Black African groups are the highest qualified, though the impact of overseas students must be considered.
Gender
Detailed Analysis
The first section of this article uses pupil level data from the National Pupil Database (NPD) which links data on pupil ethnic background from the Pupil Level Annual School Census
(PLASC) to attainment and examination information at Key Stage 4 (KS4). This allows analysis of attainment of pupils from different ethnic backgrounds. PLASC data is derived from the
January 2005 census, attainment data from the following Summer term of 2005. The analysis of attainment by ethnic group is of particular interest because it is the first time that examination performance at KS4 has been linked to ethnicity in Wales. However, other equality themes such as gender and free school meal eligibility are also examined.
Topics on continuing education are covered in later sections. These are primarily the synthesis of existing data that has been published previously. In these instances, the most recent
available data is referenced.
The final two sections cover key quality information that should be read in conjunction with the article and a list of useful sources.
1 Analysis of School Level Education
1.1 School Performance at KS4
Three key measures of pupil performance are looked at in this analysis; average point score, examination category attained and the attainment of the Core Subject Indicator (CSI). Each of these measures is explained in the relevant section.
The analysis on school performance must be read in conjunction with the statement on quality at the end of this section. In particular, attention is drawn to the following:
5
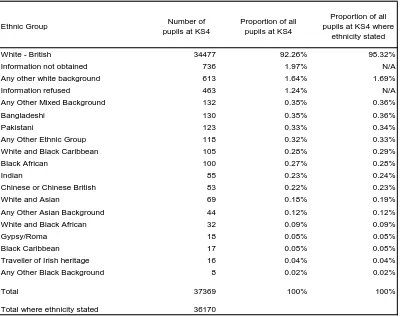
Table 1: Number and proportion of pupils on National Pupil Database at KS4, 20051
Ethnic Group Number of pupils at KS4
Proportion of all pupils at KS4
Proportion of all pupils at KS4 where
ethnicity stated White - British 34477 92.26% 95.32% Information not obtained 736 1.97% N/A Any other white background 613 1.64% 1.69%
Information refused 463 1.24% N/A
Any Other Mixed Background 132 0.35% 0.36%
Bangladeshi 130 0.35% 0.36%
Pakistani 123 0.33% 0.34%
Any Other Ethnic Group 118 0.32% 0.33% White and Black Caribbean 105 0.28% 0.29%
Black African 100 0.27% 0.28%
Indian 85 0.23% 0.24%
Chinese or Chinese British 83 0.22% 0.23%
White and Asian 69 0.18% 0.19%
Any Other Asian Background 44 0.12% 0.12% White and Black African 32 0.09% 0.09%
Gypsy/Roma 18 0.05% 0.05%
Black Caribbean 17 0.05% 0.05%
Traveller of Irish heritage 16 0.04% 0.04% Any Other Black Background 8 0.02% 0.02%
Total 37369 100% 100%
Total where ethnicity stated 36170
Source: National Pupil Database
1
1.1.1 Average Scores
Chinese, Indian and White/Asian pupils achieved the highest average scores, Black African pupils the lowest; girls performed better than boys in most ethnic groups, particularly amongst the Pakistani population
There are three key measures of pupil performance at KS4, the first of which is point score. This calculation is based on the grades achieved by pupils at GCSE/GNVQ; the higher the grade, the higher the point score. Details of how the point score is calculated are included in the Glossary of the Welsh Assembly Government’s “Schools in Wales: Examination Performance 2005” publication. (http://www.wales.gov.uk/topics/statistics/publications/swep2005/?lang=en) • In 2005, the average score for all pupils at KS4 was 40 points. Chinese pupils scored
highest (52 points) followed by Mixed White and Asian (henceforth referred to as
White/Asian) and Indian pupils (46 and 45 points respectively). Of the other ethnic groups, pupils from the Other White Background group and the Mixed White and Black African group (the latter henceforth referred to as the White/Black African group) also achieved an average score above the Wales average. The lowest average scores were found in the Black African group (27 points), the Mixed White and Black Caribbean (henceforth referred to as
White/Black Caribbean) group (32 points) and the Bangladeshi group (33 points). (See Chart 1).
The small number of pupils from the Other Asian and Mixed White/Black African groups means that a comparison of male and female average point score would not be meaningful, but all other ethnic groups were analysed.
• At the national level, the value of boys’ scores was 85 per cent that of girls’ scores. On average, girls scored more highly than boys and this was reflected in the majority of ethnic groups, but particularly amongst the Pakistani, Any Other Mixed and White/Black Caribbean groups. Here, the value of boys’ average scores were 68, 75 and 76 per cent respectively of the average scores of girls. Chart 2 shows average points score by ethnicity and gender, the order of the ethnic groups on the chart being determined by the relative performance of boys and girls. The better girls perform in relation to boys from the same ethnic group, the higher these groups appear in the chart. Whilst Pakistani boys’ average score was relatively low (32 points), the Pakistani girls’ average of 47 was lower than just three other female ethnic
groups, and only 6 points less than the highest ranked (Chinese).
7
Chart 1: Average points at KS4 by ethnic group, 2005
0 10 20 30 40 50 60
Black African White and Black Caribbean Bangladeshi Any Other Ethnic Group Any Other Asian Background Pakistani Any Other Mixed Background White - British White and Black African Any other white background Indian White and Asian Chinese or Chinese British
Chart 2: Average point score at KS4 by ethnicity and gender, 2005
0 10 20 30 40 50 60
Indian Black African Any Other Ethnic Group Chinese or Chinese British White and Asian White - British Any other white background Bangladeshi White and Black Caribbean Any Other Mixed Background Pakistani
Boys Girls
Source: National Pupil Database Note: Excludes pupils from the Gypsy/Roma, Travellers of Irish Origin, Black Caribbean, Black Other, Mixed White and Black African and Other Asian ethnic groups
Chart 3: Boys Average Score at KS4 as Proportion of Girls Average Score, 2005
0.0% 20.0% 40.0% 60.0% 80.0% 100.0% 120.0% Pakistani
Any Other Mixed Background White and Black Caribbean Bangladeshi Any other white background White - British White and Asian Chinese or Chinese British Any Other Ethnic Group Black African Indian
9
1.1.2 GCSE Attainment
Chinese, Indian and White/Asian pupils also have the highest proportions achieving 5+A*-C GCSEs, Black African pupils have the lowest. Black African pupils also have the lowest proportion attaining at least 1 A*-G GCSE.
A second measure of performance relates to GCSE attainment.
Chart 4: Pupils achieving 5+A*-C GCSEs by ethnicity, 2005 (per cent)
0.0% 10.0% 20.0% 30.0% 40.0% 50.0% 60.0% 70.0% 80.0% 90.0% 100.0% Black African
Pakistani White and Black Caribbean Bangladeshi Any Other Ethnic Group Any Other Mixed Background White - British Any other white background Indian White and Asian Chinese or Chinese British
Chart 5: Pupils achieving 1+ A*-G GCSE by ethnicity, 2005 (per cent)
0.0% 10.0% 20.0% 30.0% 40.0% 50.0% 60.0% 70.0% 80.0% 90.0% 100.0% Black African
Any Other Ethnic Group White and Black Caribbean Any Other Asian Background Chinese or Chinese British White - British Any Other Mixed Background Any other white background Indian Bangladeshi White and Asian Pakistani
Source: National Pupil Database
Note: Excludes pupils from Gypsy/Roma, Travellers of Irish Origin, Black Caribbean, Black Other and Mixed White/Black African ethnic groups
Owing to the small number of pupils in the Other Asian and Mixed White/Black African groups, these were excluded from the analysis of pupils attaining 5+A*-C GCSEs. The greater numbers attaining 1+A*-G GCSE meant that the Other Asian group was large enough to be included in this analysis.
• The three ethnic groups who attained the highest average scores also achieved the best results in terms of the proportion of their pupils attaining 5+A*-C GCSEs. 73 per cent of Chinese, 67 per cent of White/Asian and 60 per cent of Indian pupils attained this level. This compared to the overall average of 51 per cent. The two ethnic groups with the lowest average scores also had the lowest proportion of pupils achieving 5+A*-C GCSEs. Only 30 per cent of the Black African ethnic group attained this, while 41 per cent of White/Black Caribbean attained this level, the same percentage as pupils from the Pakistani group.
• In the overall population, the gap between the proportions of girls and boys achieving 5+A*-C GCSEs was 11 percentage points (57 per cent for girls, 46 per cent for boys).
• By looking at the proportion of pupils attaining at least 1 GCSE at grade A*-G, we can identify pupils achieving some form of worthwhile qualification. A gender analysis was possible, but in general the proportion of boys and girls attaining at least a Category 3 qualification was similar within each ethnic group. The exception was the Mixed White/Black Caribbean group, where 95 per cent of females attained at least 1 GCSE at Grade A*-G, compared to 76 per cent of boys.
11
1.1.3 Core Subject Indicator
Black African, Mixed White/Black Caribbean and Bangladeshi pupils have the lowest proportions of pupils who attain the Core Subject Indicator, whilst Chinese pupils have the highest.
Core Subject Indicator (CSI) is a third measure of performance. It is an indicator of pupils’ performance against the core subjects of Maths, Science, English and Welsh. Pupils achieve CSI if they obtain grades A*-C in both Maths and Science and English or Welsh (first language).
Chart 6: Pupils achieving Core Subject Indicator (per cent)
0.0% 10.0% 20.0% 30.0% 40.0% 50.0% 60.0% 70.0% 80.0% 90.0% 100.0 % Black African
White and Black Caribbean Bangladeshi Pakistani Any Other Ethnic Group Any Other Mixed Background White - British Any other white background White and Asian Indian Chinese or Chinese British
Source: National Pupil Database Note: Excludes pupils from Gypsy/Roma, Travellers of Irish Origin, Other Asian and Mixed White/Black African ethnic groups
Owing to the small number of pupils in the Other Asian and Mixed White/Black African groups, these were excluded from the analysis of pupils failing to achieve the Core Subject Indicator.
• The highest proportion of pupils achieving the CSI was in the Chinese ethnic group, where 61 per cent of pupils attained this standard. In Wales as a whole, 37 per cent of pupils attained CSI. The Indian ethnic group was the only other where more than half of its pupils attained the CSI (51 per cent).
• The performance of Chinese and Indian pupils was consistent with their high ranking in the average score and attainment of 5+ A*-C GCSEs analysis.
13
1.1.4 Free School Meals
The link between school performance and eligibility for Free School Meals at the individual pupil level appears to be supported.
There are drawbacks to using eligibility for free school meals (FSMs) as a proxy measure for deprivation in pupils. Registering a qualified pupil for a free meal is the responsibility of the parent/guardian, and there may be differences in take up of the FSM option amongst ethnic groups. However, this is still the best measure of deprivation in pupils at the individual pupil level that is available. Previous studies undertaken at a school level have indicated a strong link between achievement and the level of eligibility for free school meals; as the level of FSM eligibility increases, the level of achievement decreases. In 2005, the average points score of those pupils eligible for free school meals was 24, compared to 43 for those who were not, which appears to support the earlier work.
The analysis below focuses on those pupils ineligible for free school meals. This is due to the small cohorts in each of the minority ethnic groups and the fact that the number of pupils who are ineligible for free school meals is generally greater than the number eligible. We would therefore expect an analysis of those pupils ineligible for a free school meal to be more robust.
Chart 7:Pupils not eligible for free school meals, 2005 (per cent)
0% 10% 20% 30% 40% 50% 60% 70% 80% 90% 100% Chinese or Chinese British
Indian Any other white background White and Asian White - British Any Other Mixed Background Any Other Asian Pakistani White and Black Caribbean Any Other Ethnic Group Bangladeshi Black African
Source: National Pupil Database Note: Excludes pupils from Gypsy/Roma, Travellers of Irish Origin and Mixed White/Black African ethnic groups
Owing to the small number of pupils in the Mixed White/Black African group, this group was excluded from the analysis of pupils not eligible for free school meals.
• The Black African ethnic group had the lowest proportion of pupils who were not eligible for a free school meal. 46 per cent of Black African pupils were not eligible.
the previous sections. The next lowest proportion of pupils not eligible was amongst Bangladeshi pupils (63 per cent) who themselves had been in the lowest 4 performing groups in each of the main categories except in those attaining at least 1 A*-G GCSE.
• In contrast, the highest proportions of pupils not eligible were amongst Chinese (93 per cent) and Indian (88 per cent) pupils. Chinese pupils ranked highest in each of the key
15
1.2 School Exclusions
In 2004/05, 80 per cent of permanently excluded pupils were boys. Fixed term exclusions were lowest, relative to their proportion of the school population aged 5 or over, amongst the Chinese and Asian ethnic groups and highest amongst the Black ethnic group.
Because of the small numbers involved, ethnicity figures in this section are broken down into the 6 ethnic groups of White, Mixed, Asian or Asian British, Black or Black British, Chinese and Other Ethnic group. The relatively small number of permanent exclusions and fixed term
exclusions of 6 days or more prevents meaningful analysis by ethnicity in these categories.
• There continues to be a higher rate of permanent exclusion amongst boys from primary, secondary and special schools. Of those pupils excluded, the proportion that is boys has remained at or above 80 per cent for the last 10 years.
• The number of fixed term exclusions of 5 days or less and 6 days or more have both risen every year since 1999/00. The proportion of boys excluded for 5 days or fewer has remained fairly constant over the last 5 years and was 76 per cent in 2004/05. The proportion excluded for 6 days or more has fluctuated more and was 77 per cent in 2004/05, down from the peak of 82 per cent in 2000/01 and 2001/02.
2 Post 16 Education
2.1 People Remaining in Education
A higher proportion of females remain in full-time education, particularly in the 16 to 18 year old age group. The gap between the proportion of males and females in both full-time education and training narrows with age. For the older (25 to 30) age group whilst the proportion entering full-time education or training is almost the same for males and females, females are more likely to be studying part-time.
• In 2003/04, 62 per cent of 16-18 year old females were in full time education, compared to 53 per cent of males. The gap narrowed in the older age groups. Between the ages of 19 and 24, 26 per cent of females were in full-time education, compared to 23 per cent of males and between 25 and 30, the gap had reduced further to just one percentage point.
• 25 to 30 year olds were more likely to be studying part-time and this was particularly true for females - 14 per cent compared with 9 per cent of males.
• A higher proportion of males attended government-supported training after leaving
compulsory education. For 16 to 18 year olds, 12 per cent of males compared to 7 per cent of females were enrolled in training.
• Participation in education has remained at a similar level for these age groups since 1999 and there is some evidence that the gap between males and females entering full-time education or training has increased in this period. A time series for the participation of 16 to 30 year olds in education can be accessed via the following link:
http://www.statswales.wales.gov.uk/TableViewer/tableView.aspx?ReportId=770
2.2 Welsh Domiciled Enrolments to Higher Education
The proportion of Welsh domiciled students from the minority ethnic groups enrolling at UK Higher Education Institutions was greater than the proportion within the population as a whole. The proportion was highest amongst the Asian population. The proportion of enrolments from disabled students was below the level of disability recorded in 16 to 30 year olds by the WLLFS at both undergraduate and postgraduate level, while 59 per cent of those that enrolled in 2004/05 were female.
Because of the small numbers involved, ethnicity figures in this section are broken down into the 6 ethnic groups of White, Mixed, Asian or Asian British, Black or Black British, Chinese and Other Ethnic group. Enrolment figures are derived from the Higher Education Statistics Agency (HESA).
• In 2004/05, the number of female Welsh domiciled students enrolling at UK Higher
17
• The proportion of enrolments from the ethnic minority group taken as a whole was greater than their proportion within the overall population, and was particularly high amongst the Asian group. Where ethnicity was known 4.2 per cent of enrolments for undergraduate courses and 5.6 per cent of enrolments for postgraduate courses were from minority ethnic students. Each of these figures exceeded the 3.3 per cent of the population recorded as being from the minority ethnic groups and aged 16 to 24 (the age group that would contain the majority of students) in the 2001 Census. In each case, the highest proportion was from the Asian group; 1.8 per cent of undergraduate students and 2.7 per cent of postgraduate students were Asian, both figures above the 1.4 per cent of the population aged 16 to 24 recorded as Asian in the 2001 Census. Male enrolments to all higher education courses showed a higher proportion from the ethnic minorities; 5.2 per cent compared to 3.8 per cent amongst women. Asian students made up the largest proportion of the ethnic minority group amongst males and females. 2.4 per cent of male enrolments were from Asian students compared to 1.6 per cent of female enrolments.
• The proportion of enrolments from disabled students was below the proportion of the
population classifying themselves as disabled in the WLLFS. Where it was known whether a student was disabled or not disabled, 7.5 per cent of undergraduate enrolments and 5.4 per cent of postgraduate enrolments were from disabled students. This figure compares to 11.6 per cent of the population aged 16 to 30 who classified themselves as having some form of disability combining the survey results of the WLLFS from 2001 to 2004. However, it is advised that the note on the recording of disabilities in the link in the next bullet (below) is read in conjunction with this analysis.
• Time series data for both disability and ethnicity can be accessed via the following link:
2.3 First Year Welsh Domiciled Students on Initial Teacher Training (ITT)
74 per cent of first year Welsh domiciled students on Initial Teacher Training (ITT) courses at Welsh Higher Education Institutions were female. The proportion of students from the minority ethnic groups was below the level within the country as a whole, while the proportion of students with a disability was below the proportion of 16 to 30 year olds stating that they had a disability in the WLLFS.
Because of the small numbers involved, ethnicity figures in this section are broken down into the 6 ethnic groups of White, Mixed, Asian or Asian British, Black or Black British, Chinese and Other Ethnic group. Enrolment figures are derived from the Higher Education Statistics Agency (HESA).
• In 2004/05, almost three-quarters of Welsh domiciled first year students on Initial Teacher Training (ITT) courses leading to Qualified Teacher Status in Welsh Higher Education Institutions were female. 74 per cent were female compared to 26 per cent who were male.
• Of the first year students in 2004/05 from all domiciles, 5 per cent had a disability, whilst according to survey results from the 2001 to 2004 WLLFS, 11.6 per cent of the population aged 16 to 30 reported that they had some form of current disability. However, it is advised that the note on the recording of disabilities in the bulletin “Initial Teacher Training in Wales 2004/05” is read in conjunction with this information via the link below:
http://new.wales.gov.uk/docrepos/40382/40382313/403824/post16/post16-2006/sb17-2006.pdf?lang=en.
19
2.4 Modern Apprenticeships
The proportion of females on modern apprenticeships rose sharply with age. The proportion from the ethnic minority population was below the level in the country as a whole and the
proportion recorded as having a disability was below that reported in the wider population in the 2004 WLLFS.
The figures below are from the National Trainee Database, covering the academic year 2003/04.
• In total, 53 per cent of trainees on modern apprenticeships in 2003/04 were male and 47 per cent female. However, the proportion of those that were female increased considerably with age. Of those on a modern apprenticeship who were under 19 years of age, only 25 per cent were female. Between the ages of 19 and 24, the proportions were about equal and between 25 and 49, the figure rose to 65 per cent who were female.
• Of the trainees on modern apprenticeships, 1.3 per cent were from the ethnic minorities. This compares to 2.1 per cent of the total resident population as a whole. The ethnic minorities represented a similar proportion amongst both male and female apprentices.
• The proportion of people on modern apprenticeships with a disability was less than the proportion recorded by the WLLFS between 2001 and 2004, although the nature of the work involved may have been a contributory factor. Just over one per cent of trainees stated they had a disability, whilst according to the WLLFS, 11.6 per cent of those aged 16 to 30 and 22.7 per cent of the working age population as a whole stated that they had a current disability.
2.5 Learners Enrolled at Further Education Institutions
In 2003/04, the proportion of males at Further Education Institutions fell with increasing age. This applied to full and part time learners and those undertaking Work Based Learning (WBL). The proportion of learners stating they had a disability was less than that recorded in the 2004 WLLFS, but the proportion from the ethnic minority population was above the proportion in the population as a whole.
Because of the small numbers involved, ethnicity figures in this section are broken down into the 5 ethnic groups of White, Mixed, Asian, Black and Other Ethnic group. The figures below are from the Lifelong Learning Wales Record (LLWR) database, covering the academic year 2003/04.
• In 2003/04, females accounted for the greater proportion of learners enrolled in Further Education Institutions (FEIs). This was particularly pronounced amongst part-time learners, where 60 per cent were female, but was not reflected across all age groups. In fact, a higher proportion of part-time learners aged under 20 were male (52 per cent), but in the over 24 age group, this proportion fell to 38 per cent. A similar pattern was evident amongst full time learners, where an equal proportion of males and females under 20 were enrolled, but just 31 per cent of learners over 24 were male. Overall, there was a higher proportion of males enrolled on Work Based Learning (WBL), where 65 per cent of learners were male.
• 6.9 per cent of learners had some form of disability, according to their own assessment. The proportion increased slightly with age; whilst 5 per cent aged 18 and under had a disability, this proportion rose slightly to 7.4 per cent of those aged 19 and over. This rise in proportion was reflected across males and females, though there was a higher likelihood of male learners being disabled, rising to 8.6 per cent of those aged 19 and over. This figure
remained below the estimates of the disabled population as a whole (see previous sections).
21
3 Highest
Qualifications
The “Other Ethnic” group had the highest proportion of its population achieving higher level qualifications. There was an age differential in the relative achievements of males and females; in the population aged 25 or over, a higher proportion of men held 2 A levels or better, whilst this situation was reversed in those aged under 25.
There is a recognised discrepancy between data on highest qualification level held between the Welsh Local Labour Force Survey (WLLFS) and the 2001 Census, owing to the way data is collected and questions asked. The WLLFS is the best source of data for timely analysis, but it is supplemented in this case by Census data as the latter allows a more detailed ethnic
breakdown. Analysis by ethnicity must also take into account the existence in both Census and surveys of overseas e.g. Black African students; the analysis is unable to distinguish between people who are Welsh domiciled and well qualified overseas students temporarily resident in Wales.
• The 2001 Census, which enables a detailed breakdown of ethnicity, identifies the “Other Ethnic” group as having the highest proportion of its population aged between 16 and 59 achieving a higher level qualification (i.e. degree or equivalent). 51 per cent of this group had achieved a higher level qualification. This group was followed by the Indian (50 per cent), “Other Asian” (i.e. those Asians not classifying themselves as Indian, Pakistani or
Bangladeshi) (44 per cent) and Black African (38 per cent) groups. There were considerable variations within certain groups. The proportion attaining a higher level qualification amongst the White Other group was double that of the White British group, whilst only 11 per cent of the Bangladeshi population had attained a higher level qualification compared to 50 per cent of the Indian population. The proportion of the Mixed White/Asian population achieving a higher level qualification was twice that of the Mixed White/Black Caribbean population. Within the Black group, the proportion of the Black African population attaining this level was 50 per cent higher than the proportion of the Black Caribbean population.
• According to the 2004 WLLFS, a higher proportion of females than males under the age of 25 had obtained a degree or equivalent qualification or higher. Whilst the proportion of those aged between 18 and 60 holding at least a degree level qualification was similar for males and females at around one in four, the main differential occurred in this younger age band. 20 per cent of females, but only 16 per cent of males held a degree level qualification or higher. The proportion of females holding an equivalent to 2+ A-Levels as their highest qualification was also slightly higher in this age band, where 54 per cent of females and 49 per cent of males had achieved this level. In the older age categories of 25 to 34, 35 to 49 and 50 to 59 however, the proportion of men reaching this level was higher, the biggest gap of 16 percentage points being between those aged 50 and over. 10 per cent of both males and females aged 18-24 reported holding no qualifications, but overall, females were more likely to have no qualifications than males.
• The overall proportion of the population holding no qualifications has fallen for both males and females since 2001 and was 17 per cent of working age adults in 2004. However the gap between males and females has reduced from 3.5 percentage points in 2001 to 1.9 in 2005. Similarly the proportion holding a qualification equivalent to 2 A levels has increased over the same period for both males and females but the gap has narrowed.
level or above. In 2004 the figures were 26.3 per cent for females and 24.8 for males). The full time series for qualification levels can be accessed via
23
4 Key Quality Information on Analysis
The analysis in the preceding section must be read in conjunction with the Key Quality Information section contained in the Statistical Bulletin “Academic Achievement and Ethnic Background, 2005” published in December 2006. The information in that publication applies equally to this article. Additional quality information is included in the following sub-sections.
4.1.1 Gypsy/Roma, Travellers of Irish Heritage and Black Caribbean and Black Other Groups
Pupils from Gypsy/Roma, Travellers of Irish Origin, Black Caribbean and Black Other groups, were omitted from all analysis by ethnic group owing to the extremely small number of pupils in each group (see Table 1). More robust analysis of the performance of these groups will not be possible until data has been collected over a number of years.
4.1.2 Other Pupils
Pupil numbers are very small in all groups outside of the White ethnic groups. 95.3 per cent of pupils for whom ethnicity was recorded are of White British ethnicity. The highest number in any single non-White group is the 132 pupils of Any Other Mixed Background.
However, all other groups are included in the analysis of average scores, though pupil numbers are below 50 in 2 groups (Any Other Asian and Mixed/White Black African). The basis for
including an ethnic group in analysis was that there were at least 30 pupils in the cohort being analysed (either the entire ethnic group or in the case of analysis by ethnicity and gender, at least 30 males and 30 females). In the case of the Any Other Asian and Mixed White/Black African groups, this meant that they were excluded from all analysis split by gender, in the analysis of pupils attaining 5+ A*-C GCSEs and in the analysis of attainment of the Core
Subject Indicator. The Mixed White/Black African group was also excluded from the analysis of eligibility for free school meals and the analysis of pupils achieving at least 1 A*-G GCSE. Although the cohort was greater than 30, the relatively small number of pupils meeting the criteria in question meant that analysis of these criteria was not carried out.
Ethnicity data was not obtained for 736 pupils and refused in 463 cases. Therefore analysis of a single year even for any pupils from a minority ethnic group must be treated with great caution.
5 Sources
This section includes a list of sources referenced in the main body of the text and some additional useful sources of information.
School Level Education
“Schools in Wales: Examination Performance 2005”
(http://www.wales.gov.uk/topics/statistics/publications/swep2005/?lang=en)
“Exclusions from Schools, 2004/05”
http://new.wales.gov.uk/topics/statistics/headlines/schools-2006/hdw20060321/?lang=en
Post 16 Education
Participation of 16 to 30 year olds in education:
http://www.statswales.wales.gov.uk/TableViewer/tableView.aspx?ReportId=770
Time series data for disability and ethnicity figures for Welsh domiciled enrolments to higher education:
http://www.statswales.wales.gov.uk/TableViewer/tableView.aspx?ReportId=2394
“Initial Teacher Training in Wales 2004/05”
http://new.wales.gov.uk/docrepos/40382/40382313/403824/post16/post16-2006/sb17-2006.pdf?lang=en
Highest Qualifications
Time series for qualification levels:
http://www.statswales.wales.gov.uk/TableViewer/tableView.aspx?ReportId=1704
Other Useful Sources:
“Statistical Focus on Disability and Long-term Illness in Wales”
http://new.wales.gov.uk/topics/statistics/publications/focus-disability2003/?lang=en
“Statistical Focus on Diversity in Wales”
http://new.wales.gov.uk/docrepos/40382/40382313/403824/comp-2005/focus-diversity2005-e.pdf?lang=en
“Statistical Focus on Ethnicity in Wales”
http://new.wales.gov.uk/docrepos/40382/40382313/403824/compendia/comp-2004/sb53-2004.pdf?lang=en
“Focus on Ethnicity and Religion” (Office for National Statistics)
25
Notes on the use of statistical articles:
Statistical articles generally relate to one-off analyses for which there are no updates planned, at least in the short-term, and serve to make such analyses available to a wider audience than might otherwise be the case. They are mainly used to publish analyses that are exploratory in some way, for example:
• Introducing a new experimental series of data;
• A partial analysis of an issue which provides a useful starting point for further research but that nevertheless is a useful analysis in its own right;
• Drawing attention to research undertaken by other organisations, either commissioned by the Welsh Assembly Government or otherwise, where it is useful to highlight the
conclusions, or to build further upon the research;
• An analysis where the results may not be of as high quality as those in our routine statistical releases and bulletins, but where meaningful conclusions can still be drawn from the results.
Where quality is an issue, this may arise in one or more of the following ways:
• being unable to accurately specify the timeframe used (as can be the case when using an administrative source);
• the quality of the data source or data used; or • other specified reasons.
However, the level of quality will be such that it does not significantly impact upon the
conclusions. For example, the exact timeframe may not be central to the conclusions that can be drawn, or it is the order of magnitude of the results, rather than the exact results, that are of interest to the audience.
The analysis presented does not constitute a National Statistic, but may be based on National Statistics outputs and will nevertheless have been subject to careful consideration and detailed checking before publication. An assessment of the strengths and weaknesses in the analysis will be included in the article, for example comparisons with other sources, along with guidance on how the analysis might be used, and a description of the methodology applied.
Articles are subject to the release practices as defined by the release practices protocol, and so, for example, are published on a pre-announced date in the same way as other statistical
outputs.
Missing value symbols used in the article follow the standards used in other statistical outputs, as outlined below.
.. The data item is not available
. The data item is not applicable
- The data item is not exactly zero, but estimated as zero or less than half the final digit shown