Extended Schools:
Establishing a Baseline
Methodology to Estimate the
Impact of the Extended School
Programme on Attainment
Research Report DCSF-RR069
Extended Schools:
Establishing a Baseline Methodology to
Estimate the Impact of the Extended
School Programme on Attainment
Gavan Conlon
London Economics
The views expressed in this report are the authors’ and do not necessarily reflect those of the Department for Children, Schools and Families.
© London Economics 2009 ISBN 978 1 84775 329 8
Contents
Pagei
Executive Summary
v
1
Background and introduction
13
1.1 Terms of reference 13
1.2 Description of the Extended Schools programme 15
2
Methodological approach
20
2.1 Data sources 20
2.2 Propensity score matching 22
2.3 Difference in differences 34
2.4 Econometric Analysis 36
3
Validation of the methodological approach
39
3.1 School level results 39
3.2 Pupil Level Results 46
4
Interpretation of the findings from methodological approach 53
5
Conclusions
56
Annex 1 School Level Results Key Stages 1-4
59
Tables & Figures
Pageii
Table 1: Analysis of Extended Schools service provision 19 Table 2: Illustration of Key Stages, Levels within Key Stages and
Assessment within the National Curriculum 21 Table 3: Usage of 'inclusion in other school improvement
programme(s)’ in propensity score matching 27 Table 4: Baseline characteristics of treatment and control schools –
primary level 31
Table 5: Baseline characteristics of treatment and control schools –
secondary level 32
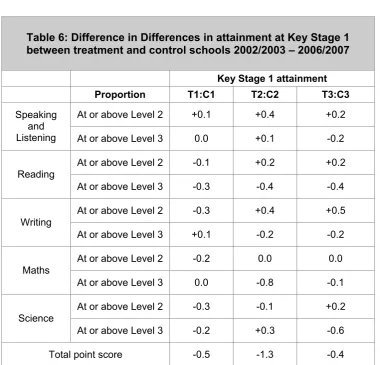
Table 6: Difference in Differences in attainment at Key Stage 1 between
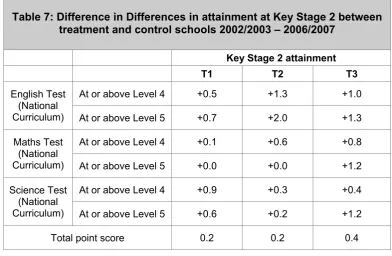
treatment and control schools 2002/2003 – 2006/2007 41 Table 7: Difference in Differences in attainment at Key Stage 2 between
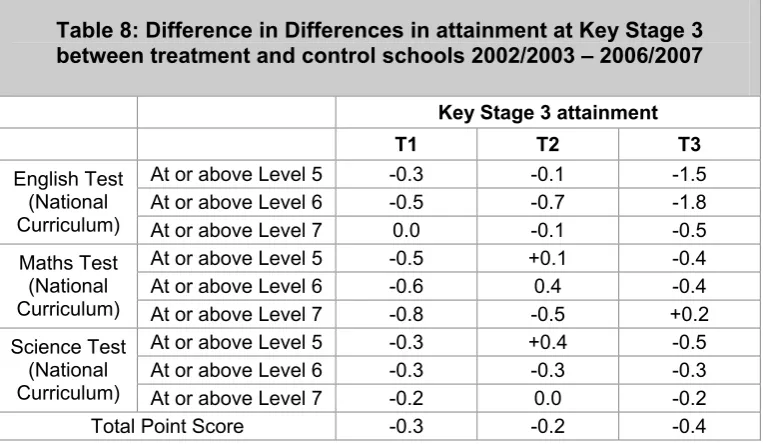
treatment and control schools 2002/2003 – 2006/2007 42 Table 8: Difference in Differences in attainment at Key Stage 3 between
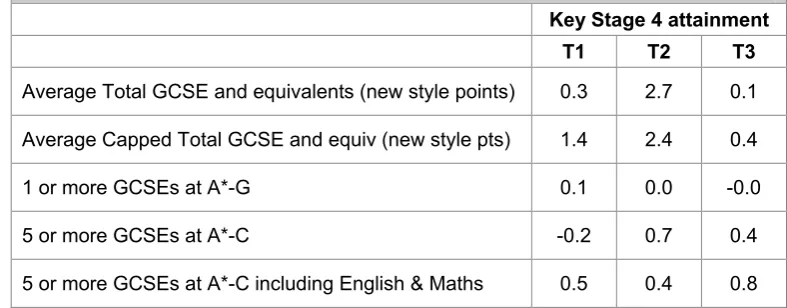
treatment and control schools 2002/2003 – 2006/2007 43 Table 9: Difference in Differences in attainment at Key Stage 4 between
treatment and control schools 2002/2003 – 2006/2007 44 Table 10: Relationship between the Extended Schools programme and
pupil attainment (controls for historical school attainment) 48 Table 11: Relationship between the Extended Schools programme and
pupil attainment (controls for school intake) 49 Table 12: Relationship between the Extended Schools programme and
pupil attainment at KS1 – All schools ever part of ES 60 Table 13: Relationship between the Extended Schools programme and
pupil attainment at KS1 – All schools becoming ES in 2006 62 Table 14: Relationship between the Extended Schools programme and
pupil attainment at KS1 – All schools becoming ES in 2007 64 Table 15: Relationship between the Extended Schools programme and
pupil attainment at KS2 – All schools ever part of ES 66 Table 16: Relationship between the Extended Schools programme and
pupil attainment at KS1 – All schools becoming ES in 2006 67 Table 17: Relationship between the Extended Schools programme and
pupil attainment at KS1 – All schools becoming ES in 2007 68 Table 18: Relationship between the Extended Schools programme and
pupil attainment at KS3 – All schools ever part of ES 69 Table 19: Relationship between the Extended Schools programme and
pupil attainment at KS1 – All schools becoming ES in 2006 70 Table 20: Relationship between the Extended Schools programme and
pupil attainment at KS1 – All schools becoming ES in 2007 71 Table 21: Relationship between the Extended Schools programme and
Tables & Figures
Pageiii
Table 22: Relationship between the Extended Schools programme and
pupil attainment at KS1 – All schools becoming ES in 2006 73 Table 23: Relationship between the Extended Schools programme and
pupil attainment at KS1 – All schools becoming ES in 2007 74
Glossary
iv
Glossary
Terminology abbreviations
DCSF Department for Children, Schools and Families
ES Extended School
KS Key Stage
NPD National Pupil Database
LEASIS Local Education Authority School Information System
QLFS Quarterly Labour Force Survey
IMD Index of Multiple Deprivation
PSM Propensity Score Matching
BME Black and Minority Ethnic origin
FSM Free School Meals
SEN Special Educational Needs
EAL English as an additional language
SEA Swift and Easy Access
Executive Summary - Research Brief
v
Executive Summary - Research Brief
Background and terms of reference
London Economics were commissioned by the Department for Children, Schools and Families to establish a robust methodological approach for the ongoing monitoring and evaluation of the Extended Schools programme. This report details the approach adopted and provides an indication of the
potential findings that might be generated in the future using this
methodology; however, given the time scale of the programme, the report does not provide any evidence at this stage on the impact of the Extended Schools programme.
Extended Schools work with Local Authorities, local providers and other schools to deliver the five child centred outcomes that emerged as part of the Every Child Matters (ECM) agenda. Extended Schools provide access to a core offer of integrated services through partnership working, including the following:
• formal, ‘wraparound’ childcare in primary and special schools; • study support and homework clubs, sport, music, arts and special
interest clubs;
• swift and easy access to targeted and specialist services (for example, speech and language therapy, behaviour support);
• parenting and family support, including family learning; and
• community access to school facilities such as sports grounds, ICT and adult and family learning.
The number of Extended Schools has grown steadily since their introduction in 2006. In September 2006 there were 3,277 Extended Schools (117 Nursery, 2,328 Primary, 734 Secondary and 98 Special Schools), which had increased to 8,105 by September 2007 (238 Nursery, 5,991 Primary, 1,633 Secondary and 243 Special Schools). At the time of starting this research project (March 2008), the total number of Extended Schools had increased further to 10,043 (272 Nursery, 7,542 Primary, 1,912 Secondary and 317 Special Schools).
Executive Summary - Research Brief
vi
Aims and Objectives the research
The objectives of this project were to analyse routinely available attainment and administrative data held by Department for Children, Schools and Families and the Training and Development Agency for Schools (TDA), in order to develop a baseline approach for the ongoing analysis and monitoring of the early implementation of Extended Schools and allow for the detection of emerging outcomes as they may arise. Rather than identifying the current impact of Extended Schools on pupil outcomes, we have set out an analysis to provide the research building blocks to allow the Department to undertake a consistent and methodologically sound analysis in the future, as the programme embeds over time.
The analysis comprises the following elements:
• School level analysis: to assess the extent to which Extended Schools’ services are associated with variations in attainment.
• Pupil level analysis to assess the extent to which pupils attending an Extended School are associated with variations in attainment.
The key aims of the research were to establish a baseline methodology to understand whether attainment varies by Extended School status, where ‘Extended School status’ covers:
• The length of time providing full core offer.
• The extent of variation in outcomes by Extended School for different school and pupil characteristics, especially for the most disadvantaged where relevant sub-groups for analysis include:
• Extended Schools status; • School type
• School intake characteristics
o proportion of pupils eligible for Free School Meals (FSM) o English as an additional language (EAL)
o Special Educational Needs (SEN)
o Black or Minority Ethnic Group (BME) and o Historical attainment;
• Area disadvantage
o Index of Multiple Deprivation (IMD)
• Pupil characteristics
o proportion of pupils eligible for Free School Meals (FSM) o English as an additional language (EAL)
Executive Summary - Research Brief
vii
The analysis was also intended to address the following questions if the data permitted:
• What is the comparison between Extended Schools and non-Extended Schools that were otherwise similar before the non-Extended School programme began?
• How have these relationships changed over time (since 2004-05)?
Caveats
The Extended Schools programme has been in operation for a very limited period of time and as has been said, it was not necessarily expected that the programme would have had any meaningful impact on educational attainment at this stage. Specifically, the data used for developing the ongoing
monitoring and evaluation of the programme covers a five year period for which the Extended Schools programme has been in operation for just over one year in some schools – and for a significantly shorter period in many other schools.
Quite apart from the fact that the programme has not been in operation for very long in most schools, there are a number of other reasons for us to be cautious about any findings presented for the following reasons:
• The services that Extended Schools offer are voluntary and currently there is no centrally held information on which children and parents avail of these services. If there is any effect on particular pupils or groups of pupils, identifying these effects might be difficult. For instance, any individual pupil effect that does exist might be ‘diluted’ when looking at the change in attainment of all pupils in a particular cohort. Conversely, even if information were collected on which pupils and parents availed of the services on offer, the possibility of positive externalities1 might result in underestimating the real impact of the
Extended Schools programme.
• Schools that are providing access to the core offer of extended services can be fundamentally different from each other in respect of delivery ‘on the ground’. For instance, some Extended Schools may have been offering the types of services associated with the Extended Schools programme for a number of years before the formal
introduction of the programme, and thus formal status as an Extended School may appear to result in a limited impact on pupils attending those schools.
• In addition, despite the general aim of the policy to provide additional services to the entire community of pupils and parents, the focus and
Executive Summary - Research Brief
viii
delivery of Extended Schools’ services can vary significantly between schools. Some Extended Schools may focus on particular year groups while other Extended Schools might concentrate on pupils with
specific characteristics (such as pupils that are eligible for Free School Meals). Such variation in the way in which the policy is delivered on the ground is likely to limit the ability of researchers to identify any consistent effect of Extended Schools on pupil outcomes in the future unless additional data is collected relating to the delivery of the programme.
Given these considerations, rather than identifying the current impact of Extended Schools on pupil outcomes, we have set out an analysis to provide the research building blocks to allow the Department to undertake a
consistent and methodologically sound analysis in the future, as the programme embeds over time.
Methodological Approach
The approach to the econometric modelling of the potential educational (and other) impacts of Extended Schools is based on a two stage analysis.
The first stage of the analysis involved the classification of the Extended Schools studied according to whether and when they became an Extended School for the first time. This classification of Extended Schools resulted in the construction of three treatment groups. For each of these treatment groups, a sample of comparison schools was then selected from schools that never became an Extended School based on a range of school level
characteristics (such as school roll, the proportion of pupils eligible for Free School Meals and prior attainment) and local area level characteristics (such as domain measures from the Index of Multiple Deprivation).
This matching process was undertaken using data from a period well in advance of the first implementation of the Extended Schools programme. The matching was carried out through a propensity score matching (PSM) model. The main report illustrates the robustness of the matching technique and the appropriateness of the comparison schools for further analysis. Specifically, the average attainment scores between the treatment and control schools were extremely close – both in terms of the attainment scores used for matching (Key Stage 1 at primary level and Key Stage 3 measures at secondary level), as well as the outcome scores associated with treatment and control schools (Key Stage 2 and Key Stage 4). This comparison and consistency of both the matching variables and outcome measures across treatment and control schools provides a strong indication of the
appropriateness of the methodological approach.
Executive Summary - Research Brief
ix
In the case of the school level analysis, the main report provides an indication of whether the growth rate in attainment across the various Key Stages (using 19 indicators) is greater in the treatment schools relative to the control
schools. In general, the difference in the growth rate of attainment between treatment and control schools is statistically insignificant. Given that we would not expect to see any impact in this time-period, this provides us with
additional evidence of the appropriateness of the methodological approach. Had we seen a large positive impact from the programme in such ashort period of time, we might have been concerned that the results were being driven by an unsound methodology that was in fact capturing selection effects2.
At pupil level, we undertook econometric modelling3 using a large number of model specifications to understand whether pupils (and subgroups of pupils) in the Extended Schools studied posted different outcomes compared to similar pupils in the relevant control schools. In undertaking this analysis, we controlled for a wide range of school level and pupil level characteristics to ensure that (going forward) any outcome associated with the Extended Schools programme might be properly identified.
Finding I – school characteristics
The first point to note is that the Extended Schools studied operate in significantly more challenging circumstances than ‘typical’ primary or secondary schools nationally. The extent of the relative disadvantage faced by Extended Schools in terms of local area characteristics and pupil
characteristics is exacerbated in those schools that became an Extended School for the first time in 2006 (compared to 2007).
In particular, pupils in schools that became an Extended School for the first time in 2006 had an average point score that was 1.5 points lower in Key Stage 1 speaking and listening, 1.2 points lower in Key Stage 1 reading, 1.3 points lower in Key Stage 1 writing, 1.1 points lower in Key Stage 1 maths and 1.3 points lower in Key Stage 1 Science compared to the national average. Schools that became an Extended School for the first time in 2006 had an average point score across all Key Stages that was significantly lower than in schools that became an Extended School for the first time in 2007. This finding is entirely unsurprising given the fact that the Extended Schools
2 If the analysis demonstrates a significant difference in attainment between the Extended Schools studied and their comparator schools, this might imply that there are fundamental differences between Extended Schools and the comparator schools that have not been controlled for in the analysis. In other words, there may be some factors that determine the selection of schools into the Extended Schools programme that are also associated with different rates of educational attainment. If this is the case, and the analysis does not control these for these other factors, differences in attainment might be wrongly attributed to the Extended Schools programme rather than some other factor determining selection in the programme in the first instance.
Executive Summary - Research Brief
x
programme was focused in schools operating in areas suffering from the highest levels of socioeconomic deprivation.
At secondary level, a similar picture emerges. In relation to schools that became an Extended School for the first time in 2006, pupils in those schools registered a 0.9 point lower score in Key Stage 3 English, a 1.1 lower point score in Key Stage 3 maths and a 1.0 point lower score in Key Stage 3 science compared to secondary schools nationally.
In addition to the differences in pupil attainment, other important differences from the analysis of baseline characteristics emerge. The Extended Schools studied have a significantly higher proportion of children eligible for free school meals (18.1% compared to 15.3% nationally at primary level and 16.2% compared to 14.6% at secondary level); a higher proportion of children from BME backgrounds (14.2% compared to 12.7% nationally at primary level and 13.9% compared to 13.0% nationally at secondary level); and a higher proportion of pupils with Special Educational Needs (18.2% compared to 17.5% nationally at primary level and 17.5% compared to 16.4% nationally at secondary level).
This highlights the importance of undertaking a proper matching exercise to ensure the appropriate comparison of schools with similar observable characteristics to Extended Schools.
Finding II – school level outcomes
Taking full account of the various caveats associated with the analysis, and in particular the fact that we compare the change in attainment in treatment and control schools between 2002/03 and 2006/07 (despite the Extended Schools programme being introduced for the first time in 2006), there appears to be a very small positive association between school level attainment and the Extended Schools programme at Key Stage 2 and Key Stage 4 (with little or no statistically significant difference at Key Stage 1 or Key Stage 3). We also found that there appears to be a marginally stronger relationship between school level attainment and the programme for those schools that became an Extended School for the first time earlier in the life of the programme.
Finding III – pupil level outcomes
Executive Summary - Research Brief
xi
at Key Stage 4 in terms of average uncapped total points score depending on the model specification.
There are also some differences in the growth rate of attainment depending on the characteristics of pupils. The results presented in the previous section indicated that attainment differences occurred in Science at Key Stage 2 and it appears that the relative out-performance was concentrated amongst non-BME pupils. In particular, whereas the entire cohort of pupils outperformed pupils in the relevant control group by 0.038 points in Science at Key Stage 2, pupils from non-BME backgrounds at the Extended Schools studied are associated with a 0.13 point relative out-performance. Also at Key Stage 2, pupils eligible for Free School Meals are associated with a gain of 0.13 points in English compared to no statistically significant relationship across the cohort as a whole.
However, at Key Stage 3, these outcomes were reversed to some extent. For the cohort of pupils as a whole, the findings indicated that the programme was associated with an out-performance in relation to maths point score (between +0.04 and 0.09); however, there appeared to be relative underperformance for pupils eligible for Free School Meals (those pupils achieved a 0.13 to 0.15 point worse outcome compared to pupils eligible for Free School Meals in control schools).
The results at Key Stage 4 are also ambiguous. The results indicate that pupils in the Extended Schools studied are associated with worse outcomes than pupils in control schools in terms of uncapped total points scores (by between 1.6 and 1.9 points). However, there are differences depending on the personal characteristics of pupils.
For pupils eligible for Free School Meals in the Extended Schools studied, there is no statistically significant effect associated with the programme; however, when considering FSM eligible pupils in schools that first became an Extended School in 2006, there is a statistically significant negative association between attainment and the Extended School programme (-5.2 points).
The associations also vary for pupils from BME backgrounds at Key Stage 4. In particular, although pupils from BME backgrounds under-perform BME pupils in the relevant control groups in terms of uncapped total point score (by 3.5 points), BME pupils in the Extended Schools studied are associated with a 9.2% increased likelihood of attaining 5 or more GCSEs at grades A*-C (excluding maths and English) and between 7.8% and 7.9% increased likelihood to attain 5 or more GCSEs at grades A*-C including maths and English.
Finding IV – timing of intervention
Executive Summary - Research Brief
xii
In relation to the analysis at school level at Key Stage 1, there is some degree of uncertainty as to whether there is any difference in attainment between those schools becoming an Extended School for the first time in 2006 (compared to 2007). The positive association between attainment at Key Stage 1 and the Extended Schools programme is concentrated in the
proportion of pupils (relative to their respective control groups) achieving at or above Level 2 and Level 3 in speaking and listening and achieving at or above Level 3 in science. The negative association between attainment at Key Stage 1 and the Extended Schools programme is concentrated in the proportion of pupils (relative to their respective control groups) achieving at or above Level 3 in maths and achieving at or above Level 2 in science. Given these results, we would not infer any difference in Key Stage 1 attainment at this stage.
It is difficult to isolate a consistent impact of the timing of the Extended
Schools programme on school level attainment at Key Stages 2 or Key Stage 3 at this stage, although our methodology clearly illustrates how this may be carried out in the future.
There appears to be a greater association between attainment and the timing of the introduction of the Extended Schools programme at Key Stage 4 for particular subgroups of pupils. For example, although in 2007 there is no relationship between attainment (in terms of average uncapped total point score at Key Stage 4) and the Extended Schools programme for BME pupils (compared to BME pupils in control groups), for BME pupils in schools that were part of the Extended Schools programme since 2006, the relative out-performance in terms of average uncapped total point score was +3.127 points (compared to BME pupils in control groups).
The objective of this work was to give an exemplar analysis to illustrate how the Extended Schools programme might be evaluated on an ongoing basis in the future. Future research needs to continue to take full account of the length of time for which the policy has been in operation and the delivery
Section 1 Background and introduction
13
1 Background and introduction
1.1 Terms of reference
London Economics were commissioned to undertake an evaluation of the Extended Schools programme by the Department for Children, Schools and Families (DCSF) in March 2008.
The objectives of this project were to analyse routinely available attainment and administrative data held by Department for Children, Schools and Families and the Training and Development Agency for Schools (TDA), in order to develop a baseline approach for the ongoing analysis and monitoring of the early implementation of Extended Schools and allow for the detection of emerging outcomes as they may arise.
The analysis comprises the following elements:
• School level analysis: to assess the extent to which Extended Schools’ services are associated with variations in attainment.
• Pupil level analysis to assess the extent to which pupils attending an Extended School are associated with variations in attainment.
The key aims of the research were to establish a baseline methodology to understand whether attainment varies by Extended School status, where ‘Extended School status’ covers:
• The length of time providing full core offer.
• The extent of variation in outcomes by Extended School for different school and pupil characteristics, especially for the most disadvantaged where relevant sub-groups for analysis include:
• Extended Schools status; • School type
• School intake characteristics
o proportion of pupils eligible for Free School Meals (FSM) o English as an additional language (EAL)
o Special Educational Needs (SEN)
o Black or Minority Ethnic Group (BME) and o Historical attainment;
• Area disadvantage
o Index of Multiple Deprivation (IMD)
• Pupil characteristics
Section 1 Background and introduction
14
o Special Educational Needs (SEN) or o Black or Minority Ethnic Group (BME);
The analysis was also intended to address the following questions if the data permitted:
• What is the comparison between Extended Schools and non-Extended Schools that were otherwise similar before the non-Extended School programme began?
• How have these relationships changed over time (since 2004-05)?
The Extended Schools programme has been in operation for a very limited period of time and as has been said, it was not necessarily expected that the programme would have had any meaningful impact on educational attainment at this stage. Specifically, the data used for developing the ongoing
monitoring and evaluation of the programme covers a five year period, of which the Extended Schools programme has been in operation for just over one year in some schools – and for a significantly shorter period in many other schools.
Quite apart from the fact that the programme has not been in operation for very long in most schools, there are a number of other reasons for us to be cautious about any findings presented for the following reasons:
• The services that Extended Schools offer are voluntary and currently there is no centrally held information on which children and parents avail of these services. If there is any effect on particular pupils or groups of pupils, identifying these effects might be difficult. For instance, any individual pupil effect that does exist might be ‘diluted’ when looking at the change in attainment of all pupils in a particular cohort. Conversely, even if information were collected on which pupils and parents availed of the services on offer, the possibility of positive externalities4 might result in underestimating the real impact of the
Extended Schools programme.
• Schools that are providing access to the core offer of extended services can be fundamentally different from each other in respect of delivery ‘on the ground’. For instance, some Extended Schools may have been offering the types of services associated with the Extended Schools programme for a number of years before the formal
introduction of the programme, and thus formal status as an Extended School may appear to result in a limited impact on pupils attending those schools,
• In addition, despite the general aim of the policy to provide additional services to the entire community of pupils and parents, the focus and
Section 1 Background and introduction
15
delivery of Extended Schools’ services can vary significantly between schools. Some Extended Schools may focus on particular year groups while other Extended Schools might concentrate on pupils with
specific characteristics (such as pupils that are eligible for Free School Meals). Such variation in the way in which the policy is delivered on the ground is likely to limit the ability of researchers to identify any consistent effect of Extended Schools on pupil outcomes in the future unless additional data is collected relating to the delivery of the programme.
Given these considerations, rather than identifying the current impact of Extended Schools on pupil outcomes, we have set out an analysis to provide the research building blocks to allow the Department to undertake a
consistent and methodologically sound analysis in the future, as the programme embeds over time.
1.2 Description of the Extended Schools
programme
Extended Schools work with Local Authorities, local providers and other schools to deliver the five child centred outcomes that emerged as part of the Every Child Matters (ECM) agenda. Extended Schools provide access to a core offer5 of integrated services that include a menu of activities (though not
necessarily by teachers or on the school site), including the following: • formal, ‘wraparound’ childcare in primary and special schools; • study support and homework clubs, sport, music, arts and special
interest clubs;
• swift and easy access to targeted and specialist services (for example, speech and language therapy, behaviour support);
• parenting and family support, including family learning; and
• community access to school facilities such as sports grounds, ICT and adult and family learning.
The Government’s ambition is for all schools to offer access to a core set of extended activities by 2010.
Childcare provision
The core offer requires all primary and special schools to offer access to high-quality, Ofsted-registered childcare from 8am to 6pm (depending on demand), five days a week, 48 weeks a year. Secondary schools do not have to offer
Section 1 Background and introduction
16
formal childcare, although some choose to do so to support families or enable parents to use other extended services.
Varied menu of activities
Both primary and secondary schools should provide access to a varied menu of extra-curricular activities from 8am to 6pm during term time plus flexible holiday provision (provided there is sufficient demand). These activities potentially include:
• study support, ‘catch up’, ‘stretch’ activities and homework clubs; • arts activities such as dance, drama and arts and crafts
• sports activities;
• other recreational activities, for example creative use of ICT, music lessons, languages, enterprise activities, museum visits and residential trips; and
• holiday provision and summer schools.
Swift and Easy Access
Swift and easy access (SEA) is underpinned by preventative work, through other elements of the core offer, and the wider curriculum. Where problems emerge, SEA ensures the early identification of and support for a wide range of difficulties children and young people can face.
SEA involves schools working closely with statutory agencies and the voluntary and community sector to identify children and young people with emotional, behavioural, health or other difficulties as early as possible.
The school and partnering agencies can then form a ‘team around the child’, planning and delivering a package of ongoing support designed to overcome barriers to learning and enable the child or young person achieve their full potential. That support package could include:
• speech and language therapy;
• child and adolescent mental health services (CAMHS); • family support services;
• intensive behaviour support; • counselling; and
Section 1 Background and introduction
17
Parenting Support
Parenting support aims to equip parents and carers with the skills to support their child’s education and to deal effectively with issues that could affect the well-being of the family. Schools need to provide access to:
• local services, tailored to the needs of those parents who stand to benefit most from support;
• transition information sessions for parents whose children are joining a reception class or transferring to secondary school;
• details of local and national sources of advice and support; • access to parenting groups that use structured, evidence-based
parenting programmes;
• access to informal networking opportunities such as coffee mornings and cookery or ICT classes; and
• family learning sessions (depending on demand).
Community Access
Many schools open up facilities such as ICT suites and sports and arts facilities to the wider community. They also offer space – such as their school halls – and run further education and vocational classes and adult learning programmes.
Funding
In July 2007, the Department for Children, Schools and Families announced an additional £1.3 billion over 2008-11 to support the on-going development of services, including extended service co-ordinators in secondary schools and clusters of primary schools to ensure sustainability.
Numbers of Extended Schools
The number of Extended Schools has grown steadily since their introduction in 2006. In September 2006 there were 3,277 Extended Schools (117 Nursery, 2,328 Primary, 734 Secondary and 98 Special Schools), which had increased to 8,105 by September 2007 (238 Nursery, 5,991 Primary, 1,633 Secondary and 243 Special Schools). At the time of starting this research project (March 2008), the total number of Extended Schools had increased further to 10,043 (272 Nursery, 7,542 Primary, 1,912 Secondary and 317 Special Schools).
Section 1 Background and introduction
18
Breakdown of activities
The core offer of the Extended School is defined as consisting of service provision along five dimensions:
A varied menu of activities, in a safe place to be, combined with
Childcare in primary schools (8am – 6pm, 48 weeks of the year);
Swift and easy access to targeted and specialist services;
Parenting support; and
Community access to school facilities.
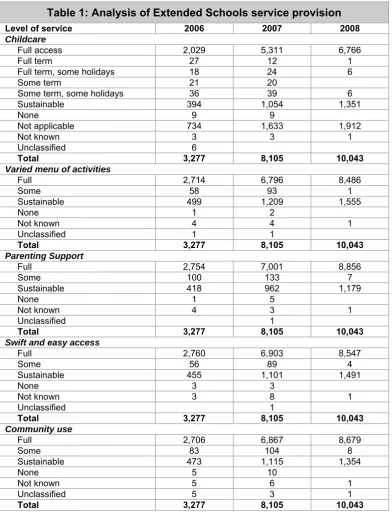
The level of service provided across these dimensions varies between the schools in the scheme, with full service provision across the dimensions not obligatory. The breakdown of the level of service for each dimension across the three years from 2006 to 2008 is presented in Table 1.
The analysis of TDA data illustrates that the majority of Extended Schools provide full services across all dimensions. Between 83% and 88% of the Extended Schools studied provide a full service level in four of the five dimensions, with the proportion of the Extended Schools studied offering childcare ranging between 63% and 67%. However, the fact that secondary schools are not required to provide childcare services accounts for this lower percentage, and is evidenced by the large number of ‘not applicable’ entries in the childcare dimension.
In addition to those schools offering ‘full’ services, there are also a number of schools that are defined as offering ‘sustainable’ services. In this context, ‘sustainable’ means that the service is fully embedded (and self financed) in the school and also that the service is ‘full access’. There were a very limited number of Extended Schools not providing the ‘full service’ offering (less than 0.5% of the Extended Schools studied (see note to Table 1)).
Section 1 Background and introduction
[image:22.595.103.496.92.606.2]19
Table 1: Analysis of Extended Schools service provision
Level of service 2006 2007 2008
Childcare
Full access 2,029 5,311 6,766
Full term 27 12 1
Full term, some holidays 18 24 6
Some term 21 20
Some term, some holidays 36 39 6
Sustainable 394 1,054 1,351
None 9 9
Not applicable 734 1,633 1,912
Not known 3 3 1
Unclassified 6
Total 3,277 8,105 10,043
Varied menu of activities
Full 2,714 6,796 8,486
Some 58 93 1
Sustainable 499 1,209 1,555
None 1 2
Not known 4 4 1
Unclassified 1 1
Total 3,277 8,105 10,043
Parenting Support
Full 2,754 7,001 8,856
Some 100 133 7
Sustainable 418 962 1,179
None 1 5
Not known 4 3 1
Unclassified 1
Total 3,277 8,105 10,043
Swift and easy access
Full 2,760 6,903 8,547
Some 56 89 4
Sustainable 455 1,101 1,491
None 3 3
Not known 3 8 1
Unclassified 1
Total 3,277 8,105 10,043
Community use
Full 2,706 6,867 8,679
Some 83 104 8
Sustainable 473 1,115 1,354
None 5 10
Not known 5 6 1
Unclassified 5 3 1
Total 3,277 8,105 10,043
Section 2 Methodological approach
20
2 Methodological approach
2.1 Data sources
2.1.1 National Pupil Database
The Department for Children, Schools and Families (DCSF) collects attainment data for the approximately 2.5 million pupils sitting statutory National Curriculum assessment at ages seven (Key Stage 1), eleven (Key Stage 2), fourteen (Key Stage 3) and sixteen (Key Stage 4).
Since January 2002 the Department has also carried out the School Census. This collects data on individual pupil characteristics (such as ethnicity) for all pupils in maintained schools in England.
This School Census information has been linked with current and prior attainment data in the National Pupil Database, to provide an extremely rich data source. With repeated measurements of pupil attainment, at key points in their education rather than fixed time intervals, and a yearly record of their characteristics it is possible to identify and analyse the links between
characteristics and pupil attainment and progress.
Pupils are assessed by statutory National Curriculum assessment at ages seven, eleven and fourteen6. These assess the level a pupil has reached at
the end of a Key Stage. Key Stage 1 assessments are taken at age seven, Key Stage 2 assessments at age eleven and Key Stage 3 assessments at age fourteen. Assessment at the end of Key Stage 4 (typically by those who will be sixteen at the end of the school year) is measured by achievements at GCSE and equivalents.
The National Curriculum defines expected levels for the Key stages. At Key Stage 1 the expected level is Level 2, at Key Stage 2 it is level 4 while at Key Stage 3 it is Level 5. This information is summarised in Table 2 overleaf.
Section 2 Methodological approach
[image:24.595.104.513.91.425.2]21
Table 2: Illustration of Key Stages, Levels within Key Stages and Assessment within the National Curriculum
Age Stage Range of levels within which majority of pupils expected to
work
Assessment
5-6 6-7
Key Stage 1 Levels 1, 2 and 3
For most children, level 2 is the minimum expected level of attainment
Teacher Assessment in English (Reading, Writing, Speaking and Listening), Maths and Science
7-8 8-9 9-10 10-11
Key Stage 2 Levels 2, 3, 4 and 5
For most children, level 4 is the minimum expected level of attainment
National tests and teacher
assessments in English, Maths and Science
11-12 12-13 13-14
Key Stage 3 Levels 3, 4, 5, 6 and 7
For most children, level 5 is the minimum expected level of attainment
National tests in English, maths and science
14-15 15-16
Key Stage 4 5 or more GCSEs at grades A*-C
(including maths and English) GCSEs or other national qualifications
2.1.2 Index of Multiple Deprivation
As part of the propensity score matching exercise (see section 2.2), we made use of the Index of Multiple Deprivation 2004 to account for the local
contextual factors in which schools operated.
The Index of Multiple Deprivation 2004 is a measure of multiple deprivations at the small area level, measured across seven domains of deprivation: income deprivation; employment deprivation; health deprivation and disability; education, skills and training deprivation; barriers to housing and services; living environment deprivation; and crime. The overall IMD 2004 is
conceptualised as a weighted area level aggregation of these specific
dimensions of deprivation. This allows each area to be ranked relative to one another according to their level of deprivation. We provide the domains and associated weights used to derive the aggregate measure of deprivation below:
• Income Deprivation Domain (22.5%); • Employment Deprivation Domain (22.5%);
• Health Deprivation and Disability Domain (13.5%);
Section 2 Methodological approach
22
• Crime Domain (9.3%); and
• The Living Environment Deprivation Domain (9.3%).
In addition, we made use of the specific education, skills and training domain as a further variable for matching Extended Schools with potential control schools.
The education, skills and training domain captures the extent of deprivation in terms of education, skills and training in a local area. The indicators fall into two sub domains: one relating to education deprivation for children/young people in the area; and one relating to lack of skills and qualifications among the working age adult population. The specific categories contributing to this domain score are presented below.
Sub Domain: Children/young people
• Average points score of children at Key Stage 2 (2002). • Average points score of children at Key Stage 3 (2002). • Average points score of children at Key Stage 4 (2002).
• Proportion of young people not staying on in school or school level education above 16 (2001).
• Proportion of those aged under 21 not entering Higher Education (1999-2002).
• Secondary school absence rate (2001-2002).
Sub Domain: Skills
• Proportions of working age adults (aged 25-54) in the area with no or low qualifications (2001).
2.2 Propensity score matching
Our overall approach to the econometric modelling of the future educational impacts of the Extended Schools programme has been based on a two stage approach. The first stage of the analysis has involved the selection of a sample of comparison schools which better reflect the characteristics of the school, pupils and the local area in which Extended Schools operate. This has been achieved through a propensity score matching model.
The second stage of the analysis has been to undertake an assessment of the outcomes achieved at school level (Extended Schools versus their respective control schools) and by pupils in the Extended Schools studied (relative to pupils in control schools) over time. This has been achieved by undertaking a ‘difference in differences’ approach at school level and econometric analysis at pupil level.
Section 2 Methodological approach
23
2.2.1 Rationale for propensity score matching
The work undertaken on the evaluation of various government programmes (Machin et al. (2004)7) illustrate the care needed when approaching the
problem of estimating the effect of policy programme on educational attainment and associated pupil level outcomes.
As previously mentioned, a key research requirement is to assess the effect of this programme in terms of educational attainment, controlling for all other factors. Schools participating in the Extended Schools programme may not
be nationally representative given the fact that selection may have taken place (at least) on the basis of other factors such as educational ‘attainment’ and ‘need’.
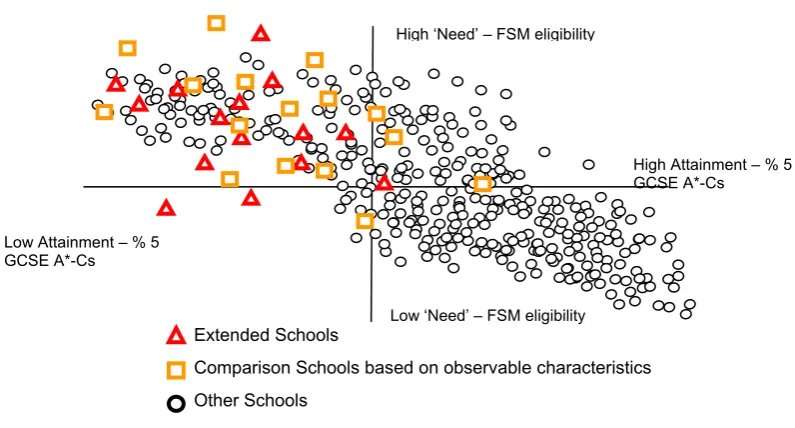
We illustrate this in Figure 1 overleaf. In the longer term, there is little point in comparing Extended Schools (represented in red) with all other schools (represented in black) as it is clear that there are other factors that are driving educational attainment at any point in time, not just participation in the
Extended Schools programme. It might be found that Extended Schools are making better than national average progress but this might be associated with an entirely different policy that might be affecting Extended Schools simultaneously. To ensure a proper comparison, it is essential to determine the main characteristics of Extended Schools and create a comparison group based on those same observable characteristics (as highlighted in gold for illustrative purposes) at school level.
The optimal means of achieving this is to undertake a propensity score matching model to match those Extended Schools contained with a sample of other schools possessing similar observable characteristics (such as aggregate qualification attainment, the proportion of children eligible for Free School Meals, school roll, ward level index of multiple deprivation etc). This needs to be undertaken to ensure that the effect of the Extended Schools programme on outcomes in the second stage of the analysis is isolated rather than incorrectly attributing any impact to independent factors that might have affected the school at the same time.
Section 2 Methodological approach
24
Figure 1: An illustration of our approach to selecting control schools
In terms of undertaking the specific propensity score matching model, we generated three treatment groups as follows using information from the Training and Development Agency:
T1 Schools that have been an Extended School at any point
T2 Schools that became an Extended School for the first time in 2006 T3 Schools that became an Extended School for the first time in 2007
From the entire population of schools that have never been an Extended School, we selected three sets of control schools – at primary and secondary level separately – based on school, pupil and socioeconomic characteristics as follows:
School and pupil level characteristics:
• Sex of school (male, female, co-educational)
• School type (comprehensive8, middle school (deemed either
secondary or primary), and primary/infant schools • Number of full time equivalent pupils on roll
8 There were 12 sub-categories of comprehensive schools although the vast majority were either standard comprehensives with pupils aged between 11 and 16 or comprehensives with pupils aged between 11 and 18.
High ‘Need’ – FSM eligibility
Low ‘Need’ – FSM eligibility Low Attainment – % 5
GCSE A*-Cs
[image:27.595.108.506.138.352.2]High Attainment – % 5 GCSE A*-Cs
Figures are illustrative and not based on actual data
Extended Schools
Comparison Schools based on observable characteristics
Section 2 Methodological approach
25
• Number of full time equivalent qualified teachers • Pupil teacher ratios
• Proportion of children eligible for free school meals
• Proportion of children with SEN (statmented and un-statmented) • Proportion of children from BME origin
• Proportion of children with EAL
• Average KS1 point score in 2003/2004 (reading and maths)9
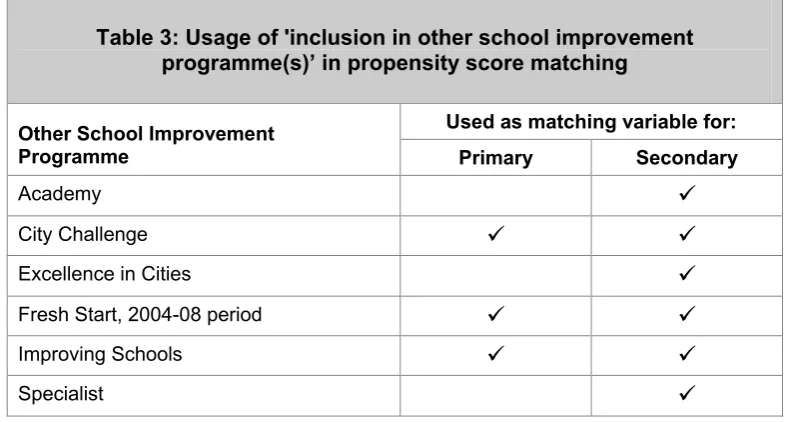
• Average KS3 point score in 2003/2004 (English, maths and science)10 • Participation in other school improvement programmes:
o City Academy (secondary schools only) o City Challenge
o Excellence in Cities (secondary schools only) o Fresh Start
o Improving Schools Programme
o Specialist school (secondary schools only)
Socio economic characteristics
Deprivation Index variables:
• Overall score on Index of Multiple Deprivation • IMD education, skills and training domain score • IMD skills sub domain score
• IMD children/young people sub domain score
The propensity score matching model is presented overleaf along with some information relating to the validity and robustness of the matching process presented in the Annex.
2.2.2 Propensity Score matching model and validity of
matching technique
Simply put, the PSM process involves creating a score which indicates the likelihood of any particular school being in the Extended School programme, and even schools not in the programme will have an estimated probability of being so. This score or probability is derived from a first stage estimation of a
probit equation model where the dependent variable takes the value of one if a school is an Extended School and zero otherwise. School level
characteristics, as described above, are then added to the model to try to predict the likelihood of schools being in the programme.
From this model each school gets a predicted probability score, which in essence indicates the likelihood of that school being in the programme with their given characteristics. This score is then used as the basis for choosing a
Section 2 Methodological approach
26
control group. In other words, Extended Schools will be matched with schools that are not in the programme but have similar propensity scores.
To undertake this process in practice, as a first step, the schools dataset is split into separate data files, one for primary schools and one for secondary schools, before the propensity score matching analysis is conducted on each. This step ensures that primary schools in the treated group (i.e. Extended Schools) can only be matched with a non-treated primary school, and similarly for secondary schools.
2.2.3 Model specification
The model specification for the propensity score match is as follows:
ESp,t,i = αp,t,i + φ (Xp,t,i) + β (Zp,t,i) + γ(Ip,t,i) + δ(Mp,t,i) + εp,t,i
for each:
p = school phase (primary, secondary).
t = treatment type (1, 2, 3, 4, 5).
i = individual school.
where:
ES = Indicator of school i’s being an Extended Schools.
X = Average prior attainment score of pupils at the school (primary: Key Stage 1; secondary: Key Stage 3), prior to the introduction of the
scheme, 2003/04.
Z = A range of school-level characteristics.
I = A range of domain/sub-domain IMD 2004 scores.
M = Indicators of participation by the school in other school
Section 2 Methodological approach
[image:30.595.99.493.96.307.2]27
Table 3: Usage of 'inclusion in other school improvement programme(s)’ in propensity score matching
Used as matching variable for: Other School Improvement
Programme Primary Secondary
Academy
9
City Challenge
9
9
Excellence in Cities
9
Fresh Start, 2004-08 period
9
9
Improving Schools
9
9
Specialist
9
Statistical package and routine adopted
We have used the Stata statistical analysis package, with the psmatch2
module11 to conduct the propensity score matching analysis. psmatch2 is a
purpose-written routine which implements a variety of propensity score
matching methods to adjust for pre-treatment observable differences between a group of treated and a group of untreated observations.
Following trial of the variety of approaches within psmatch2, we selected one-to-one ‘nearest neighbour’ matching allowing replacement of control
observations after matching, subject to a common support condition. We describe this in more detail below.
One-to-one ‘nearest neighbour’ propensity score matching selects, for each treatment group school, the one control group school with the most similar p-score. Based on the range of school-level characteristics in the model, the technique picks the two most alike schools at the baseline period (prior to the introduction of the Extended School programme) with the crucial difference between them being that one school is an Extended School whereas the other is not. The starting premise is that we would expect, other things being equal, the two chosen schools to evolve along the same path with regard to educational attainment. By taking account of the fact that one is an Extended School and the other is not, we may gain an insight into the impact of the ‘treatment’ of the scheme had on educational attainment.
In conducting propensity score matching, there is a choice of allowing the replacement of control observations following matching or not. On the one hand, if no replacement is allowed, once a control school has been matched to a treated school, it is removed from the sample from which matches are
Section 2 Methodological approach
28
selected for subsequent treatment schools. Therefore, whilst the approach yields unique matches of a control school to each treated school, the quality of the match of the propensity scores diminishes for the later treated schools (with the dataset ordered randomly), as the size of the control observation pool is reduced.
On the other hand, if replacement is allowed, each ‘matched’ control school is returned to the control pool for all subsequent matches, and so the full sample of control schools is available from which to select a match for each treated school. Therefore, this approach involves a trade-off between the introduction of a possible bias in attainment (due to replication of control observations in the matched sample) and the increased ‘fit’ of all matches, particularly those in the latter part of the sample.
Following the trial and comparison of different propensity score models allowing and disallowing replacement scenarios, we chose to allow
replacement. The primary rationale for this choice is motivated the superior ‘fit’ of the treated/control school matches, as illustrated in the kernel density
charts of the propensity scores under the two scenarios presented in Annex 2. Given the large size of our sample, the trade-off between the increased efficiency of the estimator and the potential bias introduced by allowing repetition was deemed acceptable. We provide some information in Table 4 and Table 5 of the sample of schools that are contained in each treatment and control group at primary and secondary level.
Finally, the common support condition imposes the filter that the propensity score of all treatment observations must fall within the minimum and the maximum propensity score of the control observations, otherwise treated observations are dropped. This further imposes a quality filter on the matches.
Validity of matches
In spite of the data filtering and model selection criteria, as with all
econometric models, it is important to gauge the ‘goodness of fit’ of the model to the data, which may be considered as an indicator of the overall quality of the model. In propensity score modelling, however, traditional measures of ‘goodness of fit’12 do not apply and there is no consensus in the literature on
a clear metric. Therefore, following a review of the literature and research in the area, we have selected an approach which compares the difference between the propensity score of the treated school and its matched control school with the variance of the propensity scores of the treated group to gauge the validity of the matches.
The results of our validity of matches analysis show that in all cases, 100% of the difference between the predicted treated and control propensity scores lie within one standard deviation of the mean of the predicted treated group’s
Section 2 Methodological approach
29
propensity scores. This suggests that our model fits the data well and that the matches formed by the model are strongly valid.
2.2.4 Caveats
The propensity score matching approach takes account of only observed factors that differ between the treatment and selected control group (Shadish, Cook and Campbell, 200213). PSM therefore does not solve all the potential
biases that may emerge when trying to compare achievement or other outcomes across the control and treatment groups. This is why the second stage of the analysis will involve using a “difference in difference” analysis.
2.2.5 Comparison of treatment schools and national average
In Table 4 and Table 5 overleaf, we provide some summary statistics in relation to the various characteristics of the schools as part of the matching process. The analysis was based on information from the Schools Census and National Pupil Database from 2003/04 – deliberately chosen to be well in advance of the first schools becoming an Extended School.
We have presented the information in relation to primary schools and secondary schools separately as the matching exercise was undertaken for each phase of education independently. We also provide information on the baseline characteristics of all schools nationally to illustrate whether the Extended Schools studied might have particular characteristics that are fundamentally different from the “typical” primary or secondary school.
Attainment
The information presented in Table 4 (and Table 5) indicates that the Extended Schools studied are fundamentally different from schools more generally – both in terms of intake and outcomes.
In particular, at Key Stage 1 (used as part of matching process), pupils in schools that were an Extended School at any point (Treatment 1) achieve an average point score that is 0.5 points lower than the national average in Key Stage 1 speaking and listening, 0.4 points lower in Key Stage 1 reading, 0.4 points lower in Key Stage 1 writing, 0.3 points lower in Key Stage 1 maths and 0.41 points lower in Key Stage 1 science. Therefore the intake into Extended Schools in 2003/04 was significantly lower than primary schools more generally.
In terms of outcomes, at Key Stage 2, pupils in schools that were an
Extended School at any point (Treatment 1) achieve a 0.2 point lower score in Key Stage 2 English, a 0.2 lower point score in Key Stage 2 maths and a 0.2 point lower score in Key Stage 2 science.
Section 2 Methodological approach
30
A similar picture emerges in relation to pupils at secondary level. In relation to schools that were an Extended School at any point, pupils in those schools achieve a 0.8 point lower score in Key Stage 3 English, a 0.4 lower point score in Key Stage 3 maths and a 0.4 point lower score in Key Stage 3 science.
At Key Stage 4, the average capped and uncapped total points score amongst pupils in schools that were an Extended School at any point is 6.3 and 8.3 points lower than the national average (respectively) and pupils in these schools are 0.3% less likely to achieve 1 or more GCSEs at grade A*-G, 2.5% less likely to achieve 5 or more GCSEs at grade A*-C and 2.8% less likely to achieve 5 or more GCSEs at grade A*-C (including maths and English).
Pupil Characteristics
Other interesting features to emerge from the analysis of baseline characteristics is the fact that the Extended Schools studied have a significantly higher proportion of children eligible for Free School Meals (18.1% compared to 15.3% nationally at primary level and 16.2% compared to 14.6% at secondary level); a higher proportion of children from BME backgrounds (14.2% compared to 12.7% nationally at primary level and 13.9% compared to 13.0% nationally at secondary level); and a higher proportion of pupils with Special Educational Needs (18.2% compared to 17.5% nationally at primary level and 17.5% compared to 16.4% nationally at secondary level). This finding is entirely unsurprising given the fact that the Extended Schools programme was focused in schools operating in areas suffering from the highest levels of socioeconomic deprivation.
Section 2 Methodological approach
[image:34.595.94.762.118.416.2]31
Table 4: Baseline characteristics of treatment and control schools – primary level
All
Schools T1 C1 T2 C2 T3 C3
KS1 Speak/listen av. point score 16.5 16.0 16.1 15.0 14.9 16.3 16.3 KS1 Reading average point score 16.4 16.0 16.0 15.1 15.1 16.2 16.2 KS1 Writing average point score 14.6 14.2 14.2 13.3 13.2 14.5 14.5 KS1 Maths average point score 16.8 16.5 16.5 15.7 15.6 16.7 16.7 KS1 Science average point score 17.1 16.7 16.7 15.7 15.7 17.0 16.9 KS2 English average point score^ 27.8 27.6 27.7 27.3 27.3 27.7 27.7 KS2 Maths average point score^ 27.8 27.6 27.7 27.2 27.2 27.7 27.6 KS2 Science average point score^ 29.0 28.8 28.9 28.4 28.4 28.9 29.0 FTE pupils 234.3 248.6 251.3 271.2 269.4 245.9 248.4 FTE qualified teachers 10.3 11.0 11.1 12.1 12.0 10.9 10.9 Pupil Teacher ratio 22.4 22.4 22.5 22.4 22.5 22.4 22.4 Prop. Vol. Aided/Controlled^ 36.7 31.4 40.6 25.3 32.6 32.3 37.7 Proportion eligible for FSM 15.3 18.1 17.6 23.6 23.2 16.6 16.3
Proportion BME 12.7 14.2 13.7 16.9 17.1 13.7 12.7
SEN (Statemented) 1.7 1.7 1.7 1.71 1.8 1.7 1.71
SEN (non-statemented) 15.8 16.5 16.4 18.5 18.5 16.0 16.0
IMD Score 21.2 23.7 23.5 29.5 29.3 22.2 22.2
Sample size 16,751 5,638 3,074 1,524 1,124 2,619 1,902
Section 2 Methodological approach
32
Table 5: Baseline characteristics of treatment and control schools – secondary level
All
Schools T1 C1 T2 C2 T3 C3
KS3 English average point score 34.5 33.7 34.2 33.6 33.7 34.3 34.4 KS3 Maths average point score 35.8 35.4 35.3 34.7 34.6 35.6 35.6 KS3 Science average point score 33.8 33.4 33.4 32.8 32.7 33.6 33.6 KS4 av. uncapped total point score^ 342.8 334.5 337.0 319.4 322.7 339.6 341.7 KS4 average capped total point score^ 284.3 278.0 278.6 266.3 268.3 281.8 282.9 KS4 % >=1 GCSE A*-G^ 95.9 95.6 95.8 94.8 94.8 95.9 95.9
KS4 % >=5 GCSE A*-C^ 53.1 50.6 51.1 46.2 47.6 52.0 52.9 KS4 % >=5 GCSE A*-C (incl. E&M)^ 41.5 38.7 38.9 34.2 34.9 40.2 40.9
FTE pupils 994.2 1,043.4 1,032.9 1,039.7 1,021.5 1,048.1 1,043.9 FTE qualified teachers 58.4 61.5 60.8 61.6 60.5 61.4 60.6 Pupil Teacher ratio 17.3 17.1 17.0 17.0 17.0 17.2 17.3 Prop. Vol. Aided/Controlled^ 19.7 14.4 25.2 9.2 17.8 16.2 23.0 Proportion eligible for FSM 14.6 16.2 15.6 18.6 19.3 15.4 15.2
Proportion BME 13.0 13.9 13.1 14.0 14.9 14.0 13.4
SEN (Statemented) 2.5 2.6 2.7 2.8 2.92 2.5 2.6
SEN (non-statemented) 14.0 14.8 15.0 16.6 16.6 14.1 14.0
IMD Score 20.0 21.4 20.6 23.4 22.3 20.9 20.7
Sample size 3,236 1,473 569 510 297 674 385
Section 2 Methodological approach
33
2.2.6 Comparison between different treatment groups
As part of the analysis and to understand the differences between becoming an Extended School at different points in time, we also illustrate the baseline characteristics associated with schools that became an Extended School for the first time in 2006 and those schools that became an Extended School for the first time in 2007.
Schools that became an Extended School for the first time in 2006 (Treatment group 2) have significantly lower attainment compared to schools becoming an Extended School for the first time in 2007. At primary level, schools in Treatment group 2 have lower attainment than primary schools nationally; lower attainment than the Extended Schools studied as a whole and lower attainment than schools that became an Extended School for the first time in 2007 (Treatment group 3). In particular, pupils in schools in Treatment group 2 had an average point score that was 1.3 points lower in Key Stage 1 speaking and listening, 1.1 points lower in Key Stage 1 reading, 1.2 points lower in Key Stage 1 writing, 1.2 points lower in Key Stage 1 maths and 1.3 points lower in Key Stage 1 Science (compared to Treatment Group 3). Therefore the intake into the first phase of Extended Schools is significantly lower than primary schools more generally and other phases of Extended Schools.
At Key Stage 2, pupils in schools becoming an Extended School for the first time in 2006 (Treatment group 2) achieved a 0.4 point lower score in Key Stage 2 English, a 0.5 lower point score in Key Stage 2 maths and a 0.4 point lower score in Key Stage 2 science compared to schools becoming an
Extended School for the first time in 2007 (Treatment Group 3).
At secondary level, a similar picture emerges. In relation to schools that became an Extended School for the first time in 2006, pupils in those schools registered a 0.5 point lower score in Key Stage 3 English, a 0.7 lower point score in Key Stage 3 maths and a 0.6 point lower score in Key Stage 3
science compared to those schools becoming an Extended School for the first time in 2007.
At Key Stage 4, the average capped and uncapped total points score amongst pupils in schools that became an Extended School in 2006 is 10.3 and 14.3 points lower than schools becoming an Extended School for the first time in 2007 (respectively). In addition, pupils in these schools are 1.0% less likely to achieve 1 or more GCSEs at grade A*-G, 3.5% less likely to achieve 5 or more GCSEs at grade A*-C and 4.0% less likely to achieve 5 or more GCSEs at grade A*-C (including maths and English).
Section 2 Methodological approach
34
proportion of pupils with Special Educational Needs (20.2% compared to 17.7%).
The analysis also illustrates that schools becoming an Extended School for the first time in 2006 are substantially more likely to be located in areas that suffered from higher levels of socioeconomic deprivation compared to schools becoming an Extended School for the first time in 2007.
2.2.7 Comparison between treatment and control groups
We would expect that following the propensity score matching exercise, the characteristics of the various groups of control schools should mimic the characteristics of the three treatment groups. Table 4 and Table 5 illustrate the extent of the match that has been achieved. The tables illustrate that across the entire range of characteristics upon which treatment and control schools have been selected, there is remarkable consistency between the groups of schools (both in terms of matching variables and outcome variables (such as attainment and Key Stages 2 and 4)). This fact provides us with additional evidence that the methodological approach undertaken is robust.
2.3 Difference in differences
As with other studies of this nature, we have adopted a ‘difference in differences’ approach to assess changes in outcome variables at school level. As previously mentioned, we have attempted to isolate the relative performance associated with schools in the programme by matching the schools affected by the Extended School programme (in the three treatment groups) and similar schools not yet affected by the policy (the three control groups) using a variety of school, pupil and local level characteristics.
Once the creation of a control group of schools has been achieved, the difference in differences approach enables comparison of progress in terms of particular school level outcomes achieved by pupils in the Extended
Schools studied as compared to pupils in the control group of schools. This is presented for illustrative purposes in Figure 2 overleaf. For instance, the example in Figure 2 indicates that the difference in attainment between treatment and control schools was -1.4 percentage points prior to the introduction of the programme (i.e. treatment group underperformed control group by 1.4 percentage points). The difference in attainment following the introduction of the programme was -0.6 percentage points. Therefore, the
Section 2 Methodological approach
35
A 'difference in difference' approach to estimating pupil attainment
31.3 36.0 32.7 36.6 30 31 32 33 34 35 36 37 38 39 40 2004 2007 P ropor ti on of s tude nt a c hi v ing 5 o r m o re GC S E s at A *-C BSF Schools Comparison Schools β1 = -1.4
β1 +βBSF= -0.6
Difference in differences effect: βBSF= +0.8 percentage points
Figure 2: An illustration of ‘difference in differences’
The specific variables that we have considered as part of this school level analysis between 2002/03 and 2006/07 are as follows:
• Primary Level
o KS1 test scores of intake14 (disaggregated by Level) including
Proportion of children achieving all Levels in Speaking and Listening, Reading, Writing, Maths and Science
Total Points score (Reading, Maths and Science)
o KS2 test scores (disaggregated by Level) including
Proportion of children achieving all Levels in English, Maths and Science
Total Points score (English, Maths and Science)
• Secondary Level
o KS3 test scores (disaggregated by Level) including
Proportion of children achieving all Levels in English, Maths and Science
Total Points score (English, Maths and Science)
14 We considered Key Stage 1 outcomes to understand whether there has been a fundamental change in the characteristics of school intake associated with being part of the Extended Schools programme.
β1 + βES=-0.6
Section 2 Methodological approach
36
o KS4 test scores –
Proportion of children achieving 5 or more GCSEs at grades A*-C
Proportion of children achieving 5 or more GCSEs at grades A*-C (including Maths and English)
Proportion of children achieving 1 or more GCSEs at grades A*-G
Average Points Scores (capped and uncapped)
2.4 Econometric Analysis
The econometric approach requires the comparison of educational attainment of those pupils in the