City, University of London Institutional Repository
Citation
: Iwatsubo, K. & Marsh, I. W. (2014). Order flows, fundamentals and exchange
rates. International Journal of Finance and Economics, 19(4), pp. 251-266. doi:10.1002/ijfe.1490
This is the accepted version of the paper.
This version of the publication may differ from the final published
version.
Permanent repository link:
http://openaccess.city.ac.uk/12155/Link to published version
: http://dx.doi.org/10.1002/ijfe.1490
Copyright and reuse:
City Research Online aims to make research
outputs of City, University of London available to a wider audience.
Copyright and Moral Rights remain with the author(s) and/or copyright
holders. URLs from City Research Online may be freely distributed and
linked to.
City Research Online: http://openaccess.city.ac.uk/ [email protected]
1
Order Flows, Fundamentals and Exchange Rates
Kentaro Iwatsubo and Ian W. Marsh
1March 2012
Abstract: We examine the links between end-user order flows as seen by a major European commercial bank and macroeconomic fundamentals. We show that both exchange rate changes and flows are only weakly related to macroeconomic news announcements and hypothesise that “the cat is already out of the bag” by the time the news is announced. Instead, order flows of financial and corporate customers reflect in real time the evolution of macroeconomies. The actions of the banks receiving the order flows in turn reveal the information to the market as a whole which prices the exchange rate accordingly. By the time the news is announced, the exchange rate already contains the majority of the information.
1 Contact author: Ian Marsh, Cass Business School ([email protected]). Kentaro Iwatsubo, Kobe University
2
A number of studies use real-time data to analyze the link between economic fundamentals and exchange rates and they show that the exchange rates respond to the publicly announced macro news (Andersen et al., 2003; Ehrmann and Fratzscher, 2005). Furthermore,
Dominguez and Panthaki (2006) find that both fundamentals-related and non-fundamentals-related news significantly influence intra-day exchange rate returns. However, these measures of news explain a relatively small fraction of the total exchange rate variation. One reason is that the unexpected component of unscheduled news is hard to detect but could, potentially, account for the rest of the variation in exchange rates. This does not remove the basic puzzle of why exchange rates react so little to news about fundamentals economists think ought to be important in determining fair value.
An explanation may be that the information about pre-announced fundamentals is, to some degree, already incorporated in the exchange rates. The modern microstructure approach to exchange rates would suggest that this takes place by way of order flows (Evans and Lyons, 2005). Dealers observe private signals about so-far unannounced fundamentals through order flow from their clients, together with public signals through interbank order flows on broker systems like EBS or Reuters.
This paper explores whether pre-announced economic fundamentals are recognized by traders and these pieces of private information are priced in the exchange rates. If so, who are better informed about the not-yet-announced macro variable? When do they react to the development of economic fundamentals by changing their order flow? Among many potentially relevant macroeconomic fundamentals, what variables play a significant role in influencing the exchange rate? Our investigation contributes to the development of a new micro-theory of exchange rate determination.
This paper uses disaggregated end-user order flow data to assess the forecastability by investor groups of macro fundamentals and analyzes how the unannounced macro fundamentals are priced in exchange rates.
We run five sets of regressions. First, we regress exchange rate changes on news
3
neither the exchange rate nor trading in that market are much influenced by announcements, confirming one element of the disconnect puzzle outlined above and discussed in more detail below.
In our third set of regressions we test whether flows respond to developments in the macroeconomies. We find that different customers respond to different macroeconomic variables. In particular, financial intuitions are better informed than corporations about the development of macro fundamentals such as GDP, Industrial Production and CPI. On the other hand, corporations are well informed about the unemployment rate. These fundamental developments have not been announced publicly yet dealers can learn about them through the private signal contained in their customers’ order flows. We therefore run regressions that use order flows from different customer segments to ‘predict’ these unannounced
macroeconomic developments. Finally, we test whether the market exchange rate prices these predicted fundamentals. Our results suggest that either the actions of our bank in setting prices and/or trading or a positive correlation between private signals2 allows the market to set exchange rates that take fundamental developments into account even before those developments have been officially released via data announcements. The disconnect puzzle of the lack of response of exchange rates to macroeconomic announcements is because the cat is already out of the bag by the time announcements are made. The market has learned of the economic developments, at least in part through customer order flows, and has priced them accordingly.
The paper proceeds as follows. In the next section we review and attempt to link two rather separate literatures; the exchange rate disconnect literature starting with the work of Obstfeld and Rogoff (2000), and the rather smaller set of papers that consider the information content of order flow in foreign exchange markets. Section 2 describes our data set and outlines our hypotheses and methods. Section 3 reports and interprets our results, and the paper ends with a brief summary and conclusion.
2 An informed investor might split a large order into several smaller ones placed with different banks, or
4
1. Literature Review and Hypothesis Development
1.1Exchange rate disconnect
Meese and Rogoff (1983) took the leading macroeconomic models of the exchange rate available at the time and cast doubt on there being a reliable link between spot exchange rates and the fundamentals used in those models. The state-of-the-art of exchange rate modelling had hardly progressed by the new millennium when Obstfeld and Rogoff (2000) summarised the literature as demonstrating a disconnect between exchange rates and macroeconomic fundamentals.
One answer to the disconnect puzzle is that the link between fundamentals and exchange rates is too rich and dynamic to be easily captured by regression methods. Engel and West (2005) emphasise that it is expected fundamentals that impact prices rather than realised fundamentals, while Sarno and Valente (2009) argue that time-varying relations are natural in a world where risk premia and behaviour are changeable.
Andersen et al. (2003) show that the surprise component in news announcements moves exchange rates in the expected direction but the overall explanatory power of fundamental news events remains extremely low both because the magnitude of reactions to news is relatively small and because news announcements are infrequent. The exchange rate disconnect puzzle at macroeconomic frequencies of a month or more therefore matched by considerable unexplained exchange rate variation at higher frequencies. This has been termed the news puzzle.
5
1.2Information in order flow
While the macroeconomic literature at first worried about the disconnect puzzle and then embraced it as consistent with more sophisticated models, the microstructure approach stumbled upon a variable that is highly correlated with high frequency exchange rate movements – order flow. For example, Evans and Lyons (2002) show that interbank order flows can explain between 40 and 70% of the daily variation in spot returns for major
currencies. Interbank order flows result primarily from risk management activities of trading desks in response to order flows from their customers, and subsequent work has shown correlations between order flow from end-users and exchange rates consistent with the interbank results (Evans and Lyons, 2007; Marsh and O’Rourke, 2005).
Evans and Lyons (2007) attempt to bridge the gap between macro and microstructure by embedding microstructural currency trading in an open-economy DSGE macromodel. This model suggests that order flows contain information regarding macroeconomic developments but that the information is insufficient for dealers to infer the true state of the economy. Evans (2010) builds a model that combines elements of Evans and Lyons (2004) and Engel and West (2006) such that dealers extract information from order flow to infer the current state of the economy while recognising that policy-makers set short-term interest rates in response to changes in the macroeconomic environment.
Evans (2010) goes on to provide empirical support for his theoretical model by showing that customer order flow from Citibank between 1993 and mid-1999 provide incremental
information regarding the real-time state of the macroeconomy over and above that contained in current and past data releases. Further, the information in these flows is price relevant in that exchange rates significantly react to that portion of flows that add value in understanding the current state of the economy.
Our paper seeks to build on the work of Evans by using order flow from a different bank over a more recent time period to confirm that order flow contains price relevant macroeconomic information. We show that for most key macroeconomic variables, order flow is
6
that, reassuringly, these are the variables whose announcement effects are largest, suggesting that the foreign exchange market only learns this information when it is publicly announced.
1.3Hypotheses tested
The two literatures briefly surveyed above together suggest that exchange rates might react to macroeconomic developments at various points in time. In this sub-section we outline our regression approaches to testing these reactions.
Consider a generic macroeconomic variable, x, that is measured over a discrete interval (e.g. the CPI-based inflation rate). One observation on this variable might correspond to the j-day interval t0 through tj. Developments in this variable are not observable in real-time although
agents in the economy can observe signals based on their own limited information sets. For example, while the evolution of the aggregate consumer price level is not observable in real-time, a firm has information about the evolution of the basket of goods that it trades. A subset of this firm’s basket of goods is also a subset of the basket of goods measured to compute the consumer price index, and hence the firm observes in real-time a signal of the evolution of the consumer price index. Similarly, a financial firm is analysing public and private signals of the evolution of x based on its own imperfect information set. We assume that corporate and financial firms trade foreign exchange based on their interpretations of these public and private signals. The implication is that customer order flow ought to be contemporaneously correlated with macroeconomic developments. Ideally, we would
observe order flow at the individual firm level. Unfortunately individual customer order flow data is not available for long enough time periods to be analysed in this framework. Instead we are forced to aggregate order flow into customer categories (corporate customers and financial customers in our data set) and we test the link between order flow and fundamentals by regressing order flow from customer segment m observed between t0 and tj on
developments in i key macroeconomic variables x also measured between t0 and tj:
(1)
7
This order flow is seen by their foreign exchange dealer. Importantly, a dealer for a large bank observes order flow from many different customers. In effect the dealer is receiving many (private) signals about the private signals received by his many customers. The dispersed information held by the agents in the economy is then concentrated through order flow through one dealer. Of course, this aggregation is imperfect, but a central hypothesis of this paper is that the real-time order flow seen by a dealer contains information about the contemporaneous evolution of macro variables.
This is tested in the following section by reversing equation (1) outlined above and regressing variable xi between t0 and tj on order flow from customer segment m observed in the interval
t0 to tj:3
(2) Significant coefficients in this regression would indicate that a dealer can learn about variable
xi from the contemporaneous flows he observes. Note that this order flow is privately
observed and constitutes an informational advantage for the dealer. Cheung, Chinn and Marsh (2004) report results from a survey of dealers that confirm access to a large customer base as the single most important competitive advantage that a dealing desk might have. Equation (2) tests whether the access to customer order flow gives a dealer an advantage because he can use it to infer developments in the real economy before they are publicly announced.
Since all signals before the announcement are noisy, the announcement is likely to contain a surprise element that causes the exchange rate to adjust. The noisier the signals (both public and private), the less ability the dealer has to infer the evolution of fundamentals and so the larger the likely surprise element. One part of the literature on the effect of news on the exchange rate relies on econometric forecasts to generate expectations. These papers usually implicitly assume that the expectations are based on public information since only public information is included in the forecasting regressions. Papers that use expectations data from surveys loosen this constraint.
The announcement resolves all uncertainty about the value of xi (except to the extent that
revisions to an initial provisional estimate are likely) but this does not necessarily resolve the
3 Note that this equation does not assume causation runs from flows to the macroeconomic variable. It is used
8
implications of the value of xifor the exchange rate. We would expect to see (i) an
adjustment of the exchange rate to the surprise element of the news announcement, (ii) order flow following the announcement as agents react to the surprise element and (iii) subsequent exchange rate adjustments and order flow as the market prices the implication of the news announcement for the exchange rate. Our data are sampled at the daily frequency and so we cannot separate these various reactions. However we would expect to see contemporaneous correlations manifest by significance in regressions of the log change in the exchange rate or order flow on news announcements.
As detailed in the survey of the disconnect literature, however, the key finding in regressions of exchange rate changes on news is that the explanatory power is very low. To anticipate our results, we also find that news announcements explain only a tiny percentage of the variation in the spot euro-dollar exchange rate over our sample. Two resolutions to this puzzle suggest themselves. Either the macroeconomic variables we analyse are simply not relevant to exchange rate determination (an extreme answer to the disconnect puzzle) or the actual news announcement is largely irrelevant for exchange rate determination because the variable is already incorporated in the exchange rate. Within the microstructure approach, order flow is the mechanism by which macroeconomic developments might be learned by the market before they are publicly announced. We test the second potential resolution
regressing exchange rate changes (Δs) on the fitted values of fundamentals from regression (2) above.
(3)
These fitted values are predictions of the variables that the dealer could generate based solely on his private order flow. In reality, the information set available in making predictions is much larger and so these predictions are very basic. However, these regressions tell us whether that part of order flow that is correlated with fundamental x and observed before the value of x is announced publicly has already impacted the exchange rate. Statistical
significance, and more importantly a reasonable explanatory power would suggest that the market has priced in fundamentals before they are announced through the impact of order flow on the exchange rate.
9
2.1Order flow and exchange rates data
The order flow data used in this paper come from the Royal Bank of Scotland (RBS), beginning on 1 October 2001 and ending 29 June 2004 giving a total of 658 observations accounting for national holidays. During this period, RBS was among the top ten global foreign exchange banks. Customer order flow data are obviously highly confidential and so the data description provided here is necessarily less detailed than usual. However, we hope that readers still get a feel for the nature of the flows across this bank’s foreign exchange desks.
The RBS maintains a 24-hour foreign exchange trading service for its customers. The customer order flow data are aggregated over a 24-hour window from the opening of the Sydney market through the close of the US market (which approximates to midnight to midnight Greenwich Mean Time). The data include all spot transactions entered into by customers against the bank. The data do not include forward deals or deals between the bank and other banks via the inter-dealer markets. In this paper we focus on customer order flow data in the most liquid market, the euro-U.S. dollar.
The order flow is further disaggregated according to the counterparty classification assigned by the bank. There are four categories of customer: non-financial corporates (denoted Corp), unleveraged financials such as mutual funds, leveraged financials including hedge funds and other financials. The final category is rather heterogeneous but will include the trades of smaller banks that do not have access to the interbank dealer network and trades of central banks. Since the motives and relevance of this final category is not well understood we do not consider this set of flows individually below, although it is still included in the total measure of flows. We also aggregate the leveraged and unleveraged financial institutions into one category which we call ‘Financials’ (denoted Fin). The leveraged category is relatively small, particularly at the start of our sample, and its use as a standalone segment is questionable. Our results are robust to aggregating the two profit-maximising categories of financial customers or just using the unleveraged category alone.
Where possible we use the USD/EUR exchange rate data from Global Treasury Information Services, quoted at 18:00 NY (22:00 GMT). For missing data due to the US national
10
We also use other financial variables in our analysis. We collect LIBOR overnight interest rates at the 17:00 fixing in London from the British bankers Association and we use S&P500 and Euro STOXX stock price indices. All series are sourced from Datastream.
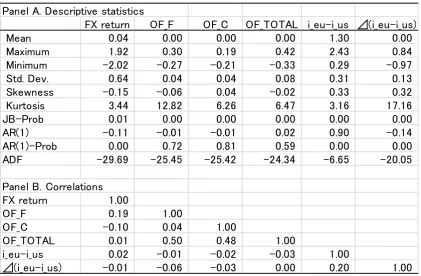
Table 1 contains some descriptive statistics of the key series analysed. Key points from this are that that flows from different counterparty classifications typically are not highly cross-correlated, and neither are they highly auto-correlated. FX returns, conversely, are strongly negatively autocorrelated as are changes in interest rate differentials. All series are
comfortably stationary.
< Table 1 here > < Descriptive Statistics >
2.2Macroeconomic data and expectations data
11
30 and 40 respondents who can revise their forecasts any time until each announcement. Expectations based upon this survey are likely, then, to be as up-to-date as possible.
We analyse 17 scheduled macroeconomic announcements, seven for Europe and ten for the United States, listed in the Appendix. However, we only report results based on eight main announcements in the text for compactness. The full sets of results are available on request. The eight macro variables we analyse in detail are CPI, GDP, industrial production and unemployment announcements for the euro-area and U.S.
We define news about a macroeconomic variable in two ways: the actual (or percentage) change in the variable which includes both the anticipated and surprise component of the announcement, and the surprise component. We measure the surprise component as the difference between the actual and expected value of the variable, standardized by the standard deviation of the news, as is normal in this literature.
3 Results and Interpretation
In this section we run sets of regressions with three aims in mind. First, we want to demonstrate that the exchange rate and flow disconnect puzzles hold for our data set.
Second, we want to better understand the determinants of order flow. In particular, financial institutions might reasonably be expected to have followed some well-known FX trading strategies which ought then be able to explain their flows. Similarly, as outlined above, all customer types ought to be reacting to or even anticipating key macroeconomic developments and with the hindsight of econometricians we test whether real-time developments in macro variables can explain flows. Third, and central to the hypotheses outlined above, we test whether the dealers who privately observe their customers’ order flows and the dealer community that aggregates these flows can learn enough from them to price macroeconomic developments before they are publicly announced.
3.1Preliminaries
12
2005). Other papers have used flows from smaller European banks (Osler et al., 2010 Bjonnes et al., 2005). Our data are from RBS, at the time a leading player in FX markets with a global footprint. These data have been used in analyses of foreign exchange
intervention (Marsh, 2011) and to consider the information content of order flow (Marsh and O’Rourke, 2005).
< Table 2 here >
< Order flow and contemporaneous exchange rate changes >
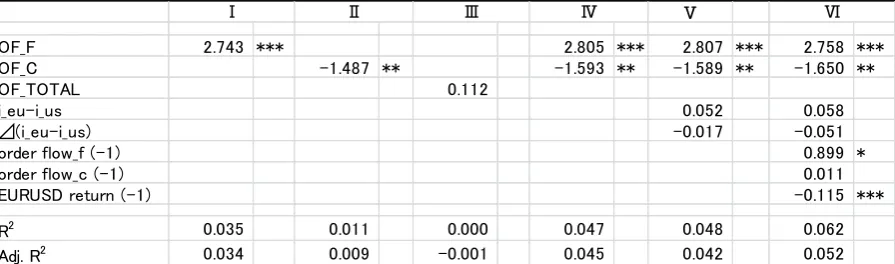
In Table 2 we establish that one of the key relationships in FX microstructure holds for this data. We note, in line with the literature, that there are significant contemporaneous
correlations between order flow and exchange rate changes but that these correlations bear different signs. Flows from profit-maximising financial institutions are positively correlated with exchange rate changes, such that net buying pressure on the euro from financials coincides with an appreciation of the euro, while the correlation between corporate customer order flows and the exchange rate is negative. These correlations are very similar
irrespective of whether the flows are included in the regression one at a time or all together. They are also unaffected by the inclusion of other explanatory variables such as interest rates or other asset returns. Proponents of the microstructure approach contend that these
correlations result from the information content of flows, although this contention is largely driven by theoretical modelling and few papers have analysed the driving forces behind customer order flows. We turn to this issue in subsection 3.3.
3.2Does news matter for exchange rates?
In this section we establish that one of the key puzzles in international finance also hold for our data set. The exchange rate disconnect puzzle concerns the lack of relations between exchange rate changes and fundamentals (however defined) over short to medium horizons. A corollary of that puzzle is the news puzzle – exchange rates often do not react much to data releases concerning major macroeconomic fundamentals, even if there are relatively large surprise components to the announcement.
13
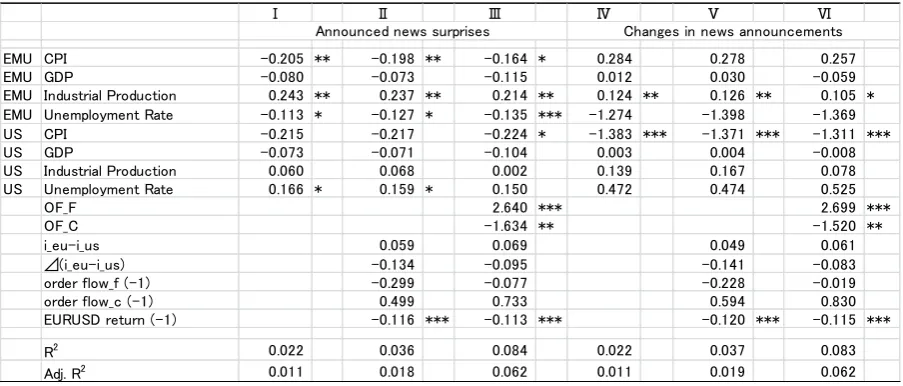
< Exchange rate changes and news >
Table 3 reports results from regressing exchange rate changes on news announcements. We use both the actual announcement, usually in terms of percentage change, and the surprise component of the announcement as discussed above. The key findings are that (i) some news announcements are statistically significant but (ii) news announcements do not explain much of the variation in exchange rates. Negative autocorrelation in exchange rate returns is quite significant but developments in interest rate differentials have no explanatory power. Columns III and VI indicate that order flows are significantly contemporaneously correlated with exchange rate changes after the addition of extra explanatory variables.
3.3Determinants of order flow
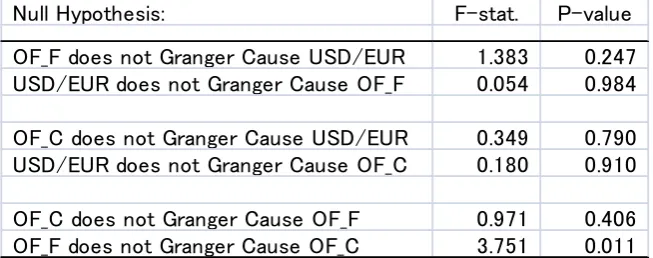
Order flows are strongly correlated with contemporaneous exchange rate changes and, given their position on the right hand side of most regressions in the microstructure literature, the usual view is that flows are causal for exchange rates. In passing, we note that there is no evidence of Granger causality in either direction between flows and exchange rates for our dataset, although interestingly there is evidence that corporate customer order flows react to lagged financial customer order flows consistent with the liquidity provision hypothesis of Bjonnes et al. (2005) (see Table 4).
< Table 4 here > < Granger Causality >
14
The literature on foreign exchange determination has recently taken on a new life once it was realised that certain trading strategies appear to provide considerable profits, possibly also once these profits are risk adjusted. The carry trade has been dominant among these strategies with momentum trading following in rather distant second place. The portfolio approach to carry trading suggests investing in a portfolio of n currencies offering the highest yield, and funding this portfolio by borrowing the m currencies with the lowest yield from a restricted universe of all tradable currencies. On a portfolio basis, neither the dollar nor the euro would have been much used as part of the carry trade during our sample period as their interest rates were usually fairly average and so not in either extreme portfolio. However many investment houses instead traded several bilateral currency pairs, going long the higher yielding currency, to maximise the diversification impacts of carry trading and it is
conceivable that some euro-dollar flows might have been affected by this version of the carry trade. To this end we include both the interest rate differential and the change in the differential as potential determinants of (financial customer) order flows. Similarly, we include lagged exchange rate changes as a proxy for the drivers of momentum trading. Most momentum trading in foreign exchange markets seems to be of the trend-following variety, so we would expect a positive correlation between lagged currency appreciations and inflows into that currency.
Although our unconditional autocorrelation tests in Table 1 did not suggest a role for own lagged order flow, we include lags now as Bjonnes et al. (2005) suggest that corporate customers provide liquidity to financial customers, implying that there may be a lead-lag relationship between flows from different customer groups. As noted, this is supported by the Granger causality results reported in Table 4.
Since financial customer order flow includes unleveraged institutions such as mutual funds, it is likely that FX flows from some customers is driven not by exchange rate factors but by expected or realised developments in underlying assets. Interest rates are already included in the regression so we also add changes in the S&P500 and EuroStoxx stock indices to capture equity market developments.
15
announcement. However, a corporate customer might respond to macro news to the extent that it provides information on the development of the wider economy that is relevant to the firm (for example, by allowing more accurate predictions of the future state of the economy than could be made through an analysis of information directly observed by the firm itself). It is less contentious that financial flows might react to new information releases, again because the investment positioning of the firm is based on noisy signals and a data release may necessitate a repositioning.
< Table 5 here >
< Order flow determinants – news >
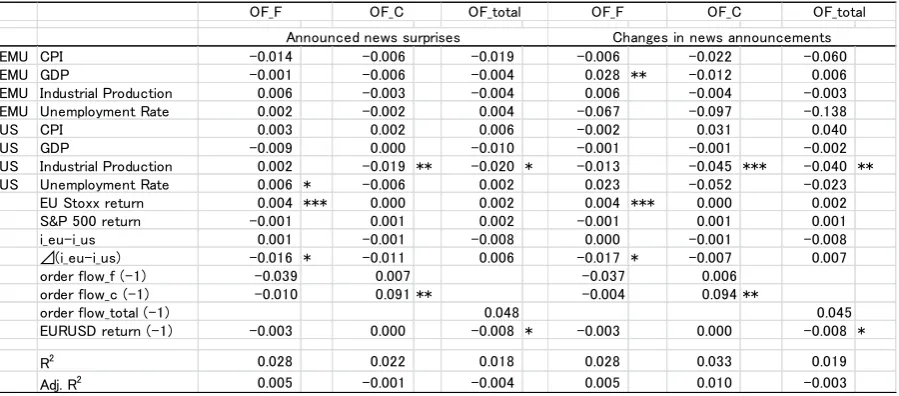
Table 5 contains the results of sets of regressions aimed at explaining order flows. It is fair to say that these results are disappointing. While some variables are occasionally significant, the overall fit of the regressions is very poor. In particular, the announcement variables are largely insignificant and provide very poor fit. We find very similar results if the announced change in the macroeconomic variables is used instead of simply the surprise component. Similarly, our ability to explain financial customer order flows is unchanged if we expand the number of announcements included in the regression. This expansion of the number of announcement examined does increase the adjusted R2 figure for corporate flows to 3.2% but most of the significant coefficients on news announcements bear the “wrong” sign,
suggesting that corporate customers buy the euro on bad news for the euro economy or good news for the US economy. This rather odd behaviour is also found in King et al. (2010) when analysing the impact of flows in the Canadian Dollar. We noted above that exchange rates do not react much to news announcements and the microstructure parallel of this is that order flows do not seem to react much either (or at least does so in an inconsistent way). There is some evidence that stock market returns and changes in interest rate differentials matter for financial customer order flows. The significant coefficient on lagged financial flows in the corporate flows regression also supports the notion that corporate supply liquidity for financials – in the words of Sager and Taylor (2006), financials are push
16
As outlined above, one of the key hypotheses in this paper is that customer order flow is responding in real time to macroeconomic developments. Corporate clients are not, in the main, trading foreign exchange for profit but instead as a by-product of their corporate activities. The evolution of the real economy is then potentially a major force behind flows from corporate customers. As the markets in which they operate develop we might expect they will trade in foreign exchange markets. Similarly, financial customers are continually updating their assessments of the economy and taking positions accordingly. Hence we would also expect their flows to be reacting to real-time economic developments. This simple concept lies behind the dispersed information approach of micro FX. As individual companies trade based on the evolution of their own microeconomies, order flow through the foreign exchange market aggregates the microeconomic information into something
approximating a macroeconomic signal for the dealers observing the flow.
Given the poor performance of our other explanations of order flow, we now concentrate on whether flows react contemporaneously to macroeconomic developments. We run
regressions at a monthly frequency for most macroeconomic variables, but use a quarterly frequency for GDP series. We regress order flow on contemporaneous changes in macro fundamentals as in equation (1) above.
< Table 6 here >
< Order flow and current fundamentals >
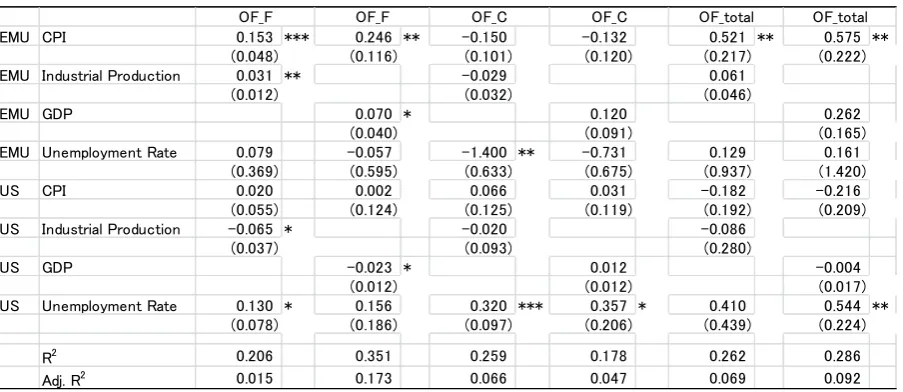
These results are marginally more encouraging. Although the goodness of fit measures are still quite low there is frequent statistical significance and most of the coefficient values take the expected signs. For financial customers, increases in European inflation, industrial production and GDP growth, increases in the U.S unemployment rate, and decreases in U.S. industrial production all result in contemporaneous flows into the euro. Flows of corporate customers appear to be driven by unemployment rates – increases in U.S. unemployment and decreases in European unemployment resulting in contemporaneous inflows for the euro.
17
Table 6 suggests that order flows of our bank’s customers are responding in real time to macroeconomic developments. These order flows are private signals of the evolution of the macroeconomy seen by bank dealers. In this section we ask first whether the dealers can extract this information from this set of private signals, and second whether the extracted information is priced into the exchange rate.
We begin by reversing the above analysis and regress economic developments on order flows as in equation (2) above. Significant coefficients in this regression would suggest that a dealer observing these (private) customer order flows could make inference about contemporaneous developments in the economy. Results are presented in Table 7.
< Table 7 here >
< Order flow and fundamentals >
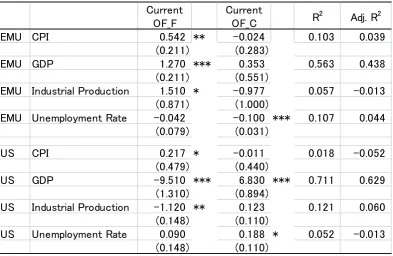
These findings are encouraging. Order flow from financial customers is significantly correlated with contemporaneous macroeconomic developments six of the eight variables analysed. Coefficient signs are generally as expected, with the exception of euro area CPI. Interestingly, and mirroring the results of Table 6, while financial customer order flows appear to contain little information that could be extracted regarding unemployment rates in either the U.S. or Euro area, corporate flows are significantly correlated with changes unemployment.
Goodness of fit measures are very high for the quarterly GDP series but we have relatively few observations in our sample. Regressions for the monthly series display less explanatory power but considering the very small information set these forecasts are being made upon the performance is not unreasonable.
In unreported results we also included order flow from the month before t0 to test whether
18
Finally, we turn to perhaps the key results in the paper. Our point of departure was that news announcements have little impact on exchange rates (or, it emerges, on order flows). We hypothesised that this might be because exchange rates had already responded to economic developments in real-time since flows contain strong enough signals to dealers that they can infer the evolution of the key macro variables. Table 7 suggests that there is information content in the flows and now we test whether exchange rates react to these signals.
< Tale 8 here > < Pricing of fundamentals >
Following Evans (2010) we adopt a two stage procedure to test whether inferred
fundamentals are priced using regression (3) above. The two stage strategy is necessary because the explanatory variables in equation (3) are themselves estimated and so there is potentially an errors-in-variables problem. Our estimation strategy is as follows. In the first stage regression, the change in macro fundamental variable is regressed on contemporaneous order flows by financial institutions and corporations to obtain the estimated value of the macro fundamental (equivalent to the regressions reported in the first row for each variable in Table 7). The second regression uses the estimate as an instrumental variable to estimate the impact of the fundamental variable on daily exchange rate change.
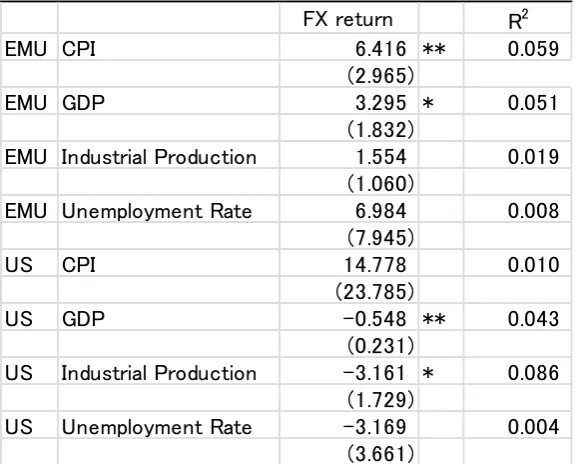
Four of our eight key macroeconomic variables appear to be contemporaneously priced into exchange rates. For three of these variables – Euro CPI and GDP and US industrial
production – all of the pricing is derived from financial customer order flows. The fourth variable – US GDP – prices information in both corporate and financial order flows. Interestingly, while corporates appear to produce flows that are correlated with
19
information. However, by ignoring flows from corporate customers, dealers are perhaps missing out on some relevant information.
The variables not contemporaneously priced into exchange rates are exactly the ones which have large announcement effects. Column III of Table 3 indicates that the surprise
components of Euro industrial production and unemployment rate affect exchange rates most significantly on the day of announcement, while column VI suggests that changes in US CPI have significant announcement effects. None of these three are contemporaneously priced according to Table 8.
4 Summary and Conclusions
This paper is motivated by two robust empirical observations. First, there is a disconnect between fundamentals and exchange rates insofar as very little of the variation in exchange rates can be explained by announcements about key macroeconomic developments. Second, there are strong links between order flows from end-users in the foreign exchange market and spot exchange rates. The microstructure approach to exchange rates suggests that the
customer order flows contain information about current and expected future developments in the macroeconomies, and that this information is extracted and priced into exchange rates through the trading mechanism.
Our paper tests this hypothesis, demonstrating that there is a contemporaneous correlation between the real-time evolution of major macroeconomic variables and customer order flows as seen by a major European commercial bank. Further, this information can be extracted by the dealer to derive real-time information on macro developments. Finally, this information is rapidly priced into spot exchange rates. The lack of response of exchange rates to the subsequent announcement of these macroeconomic developments is because the cat is already out of the bag. The market has learned of many of these economic developments, at least partially because of customer order flows, and has priced them accordingly.
20 Appendix
17 Scheduled Macro Announcements (EMU 7, US 10)
Title Frequency Source Units
EMU CPI Monthly ECB % change mom
EMU Consumer Confidence Monthly EU
Commission
Index
EMU GDP (seasonal adjusted) Quarterly ECB % change qoq EMU Industrial Production Monthly ECB % change mom EMU M3 (seasonal adjusted) Monthly ECB % change mom
EMU PPI Monthly ECB % change mom
EMU Unemployment Rate Monthly ECB % rate
US Change in Manufact. Payrolls Monthly BLS Change in thousands US Change in Nonfarm Payrolls Monthly BLS Change in thousands
US CPI Monthly BLS % change mom
US GDP Quarterly BEA % change qoq
US Housing Starts Monthly Census Millions
US Industrial Production Monthly FRB % change mom US Retail Sales Less Autos Monthly Census % change mom
US Trade Balance Monthly BEA $ billion
US U. of Michigan Confidence Twice a Month
Univ. of Michigan
Index
21 References
Andersen, T. G., Bollerslev, T., Diebold, F., Vega, C., 2003. Micro effects of macro announcements: real-time price discovery in foreign exchange. American Economic
Review 391, 38-62.
Bjonnes, G. H., Rime, D., Solheim, H., 2005. Liquidity provision in the overnight foreign exchange market. Journal of International Money and Finance 24, 175-196.
Cheung, Y.-W., Chinn, M. D., Marsh, I.W., 2004. How do UK-based foreign exchange dealers think their market operations? International Journal of Finance and Economics
9(4), 289-306.
Dominguez, K., Panthaki, F., 2006. What defines ‘news’ in foreign exchange markets?
Journal of International Money and Finance 25, 168-198.
Engel, C., Mark, N., West, K., 2007. Exchange rate models are not as bad as you think. NBER Macroeconomics Annual 2007, 381-441.
Engel, C., West, K., 2005. Exchange rates and fundamentals. Journal of Political Economy 3, 485-517.
Engel, C., West, K., 2006. Taylor rules and the Deutschmark-Dollar real exchange rate.
Journal of Money, Credit and Banking 5, 1175-1194.
Evans, M., 2010. Order flows and the exchange rate disconnect puzzle. Journal of
International Economics 80, 58-71.
Evans, M., Lyons, R., 2002. Order flow and exchange rate dynamics. Journal of Political
Economy 110 (1), 170-180.
Evans, M., Lyons, R., 2004. A new micro model of exchange rate dynamics. Working Paper 10379. In National Bureau of Economic Research. June.
Evans, M., Lyons, R., 2005. Meese-Rogoff redux: micro-based exchange-rate forecasting.
American Economic Review 95 (2), 405-413.
Evans, M., Lyons, R., 2007. Exchange rate fundamentals and order flow. Working Paper 13151. In National Bureau of Economic Research. June.
Ehrmann, M., Fratzscher, M, 2005. Exchange rates and fundamentals: new evidence from real-time data. Journal of International Money and Finance 24, 317-341.
King, M., Lucio, S., Sojli, E., 2010. Timing exchange rates using order flow: the case of the Loonie. Journal of Banking and Finance 34 (12), 2917-2928.
Marsh, I.W., 2011. Order flow and central bank interventions: an empirical analysis of recent Bank of Japan actions in the foreign exchange market. Journal of International Money
22
Marsh, I.W., O’Rouke, C., 2005. Customer order flows and exchange rate movements: is there really informational content? Cass Business School Working Paper.
Meese, R. A., Rogoff, K., 1983. Empirical exchange rate models of the seventies: do they fit our of sample? Journal of International Economics 14, 3-24.
Obstfeld, M., Rogoff, K., 2000. The six major puzzles in international macroeconomics: is there a common cause? NBER Macroeconomics Annual 2000, 339-390.
Osler, C., Mende, A., Menkhoff, L., 2010. Price discovery in currency markets. Journal of
International Money and Finance 30 (8), 1696-1718.
Sager, M., Talyor, M.P., 2006. Under the microscope: The structure of the foreign exchange market. International Journal of Finance and Economics 11, 81-95.
23 Table 1. Basic Statistics
This table presents basic statistics for the daily USD/EUR return, financial customer order flow (OF_F),
corporate customer order flow (OF_C), total customer order flow (OF_Total) and the overnight interest
differential expressed as the difference between Euro and US annualized interest rates. Panel A shows the
descriptive statistics and Panel B presents the correlations for the variables. Mean, maximum, minimum, and
standard deviations of exchange returns are presented in percentage points. Order flow shows net buying of
EUR in USD by each trader group. JB-Prob is the P-value for the null hypothesis of the Jarque-Bera test for
normality. AR(1)-Prob is the P-value for the null hypothesis that the first-order autocorrelation is zero. ADF is
the Augmented Dickey-Fuller test statistic with a null of non-stationarity. The sample period is
10/1/2001-6/29/2004, or 658 daily observations.
Panel A. Descriptive statistics
FX return OF_F OF_C OF_TOTAL i_eu-i_us ⊿(i_eu-i_us)
Mean 0.04 0.00 0.00 0.00 1.30 0.00
Maximum 1.92 0.30 0.19 0.42 2.43 0.84
Minimum -2.02 -0.27 -0.21 -0.33 0.29 -0.97
Std. Dev. 0.64 0.04 0.04 0.08 0.31 0.13
Skewness -0.15 -0.06 0.04 -0.02 0.33 0.32
Kurtosis 3.44 12.82 6.26 6.47 3.16 17.16
JB-Prob 0.01 0.00 0.00 0.00 0.00 0.00
AR(1) -0.11 -0.01 -0.01 0.02 0.90 -0.14
AR(1)-Prob 0.00 0.72 0.81 0.59 0.00 0.00
ADF -29.69 -25.45 -25.42 -24.34 -6.65 -20.05
Panel B. Correlations
FX return 1.00
OF_F 0.19 1.00
OF_C -0.10 0.04 1.00
OF_TOTAL 0.01 0.50 0.48 1.00
i_eu-i_us 0.02 -0.01 -0.02 -0.03 1.00
24 Table 2. Order Flow and Exchange Rates
This table reports the results of regressing daily changes in the USD/EUR exchange rate on order flows and
other potential explanatory variables. The coefficient on order flows shows the percentage change in exchange
rates for a net purchases of EUR by one USD by financial, corporate and total customers. Although not
presented, standard errors are estimated using an autocorrelation and heteroskedasticity consistent matrix of
residuals. ***, **, and * denote significance at the 1%, 5%, and 10%, respectively. The sample period is
10/1/2001-6/29/2004.
Ⅴ
OF_F 2.743 *** 2.805 *** 2.807 *** 2.758 ***
OF_C -1.487 ** -1.593 ** -1.589 ** -1.650 **
OF_TOTAL 0.112
i_eu-i_us 0.052 0.058
⊿(i_eu-i_us) -0.017 -0.051
order flow_f (-1) 0.899 *
order flow_c (-1) 0.011
EURUSD return (-1) -0.115 ***
R2 0.035 0.011 0.000 0.047 0.048 0.062
Adj. R2 0.034 0.009 -0.001 0.045 0.042 0.052
25 Table 3. Exchange Rates and News
This table reports the results of regressing the daily change in exchange rates on macroeconomic news announcements and other explanatory variables. In columns I-III the surprise element of the news
announcement is included in the regression, while in columns IV-VI the announced change in the variable is included. Although not presented, standard errors are estimated using an autocorrelation and heteroskedasticity consistent matrix of residuals. ***, **, and * denote significance at the 1%, 5%, and 10%, respectively. The sample period is 10/1/2001-6/29/2004.
Ⅰ Ⅱ Ⅲ Ⅳ Ⅴ Ⅵ
EMU CPI -0.205 ** -0.198 ** -0.164 * 0.284 0.278 0.257
EMU GDP -0.080 -0.073 -0.115 0.012 0.030 -0.059
EMU Industrial Production 0.243 ** 0.237 ** 0.214 ** 0.124 ** 0.126 ** 0.105 *
EMU Unemployment Rate -0.113 * -0.127 * -0.135 *** -1.274 -1.398 -1.369
US CPI -0.215 -0.217 -0.224 * -1.383 *** -1.371 *** -1.311 ***
US GDP -0.073 -0.071 -0.104 0.003 0.004 -0.008
US Industrial Production 0.060 0.068 0.002 0.139 0.167 0.078
US Unemployment Rate 0.166 * 0.159 * 0.150 0.472 0.474 0.525
OF_F 2.640 *** 2.699 ***
OF_C -1.634 ** -1.520 **
i_eu-i_us 0.059 0.069 0.049 0.061
⊿(i_eu-i_us) -0.134 -0.095 -0.141 -0.083
order flow_f (-1) -0.299 -0.077 -0.228 -0.019
order flow_c (-1) 0.499 0.733 0.594 0.830
EURUSD return (-1) -0.116 *** -0.113 *** -0.120 *** -0.115 ***
R2 0.022 0.036 0.084 0.022 0.037 0.083
Adj. R2 0.011 0.018 0.062 0.011 0.019 0.062
26 Table 4. Granger Causality
The table displays the results of Granger Causality tests among exchange rate return (USD/EUR), financial customer order flow (OF_F) and corporate customer order flows (OF_C). The number of lags is determined to be three by Schwartz Information criteria. The sample period is 10/1/2001-6/29/2004.
Null Hypothesis: F-stat. P-value
OF_F does not Granger Cause USD/EUR 1.383 0.247
USD/EUR does not Granger Cause OF_F 0.054 0.984
OF_C does not Granger Cause USD/EUR 0.349 0.790
USD/EUR does not Granger Cause OF_C 0.180 0.910
OF_C does not Granger Cause OF_F 0.971 0.406
27
Table 5. Order Flow Determinants: Announced News Surprises
This table presents the explanatory power of macroeconomic news and other macro variables for the daily order flows for the sample period 10/1/2001-6/29/2004. Order flows by financial institutions (OF_F), that by
corporations (OF_C), and total order flow (OF_total) are considered. Although not presented, standard errors are estimated using an autocorrelation and heteroskedasticity consistent matrix of residuals. ***, **, and * denote significance at the 1%, 5%, and 10%, respectively.
EMU CPI -0.014 -0.006 -0.019 -0.006 -0.022 -0.060
EMU GDP -0.001 -0.006 -0.004 0.028 ** -0.012 0.006
EMU Industrial Production 0.006 -0.003 -0.004 0.006 -0.004 -0.003
EMU Unemployment Rate 0.002 -0.002 0.004 -0.067 -0.097 -0.138
US CPI 0.003 0.002 0.006 -0.002 0.031 0.040
US GDP -0.009 0.000 -0.010 -0.001 -0.001 -0.002
US Industrial Production 0.002 -0.019 ** -0.020 * -0.013 -0.045 *** -0.040 **
US Unemployment Rate 0.006 * -0.006 0.002 0.023 -0.052 -0.023
EU Stoxx return 0.004 *** 0.000 0.002 0.004 *** 0.000 0.002
S&P 500 return -0.001 0.001 0.002 -0.001 0.001 0.001
i_eu-i_us 0.001 -0.001 -0.008 0.000 -0.001 -0.008
⊿(i_eu-i_us) -0.016 * -0.011 0.006 -0.017 * -0.007 0.007
order flow_f (-1) -0.039 0.007 -0.037 0.006
order flow_c (-1) -0.010 0.091 ** -0.004 0.094 **
order flow_total (-1) 0.048 0.045
EURUSD return (-1) -0.003 0.000 -0.008 * -0.003 0.000 -0.008 *
R2 0.028 0.022 0.018 0.028 0.033 0.019
Adj. R2 0.005 -0.001 -0.004 0.005 0.010 -0.003
Announced news surprises Changes in news announcements
28
Table 6. Order Flow Reactions to Current Macro Fundamentals
This table present the explanatory power of changes in macro variables for one-month cumulative order flow for the sample period 10/1/2001-6/29/2004. Explanatory power is examined using the order flow by financial institutions (OF_F), corporations (OF_C), and total order flow (OF_Total). Flows are cumulative through the period corresponding to the measured change for each macro variable. Standard errors are estimated using an autocorrelation and heteroskedasticity consistent matrix of residuals. ***, **, and * denote significance at the 1%, 5%, and 10%, respectively.
EMU CPI 0.153 *** 0.246 ** -0.150 -0.132 0.521 ** 0.575 **
(0.048) (0.116) (0.101) (0.120) (0.217) (0.222)
EMU Industrial Production 0.031 ** -0.029 0.061
(0.012) (0.032) (0.046)
EMU GDP 0.070 * 0.120 0.262
(0.040) (0.091) (0.165)
EMU Unemployment Rate 0.079 -0.057 -1.400 ** -0.731 0.129 0.161
(0.369) (0.595) (0.633) (0.675) (0.937) (1.420)
US CPI 0.020 0.002 0.066 0.031 -0.182 -0.216
(0.055) (0.124) (0.125) (0.119) (0.192) (0.209)
US Industrial Production -0.065 * -0.020 -0.086
(0.037) (0.093) (0.280)
US GDP -0.023 * 0.012 -0.004
(0.012) (0.012) (0.017)
US Unemployment Rate 0.130 * 0.156 0.320 *** 0.357 * 0.410 0.544 **
(0.078) (0.186) (0.097) (0.206) (0.439) (0.224)
R2 0.206 0.351 0.259 0.178 0.262 0.286
Adj. R2 0.015 0.173 0.066 0.047 0.069 0.092
OF_total
29
Table 7. Extracting Macroeconomic Information from Order Flows
This table presents the results of regressing changes in each economic variable on contemporaneous cumulated order flows from financial institutions (OF_F) and corporate (OF_C). Standard errors are estimated using an autocorrelation and heteroskedasticity consistent matrix of residuals. ***, **, and * denote significance at the 1%, 5%, and 10%, respectively.
Current OF_F
Current
OF_C R
2 Adj. R2
EMU CPI 0.542 ** -0.024 0.103 0.039
(0.211) (0.283)
EMU GDP 1.270 *** 0.353 0.563 0.438
(0.211) (0.551)
EMU Industrial Production 1.510 * -0.977 0.057 -0.013
(0.871) (1.000)
EMU Unemployment Rate -0.042 -0.100 *** 0.107 0.044
(0.079) (0.031)
US CPI 0.217 * -0.011 0.018 -0.052
(0.479) (0.440)
US GDP -9.510 *** 6.830 *** 0.711 0.629
(1.310) (0.894)
US Industrial Production -1.120 ** 0.123 0.121 0.060
(0.148) (0.110)
US Unemployment Rate 0.090 0.188 * 0.052 -0.013
30 Table 8. Pricing of Macro Fundamentals
This table presents the results of the regressions exploring whether pre-announced macro fundamentals are priced following the estimation strategy by Evans (2010). In the first stage regression, the change in macro fundamental variable is regressed on contemporaneous order flows by financial institutions and corporations to obtain the estimated value of the macro fundamental (as reported in Table 7). The second regression reported here uses the estimate as an instrumental variable to estimate the impact of the fundamental variable on daily exchange rate change. The standard errors are corrected for heteroskedasticity and autocorrelation using an MA error process. ***, **, and * denote significance at the 1%, 5%, and 10%, respectively.
FX return R2
EMU CPI 6.416 ** 0.059
(2.965)
EMU GDP 3.295 * 0.051
(1.832)
EMU Industrial Production 1.554 0.019
(1.060)
EMU Unemployment Rate 6.984 0.008
(7.945)
US CPI 14.778 0.010
(23.785)
US GDP -0.548 ** 0.043
(0.231)
US Industrial Production -3.161 * 0.086
(1.729)
US Unemployment Rate -3.169 0.004