Evaluating the Performance of Bay Irrigation in the GMID
R.J. Smith1, M.H. Gillies1, M. Shanahan2, B. Campbell3 and B. Williamson4
1
National Centre for Engineering in Agriculture and CRC for Irrigation Futures, University of Southern Queensland
2
RM Consulting Group, Bendigo
3 Price Merrett Consulting, Kerang 4 CRC for Irrigation Futures, Dubbo
Corresponding Author: [email protected]
ABSTRACT
The CRC for Irrigation Futures recently undertook a project piloting use of the IrriMATETM performance evaluation process in bay irrigation at a number of sites across the Goulburn Murray Irrigation District (GMID). This evaluation technique, which was developed originally for furrow irrigation, is now well accepted in the cotton industry.
The project successfully demonstrated that evaluation of performance can lead to substantial realisable gains in efficiency for bay irrigation, including the ‘good’ irrigators. For the irrigations evaluated, application efficiencies averaged 72% and realisable gains in efficiency of 19% are possible with changed management. For most farmers this will mean application of higher flow rates and shorter irrigation times. Practically this means on-farm automation.
The evaluation process provides the means to determine the preferred flow rate and irrigation time for automated systems and also the means for identifying optimum capacities for farm outlets. This latter data is of interest to scheme modernisation design, because flow rates available to irrigators through their meter outlets are often less than required for maximum performance on farm.
The project identified some deficiencies in the evaluation process caused by differences in the management of bays compared to furrows, deficiencies which have now been overcome in the development of new evaluation tools.
INTRODUCTION
Monitoring and evaluation of bay irrigation practices in Southern Australia is not new. It has been used for a variety of purposes over many years, for example, to evaluate surface irrigation simulation models (Maheshwari & McMahon 1993 a & b; Austin & Prendergast, 1997), for the estimation of soil infiltration characteristics (Maheshwari and Jayawardane, 1992; Hume, 1993), for the comparison of alternative (surge flow) systems (Turral and Malano, 1996), and to study the water balance of irrigated fields (Gilfedder et al, 2000).
In no case did the work lead to an assessment of the performance in efficiency terms of bay irrigation or of the opportunities for improvement of performance. This contrasts directly with the experience in the cotton and sugar industries where the focus of evaluations has always been on performance improvement (for example, Raine et al., 1997; Dalton et al. 2001).
In the late 1990’s, irrigation application efficiencies varied widely from 17 to 100% with an average of 48% (Smith et al, 2005). Deep percolation (drainage) losses for Queensland cotton fields averaged 42.5 mm per irrigation, representing an annual loss of up to 2.5 ML/ha /season. BDA Group (2007) estimated that the application of IrriMATETM in the cotton industry has so far saved 400 GL over a 16 year period or 28.5 GL/annum and has contributed to industry improvement in WUE of 10%, with anticipation of another 10% improvement in WUE by 2014.
In the present study, field trials were conducted using the IrriMATETM system at a limited number of sites with the objective to demonstrate the application of surface irrigation evaluation to bay irrigated pasture and to indentify the potential gains in irrigation performance. Although the sample of sites was small they provide an indication of the level of performance across the GMID and the opportunity for substantial water savings through changed practice on-farm.
EVALUATION METHODOLOGY Overview
The IrriMATETM evaluation system is both a set of measurement and simulation tools, and a process that involves:
• Monitoring of an irrigation event(s);
• Inverse solution from the measured irrigation advance and other data to give infiltration and surface resistance parameters prevailing during the measured irrigation;
• Simulation of the measured irrigation as a means of calibrating the simulation model and calculating the performance parameters for the measured irrigation; and
• The conduct of ‘what if’ simulations to determine the flow rate and time to cut-off to give the best or preferred irrigation performance.
Field Sites
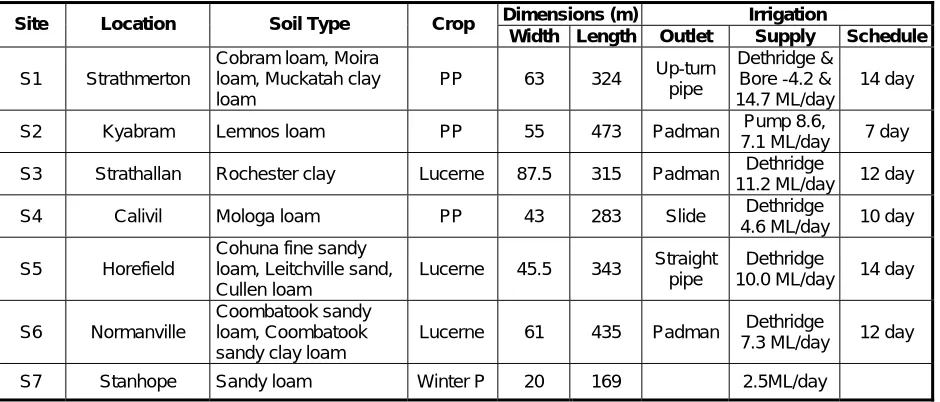
[image:2.612.74.544.503.704.2]A total of seven sites were selected at short notice by cold calling potential collaborators. A geographic spread was intentional, in an attempt to cover a broad range of soil types and configurations (Table 1). Some discrimination on pasture type was also made, with a preference for permanent pasture. If anything, the sites were biased toward the more efficient irrigators, because only those better irrigators had sufficient water remaining to be able to irrigate during the study period.
Table 1 Site details for irrigation evaluations
Dimensions (m) Irrigation Site Location Soil Type Crop
Width Length Outlet Supply Schedule
S1 Strathmerton
Cobram loam, Moira loam, Muckatah clay loam
PP 63 324 Up-turn
pipe
Dethridge & Bore -4.2 & 14.7 ML/day
14 day
S2 Kyabram Lemnos loam PP 55 473 Padman Pump 8.6,
7.1 ML/day 7 day
S3 Strathallan Rochester clay Lucerne 87.5 315 Padman Dethridge
11.2 ML/day 12 day
S4 Calivil Mologa loam PP 43 283 Slide Dethridge
4.6 ML/day 10 day
S5 Horefield
Cohuna fine sandy loam, Leitchville sand, Cullen loam
Lucerne 45.5 343 Straight
pipe
Dethridge
10.0 ML/day 14 day
S6 Normanville
Coombatook sandy loam, Coombatook sandy clay loam
Lucerne 61 435 Padman Dethridge
7.3 ML/day 12 day
Field Procedure
Details of each site were collected including bay width and length, longitudinal slope (capturing any changes in grade) and bay supply configuration. Typical slope was 1:750. Data collected for each event included:
• the inflow hydrograph; and
• the irrigation advance (advance times for various points along the bay including the time for the advance to reach the end of the bay).
The flow rate and irrigation advance were measured using the IrriMATEP
TM
P
[image:3.612.164.449.298.512.2]suite of tools developed by the National Centre for Irrigation in Agriculture (NCEA), as described by Dalton et al. (2001). The inflow into the bay was measured using a large throated custom designed flume (Figure 1) with capacity up to 15 ML /day. The instrumentation monitors depth through the flume continuously throughout the irrigation event to record both the total inflow volume and the full inflow hydrograph. Water advance was measured using electronic contact sensors positioned at six points along the length of the bay. Each sensor consists of eight pairs of wire contacts connected to separate timers spread transversely across the bay in an attempt to overcome spatial variability of advance rates.
Figure 1 Measurement of inflow into the bay (Photo courtesy of Phil Price)
In order to provide meaningful efficiency values the evaluation process also requires reliable estimates of the soil moisture deficit prior to the irrigation event, and this becomes the target depth of application. In this study the soil moisture deficit was estimated from ET (either pan evaporation or Silo ETBOB) and estimated pan and crop factors as appropriate. In most cases the deficits were higher than would usually be the case because of the current water shortage.
Analysis and Simulation
The time dependent soil infiltration characteristic is defined using the three parameter modified Kostiakov equation, one of the most commonly used empirical functions for surface irrigation. The depth of infiltration, Z (mP
3
P
/mP
2
P
) due to water present on the soil surface for time τ (min) is given by:
τ
τ
oa
f k
where a and k are empirical parameters and fBoB (m/min) is the final or steady intake rate of the soil. The parameters of the infiltration function and the hydraulic resistance to flow (Manning n) provided by the pasture are typically evaluated using an inverse solution of the volume balance model as defined and validated by McClymont and Smith (1995), Gillies and Smith (2005) and Gillies et al. (2007). The parameters are identified as those that cause the simple volume balance model to best reproduce field measurements of advance (and runoff if available).
The inverse volume balance approach works well for furrow irrigation however there were several cases where it failed to successfully estimate the parameters in this project. These difficulties arise primarily because the volume balance method is only valid with data collected prior to cut-off of the inflow. This limitation is compounded in the case of bay irrigation by the relative importance of the surface roughness, the large volume of temporary storage on the surface of the bay, and the short irrigation times compared to furrow irrigation. In these cases an alternative inverse solution of the more robust full hydrodynamic model was employed. This latter model, Sisco, currently being developed at USQ based on the earlier work of McClymont et al. (1999), allows estimation of the roughness and infiltration parameters using measurements collected after the inflow cut-off time.
Once the relevant parameters have been determined, the IrriMATEP
TM
P
process employs the surface irrigation simulation model SIRMOD (Walker, 1999) to replicate the measured irrigation and to quantify the performance of that irrigation. SIRMOD is a proven model (McClymont et al., 1996) that solves the full hydrodynamic equations (continuity and momentum equations) that govern unsteady free surface flow. For this study SIRMOD III was used rather than SIRMOD II because of its ability to accommodate a time varying inflow into the bay.
The key irrigation performance parameters calculated are the application and requirement efficiencies and the volumes of deep percolation and tail-water runoff. Application efficiency (EBaB) is a measure of the volumetric losses occurring during an irrigation and is defined here as:
applied
Volume
rootzone
in
stored
Volume
E
a⋅
⋅
⋅
⋅
=
(2)Under this definition, tail-water runoff is considered to be a loss to the particular irrigation even if not lost to the farm. It is acknowledged that tail-water is usually captured and recycled thus contributing to the whole farm efficiency.
Requirement (or storage) efficiency (EBsB) is an indicator of how well the irrigation meets its objective of refilling soil moisture deficit in the root zone is presented here as:
deficit
moisture
Soil
rootzone
in
stored
Volume
E
s⋅
⋅
⋅
⋅
⋅
=
(3)The value EBsB is important when either the irrigations tend to leave major portions of the field under-irrigated or where under-irrigation is purposely practiced to use precipitation as it occurs.
CASE STUDY RESULTS Example – Site 1
[image:5.612.150.462.186.359.2]This site at Strathmerton is located on a moderately permeable soil, predominately Group II with some Group III at the bottom end of the bay. Inflow rate for the first irrigation was restricted by the capacity of its unusual pipe inlet structure. Average flow rate for the trial was 4.2 ML/d but increased throughout the trial from 3 to 4.7 ML/d as shown by the full inflow hydrograph given in Figure 1. This was typical of the hydrographs for a number of the trial sites. The cause is not known and may be due to variations in the level of the supply channel or to non-steady conditions in the farm channel.
0 0.5 1 1.5 2 2.5 3 3.5 4 4.5 5
0 100 200 300 400 500 600 700 800
Time (min)
In
fl
o
w
(ML
/d
a
y
)
Figure 1 Inflow hydrograph for site 1 irrigation 1
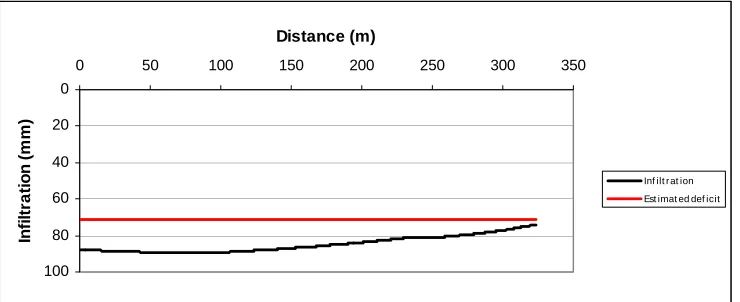
The analysis of the data from this site resulted in infiltration parameters consistent with the soil type at this site and an excellent fit between the simulated and measured advance as shown in Figure 2. To satisfy the estimated deficit of 71 mm, the infiltration characteristic suggests that water needs to be available on the surface for about 400 min. This is clearly exceeded at the upstream end of the bay and over much of its length resulting in over irrigation (Figure 3) and substantial losses to deep percolation.
0 200 400 600 800 1000 1200 1400
0 50 100 150 200 250 300 350
Time (min)
Di
st
an
ce (
m
)
predicted advance
predicted recession
[image:5.612.105.510.493.684.2]measured advance
By reducing the time to cut-off from 690 min to 600 min the application efficiency is increased from 72% to 82%. Both tail water runoff and deep percolation are reduced. Doubling the inflow rate from 4.2 to 8.4 Ml/d and further reducing the time to 260 min increases the efficiency to 90%. In this case there is no deep percolation loss and the runoff is 10%. Further increases in inflow rate deliver negligible improvements in efficiency and any further reduction in time to cut-off leads to under-irrigation, that is, the deficit is not satisfied.
0
20
40
60
80
100
0 50 100 150 200 250 300 350
Distance (m)
In
fi
lt
ra
ti
o
n
(m
m
)
[image:6.612.123.493.148.299.2]Inf ilt r at ion Est imat ed def icit
Figure 3 Depth of infiltration site 1 irrigation 1
For the second irrigation at this site the pipe structure was removed and replaced by a higher capacity Padman stop. Inflow rate for this irrigation was increased to 14.7 ML/d however application efficiency was reduced to 57% because the irrigation duration of 216 min was far too long. Reducing this time to 125 min would have given an efficiency of 95%.
Infiltration and Hydraulic Resistance Parameters
The hydraulic resistance parameter (Manning n) varied around a mode of 0.25, from a low of 0.1 for the first irrigation of the winter pasture at the Stanhope site to a high of 0.36. These values are consistent with other published data for bay irrigated pasture, for example, Robertson et al. (2004) who reported a similar variation over time at a single site.
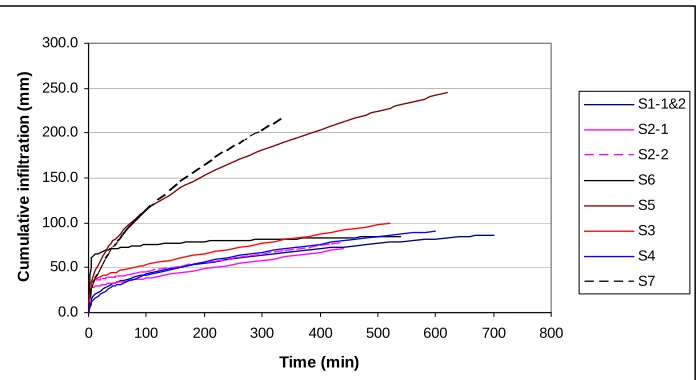
The infiltration characteristics for the trial sites are illustrated in Figure 4. Leaving aside the winter pasture site 7, three groups of soil infiltration characteristics can be identified. The first is the very permeable site 5. This site is typical of the coarser textured soils occurring on the prior stream levees that show rapid infiltration and high levels of deep drainage (Lyle and Wildes, 1996). The second group are the moderately permeable soils (sites 1 and 4) that have a characteristic with substantial curvature over the early time (0.3 < a < 0.5) and a moderate continuing rate of infiltration.
0.0 50.0 100.0 150.0 200.0 250.0 300.0
0 100 200 300 400 500 600 700 800
Time (min)
C
u
m
u
la
ti
v
e
i
n
fi
lt
ra
ti
o
n
(m
m
)
S1-1&2 S2-1 S2-2 S6 S5 S3 S4 S7
Figure 4 Infiltration curves for each of the test bays
It has also been suggested (Rendell, pers comm) that some of this rapid infiltration may in fact be water trapped in the micro-relief of the bay surface, that is, water stored there during the irrigation which infiltrates or evaporates following completion of the irrigation. Further work is required to confirm if this is so.
Efficiencies, Deep Drainage and Tail-water
[image:7.612.132.482.57.247.2]The calculated performance for each of the irrigations is presented in Table 2. These show an average application efficiency of 69% (with range 46 to 86%). Tail-water runoff was 14% (0 to 36%) and the loss to deep drainage was a similar magnitude and is equivalent to a depth of 12 mm (0 to 26 mm excluding sites 5 and 7 which had abnormally high drainage losses). Site 5 is on a highly permeable soil (sand) and only managed to achieve an application efficiency as high as 46% because of the very high deficit of 111 mm. This site is not suitable for surface irrigation. At site 7, the first irrigation of winter pasture, the soil was very dry and very permeable. With a relatively low flow rate the advance did not reach the end of the bay. A much higher flow rate would have been required to complete this irrigation. A low efficiency is typical for the first irrigation of a season and has been observed frequently in furrow as well as bay systems (Raine et al., 2005).
Table 2 Summary of results from bay evaluations
Measured
Flow Time Vol Applied Deficit Ea Es Runoff Deep Drain Site/ Test
(ML/d) (ML/d/m) (min) (ML/ha) (mm) (%) (%) (%) (mm)
S1-1 4.2 0.067 690 0.988 71 71.7 100.0 14.4 13.7
S1-2 14.7 0.234 215 1.080 62 57.2 99.3 36.0 7.3
S2-1 8.3 0.156 435 0.999 53 54.1 100.0 21.7 24.2
S2-2 7.1 0.129 443 0.841 51 63.0 100.0 6.1 26.0
S3 11.2 0.128 324 0.918 101 86.0 78.0 14.0 0.0
S4 4.6 0.108 285 0.758 65 84.9 98.5 0.0 11.3
S5 10.0 0.220 612 2.426 111 45.9 100.0 2.5 125.2
S6 7.3 0.119 529 1.007 80 79.3 100.0 14.6 6.1
S7 2.5 0.125 295 1.519 >100 54.1* 90.2 0.0 63.8
In one case (S3) the irrigation failed to fully satisfy the moisture deficit, that is, Es was much less
than 100%. The infiltration curve for this site shows an initial rapid infiltration (crack fill) of 35 to 40 mm suggesting that the deficit of 101 mm estimated for this site may be incorrect. If a lower deficit is assumed the storage efficiency will increase in proportion.
Performance Improvement
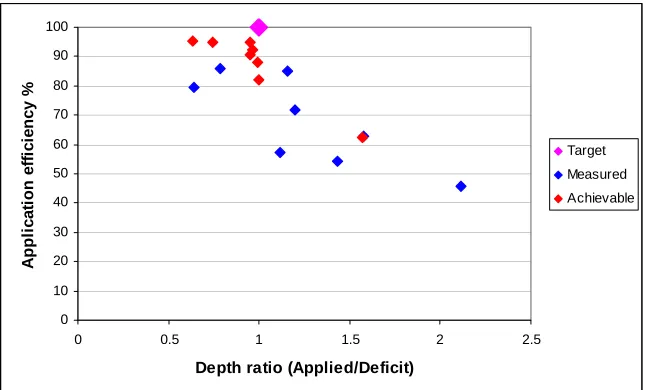
Strategies to improve the performance of surface irrigation typically involve reducing the irrigation time and/or increasing the inflow rate (for example, Smith et al. 2005). In this study the strategies and the potential gains vary across the sites however a readily realisable gain in efficiency of 19% is possible and ranges from 6 to 38% for the different sites. This is illustrated in Figure 5. In this figure, the depth ratio (depth applied to the field expressed as a ratio of the deficit) provides an indication of the adequacy of the irrigation. A ratio greater than 1 indicates over-irrigation and deep percolation loss. In all cases only those efficiency gains that could be obtained without decreasing the requirement efficiency were considered. The target for the improved irrigations is an efficiency of 100% and a depth ratio of 1, and it can be seen that in each case the result is nearer to that point. The potential gains shown in this figure typically require a doubling of the inflow rate, that is, an increase from a mean of 0.12 ML/d/m width (range 0.07 to 0.16) to 0.22 ML/d/m (0.12 to 0.32). The strategies for each site and the potential for improvement are provided in greater detail in Table 3.
0 10 20 30 40 50 60 70 80 90 100
0 0.5 1 1.5 2 2.5
Depth ratio (Applied/Deficit)
A
p
p
li
cat
io
n
ef
fi
ci
en
cy
%
[image:8.612.145.468.311.506.2]Target Measured Achievable
Figure 5 Measured and readily achievable application efficiencies
Selection of the ‘optimum’ or preferred irrigation always requires compromise. Attempts to maximise application efficiency will inevitably result in reductions in the requirement efficiency (adequacy) and uniformity of the irrigation. Further different irrigators will have different preferences in regard to minimising tail-water or deep percolation. Any recommendations will also have to take into account the irrigators willingness and ability to work with the shorter irrigation times required. In the present study, very much shorter times required for the improved irrigations will only be possible through adoption of automation.
Table 3 Simulations of the improved irrigation events.
Site/ Test Change time only Double inflow rate
Time Saving Time Flow rate Saving
(min) ML/ha (min) ML/d ML/d/m ML/ha
S1-1 570 0.172 260 8.4 0.134 0.243
S1-2 125 0.452 * *
S2-1 300 0.310 130 16.6 0.313 0.402
S2-2 400 0.082 170 14.2 0.259 0.195
S3 280 0.124 * *
S4 * 128 9.2 0.217 0.077
S5 * 240 20.0 0.440 0.523
S6 464 0.125 220 14.6 0.238 0.169
S7 * 130 5.0 0.251 0.180
* Not a valid strategy at this site
GENERIC SIMULATIONS Method
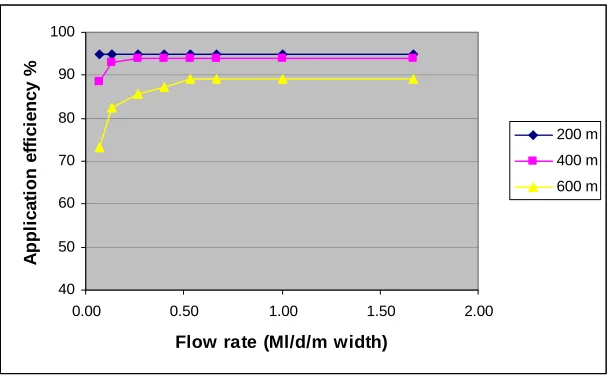
A series of simulations were carried out to investigate the relationship between application efficiency Ea and inflow rate. Standard infiltration curves were selected to represent the main
infiltration groups identified in the study, namely, the (sandy) levee soil, the moderately permeable soils, and the heavier cracking type. For each of these soils the simulations considered bay lengths of 200, 400, and 600 m. A target tail-water runoff of 5% was used to ensure that all irrigations easily reached the end of the bay.
Results
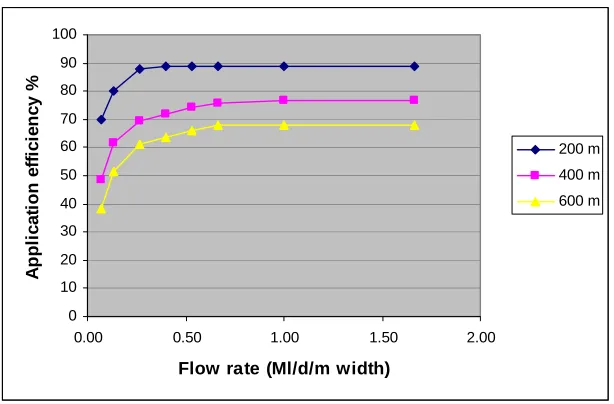
Examples of the results for two of the soils are presented in Figures 6 and 7. Clearly, the maximum efficiencies attainable and the flow rates at which they occur are influenced heavily by bay length as well as infiltration. It should also be noted that as flow rates increase the irrigation on-time required decreases rapidly and the likelihood of under-irrigation (ie, Es < 100%)
increases.
40 50 60 70 80 90 100
0.00 0.50 1.00 1.50 2.00
Flow rate (Ml/d/m width)
A
p
p
li
cati
o
n
effi
ci
en
cy
%
200 m
[image:9.612.154.460.494.683.2]400 m 600 m
0 10 20 30 40 50 60 70 80 90 100
0.00 0.50 1.00 1.50 2.00
Flow rate (Ml/d/m width)
A
p
pl
ic
a
ti
on e
ff
ic
ie
n
c
y
%
200 m 400 m
[image:10.612.153.460.69.271.2]600 m
Figure 7 Maximum application efficiencies for various length bays on a moderately permeable soil with a 50 mm deficit
To place these results in context the inflow rates from the case studies are:
• average measured flow rate 0.12 ML/d/m width (4.8 ML/d for a 40 m wide bay); and • average flow rate for the improved irrigations 0.22 ML/d/m (8.8 Ml/d for a 40 m wide bay). These compare to a flow of about 0.27 ML/d/m (10.8 ML/d for a 40 m bay) required for maximum efficiency for a 400 m long bay on the heavy soils (Figure 6) and in excess of 0.53 ML/d/m (21.2 ML/d for a 40 m bay) on the more permeable soil (Figure 7). It should be noted that these generic simulations were conducted using lower soil moisture deficits than those applying during the field evaluations. This results in higher estimates of the flow rates than were required to optimise the actual irrigations.
Further work is proposed to better define the infiltration characteristics of the major soil types across the region and to quantify the effect of soil moisture deficit on the infiltration characteristic and hence on the flows required for maximum efficiency.
IMPROVEMENTS TO THE EVALUATION METHODOLOGY
At the start of this project it was recognised that the evaluation process had some limitations that would be exposed in the application to bay irrigated pastures. Briefly these are:
1. the difficulty in measuring the runoff from a bay, 2. the relatively short on-times in bay irrigation, and
3. the difficulty in quantifying the high and time variable surface roughness.
The quality of the estimates of the infiltration parameters depends very much on the length of time over which the data used in the estimates is collected – the longer the time the better the estimates. The volume balance model IPARM (Gillies et al., 2007) used in the inverse solution for these parameters can only use data collected before the inflow is cut off. In the case of a long furrow (> 1000 m) the on-time may be as long as 12 to 18 hours and this allows great confidence in the resulting parameter values. In this study the on times were relatively short and frequently the advance was only three quarters of the distance down the bay when the inflow was stopped.
model currently under development at USQ and based on the simulation engine of McClymont et al. (1999). The other is to use data collected after the advance reaches the end of the bay. Given the difficulty in measuring tail-water, measurement of the depth of water at the downstream end of the bay during the period of runoff could be used as a surrogate for runoff. The new model will allow users the option of using runoff or depth.
The surface roughness parameter is difficult to identify using advance data only. This is largely because the effect it has on the advance is similar to that of the k parameter in the infiltration equation. Runoff data (or its surrogate depth data) are necessary to separate the effects of these two parameters.
CONCLUSIONS
Evaluations of bay irrigation performance were successfully carried out using the IrriMATETM system at seven sites across the GMID. It has been shown that the evaluation process can lead to substantial realisable gains in efficiency for individual growers. These potential gains vary widely and the strategies to realise them also vary. However, for most the requirement will be for higher inflow rates and shorter irrigation times. Practically this means improvements to the supply capacity on- and off-farm and on-farm automation. The evaluation process provides the means to set the flow rate and irrigation time for automated systems. Evaluation also provides the means for identifying preferred capacities for farm outlets.
ACKNOWLEDGEMENTS
The authors gratefully acknowledge Price Merrett Consulting for undertaking the field measurements, Michael Zerk, SARDI, for his assistance in the field measurements at the first two sites, the respective irrigators for their cooperation in the provision of the field sites, and finally the Northern Victorian Irrigation Renewal Project (NVIRP) for funding the study.
REFERENCES
Austin, N.R. and Prendergast, J.B. (1997) Use of kinematic wave theory to model irrigation on cracking soil. Irrigation Science, 18: 1-10.
BDA Group (2007) Cost Benefit Analyses of Research Funded by the CRDC. Report to Cotton Research and Development Corporation, BDA Group, Manuka, ACT, Australia.
Dalton, P., Raine, S.R. and Broadfoot, K. (2001) Best management practices for maximising whole farm irrigation efficiency in the Australian cotton industry. Final report to the Cotton Research and Development Corporation, National Centre for Engineering in Agriculture Report 179707/2, USQ, Toowoomba.
Gilfedder, M, Connell, L.D. and Mein, R.G. (2000) Border irrigation field experiment. I: Water balance. Journal of Irrigation and Drainage Engineering, 126(2): 85-91.
Gillies, M.H., and Smith, R.J. (2005) Infiltration parameters from surface irrigation advance and run-off data. Irrigation Science, 24(1): 25-35.
Gillies, M.H., Smith, R.J., and Raine, S.R. (2007) Accounting for temporal inflow variation in the inverse solution for infiltration in surface irrigation. Irrigation Science, 25(2): 87-97.
Hume, I.H. (1993) Determination of infiltration characteristics by volume balance for border check irrigation. Agricultural Water Management, 23: 23-39.
Lyle, C.W. and Wildes, R.A. (1986) Irrigation of permeable soils with saline groundwater in the Shepparton Region of Victoria. Irrigation Association of Australia, Toowoomba, 24-26 September.
Maheshwari, B.L. and Jayawardane, N.S. (1992) Infiltration characteristics of some clayey soils measured during border irrigation. Agricultural Water Management, 21: 265-279.
Maheshwari, B.L. and McMahon, T.A. (1993a) Performance evaluation of border irrigation models for south-east Australia, II. Overall suitability for field applications. Journal of Agricultural Engineering Research, 54: 127-139.
McClymont, D.J., and Smith, R.J. (1996) Infiltration parameters from optimization on furrow irrigation advance data. Irrigation Science, 17(1): 15-22.
McClymont, D.J., Raine, S.R. and Smith, R.J. (1996) The prediction of furrow irrigation performance using the surface irrigation model SIRMOD. Proc. 13th Conference, Irrigation Association of Australia, 14-16th May, Adelaide. 10 pp.
McClymont, D.J., Smith, R.J. and Raine, S.R. (1999) An integrated numerical model for the design and management of furrow irrigation. International Conference on Multi-Objective Decision Support Systems, 1-6 August, Brisbane.
Raine, S.R., McClymont, D.J. and Smith, R.J. (1997) The development of guidelines for surface irrigation in areas with variable infiltration. Proc. of Australian Society of Sugar Cane Technologists, 20: 293-301.
Raine, S.R., Smith, R.J., Misra, R.K., Foley, J.P. and Schmidt, E. (2005) The science of irrigation water application, with a particular emphasis on physical engineering developments and needs. Technical Report 12/05, Cooperative Research Centre Irrigation Futures, Toowoomba, Australia.
Robertson, D., Wood, M. and Wang, Q.J. (2004) Estimating hydraulic parameters for a surface irrigation model from field conditions. Australian Journal of Experimental Agriculture, 44: 173-179.
Smith, R.J. Raine, S.R. and Minkevich, J. (2005) Irrigation application efficiency and deep drainage potential under surface irrigated cotton. Agricultural Water Management, 71: 117-130.
Turral, H. and Malano, H.M. (1996) A recirculating infiltrometer to investigate surge flow in border irrigation on cracking soils – reconciling field and infiltrometer measurements. SEAG Conference on Engineering in Agriculture and Food Processing, Gatton, 24-27 November, SEAg Paper 96/037.