Theme 2
Economy and finance Series Β
Shortterm trends
ISSN 10110844
ECUEMS information
3 D 1990
Monthly
THE COMMISSION SPELLS OUT ITS IDEAS ON ECONOMIC AND MONETARY
UNION: THE ECU WOULD BE AT THE CENTRE OF THE SYSTEM.
In a report to be examined by the Ministers of Finance of the Twelve on 31 March, the Com mission has spelt out its ideas on economic and monetary union, defining its position as regards some of the options mentioned in the Delors Committee's proposals of April 1989 and adding some important details.
The Commission draft proposes that joint mon etary policy should be directed by a new inde pendent and democratically responsible institution to be known as Eurofed, which would be legally committed to maintaining price sta bility.
The ecu would form the centrepiece of the sys tem. Eurofed would control ecu creation but, in line with the subsidiarity principle, the national central banks would retain responsibility for the proper operation of payment systems and mar kets, relations with financial institutions etc. On the other hand, strategies for dealing with budget deficits and indebtedness would be de cided by regular, mutual surveillance exercises rather than imposed by direct constraints.
The market for ecu issues has been particularly buoyant this past month.
On 7 March, the EIB added a new tranche of 300 million ecus to its 10% 1997 loan, thus bringing the total to 800 million ecus and making it the lar gest ecu issue on the Euromarket. This issue has been designed to yield 0.18 percentage points more than the French secondary market ecu OAT (Obligation assimilable du Trésor').
At the beginning of March, the French Treasury launched a new tranche of 225 million ecus for this OAT at 8.5%, with a yield on the issue price of 10.78%.
The French Treasury OAT, which is a domestic instrument and not a Eurobond, is for a much higher total amount than the EIB loan (about twice as much).
Linked with this OAT, which is available in units of 500 ecus nominal value, two series of war rants were issued by the Crédit Lyonnais on 22 March: 400 000 call warrants (sold at 22.5 ecus), each enabling an OAT to be purchased at 93%, while 200 000 put warrants (sold at 21 ecus) authorize sale of an OAT at 87%. These war rants must be exercised between 27 April 1990 and 17 March 1992 and will be quoted in Paris and Luxembourg.
Also classified as a domestic issue (and there fore not included in the statistics on pages 4 and 5 of this Bulletin) is a new series of Italian CTEs ('Certificati del tesoro in Euroscudi') for a total of 1 000 million ecus at 12% over five years. The market is expecting the 12.5% withholding tax still payable on interest on these certificates to be abolished shortly.
As regards progress towards the single Euro pean financial market, the Deutsche Bundes bank has allowed German residents to launch loans in foreign currencies in their own names since 5 January last; they had previously been obliged to act through foreign intermediaries. The KfW ('Kreditanstalt für Wiederaufbau'), a prestige borrower, and the LKB (Landeskredit
eurostat
OFICINA ESTADÍSTICA DE LAS COMUNIDADES EUROPEAS DE EUROPÆISKE FÆLLESSKABERS STATISTISKE KONTOR STATISTISCHES AMT DER EUROPÄISCHEN GEMEINSCHAFTEN ΣΤΑΤΙΣΤΙΚΗ ΥΠΗΡΕΣΙΑ ΤΩΝ ΕΥΡΩΠΑΪΚΩΝ ΚΟΙΝΟΤΗΤΩΝ
STATISTICAL OFFICE OF THE EUROPEAN COMMUNITIES OFFICE STATISTIQUE DES COMMUNAUTÉS EUROPÉENNES ISTITUTO STATISTICO DELLE COMUNITÀ EUROPEE
BUREAU VOOR DE STATISTIEK DER EUROPESE GEMEENSCHAPPEN SERVIÇO DE ESTATÍSTICA DAS COMUNIDADES EUROPEIAS
L-2920 Luxembourg - Tél. 43011 - Télex : Comeur Lu 3423
B-1049 Bruxelles, bâtiment Berlaymont, rue de la Loi 200 (bureau de liaison) — Tél. 2351111
Note
For any
TEL:
FAX:
information on
4301-4785
4301-3288
4301-4770
4301-4150
the statistics in this bulletin
T. MATHISSE
G. THOUVENIN
S. ANSION
contact Luxembourg:
Contents
I. A graph of the bilateral fluctuations of the ERM currencies. II. Yearly and monthly issues of ecu bonds.
III. EMCF rate, interest rates on ecu deposits and yields on ecu bonds. IV. Last month's ecu bond issues.
V. Consumer price indices in national currencies. VI. Consumer price indices in ecus.
VII. Yearly, monthly and daily ecu exchange rates.
© ECSC-EEC-EAEC, Brussels · Luxembourg, 1990
Reproduction is authorized, except for commercial purposes, provided the source is acknowledged.
TABLE I
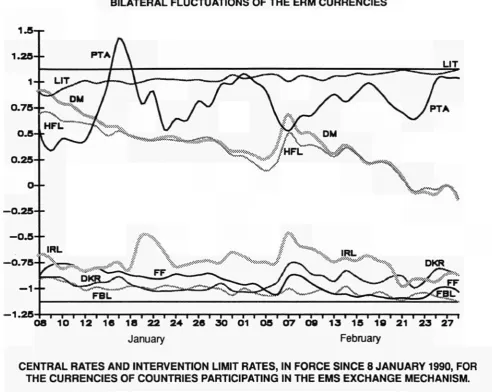
BILATERAL FLUCTUATIONS OF THE ERM CURRENCIES
January February
CENTRAL RATES AND INTERVENTION LIMIT RATES, IN FORCE SINCE 8 JANUARY 1990, FOR THE CURRENCIES OF COUNTRIES PARTICIPATING IN THE EMS EXCHANGE MECHANISM.
100
100
100
100
100
1
BLF
DKR
DM
FF
HFL
IRL
1000 LIT
100 PTA
1ECU +
m . .
-+
— .
+
= __. + —
-+
= ___
+
— . + = .. .
+
s
-BLF
100
553.000 540.723 528.700 2109.50 2062.55 2016.55 628.970 614.977 601.295 1872.15 1830.54 1789.85 56.5115 55.2545 54.0250 28.1930 27.5661 26.9530 33.6930 31.7316 29.8850 42.1679
DKR
18.9143 18.4938 18.0831
100
390.160 381.443 373.000 116.320 113.732 111.200 346.240 338.537 331.020 10.4511 10.2186 9.99130 5.21400 5.09803 4.98500 6.23100 5.86837 5.52600 7.79845
DM
4.95900 4.84837 4.74000 26.8100 26.2162 25.6300
100
30.4950 29.8164 29.1500 90.7700 88.7526 86.7800 2.74000 2.67894 2.61900 1.36700 1.33651 1.30650 1.63300 1.53847 1.44900 2.04446
FF
16.6310 16.2608 15.8990 89.9250 87.9257 85.9700 343.050 335.386 327.920
100
304.440 297.661 291.040 9.18900 8.98480 8.78500 4.58450 4.48247 4.38300 5.47850 5.15981 4.85950 6.85684
HFL
5.58700 5.46286 5.34150 30.2100 29.5389 28.8825 115.2350 112.6730 110.1675 34.3600 33.5953 32.8475
100
3.08700 3.01848 2.95100 1.54000 1.50590 1.47250 1.84050 1.73345 1.63250 2.303580
IRL
1.85100 1.80981 1.76950 10.0087 9.78604 9.56830 38.1825 37.3281 36.4964 11.3830 11.1299 10.8825 33.8868 33.1293 32.3939
1
0.510246 0.498895 0.487799 0.609772 0.574281 0.540858 0.763159
LIT
3710.20 3627.64 3546.90 20062.0 19615.4 19179.0 76540.0 74821.7 73157.0 22817.0 22309.1 21813.0 67912.0 66405.3 64928.0 2050.03 2004.43 1959.84
1000
1222.30 1151.11 1084.10 1529.70
PTA
334.619 315.143 296.802 1809.40 1704.05 1604.90 6901.70 6500.00 6121.70 2057.80 1938.06 1825.30 6125.30 5768.83 5433.10 184.892 174.131 163.997 92.2400 86.6726 81.8200
100
132.889
T A B L E II
ECU BONO ISSUES (Mio ECU) *
1984 1985 1986 1987 1988 1989
1988
1989 I II
III
IV
I II
III
IV Décembre Janvier February
TOTAL
3 569 9462 6840 7336 9188 11 127
1055 1848 2560 3 725
2056 3 461 2 700 2 910 1325 660 1545
Total
2 274 5 301 4226 4403 5 275 6 461
755 1075 1570 1875
1 205 2 161 1485 1 610 825 60 1 195
European ι
Business sector
1 119 3 361 2358 2058 3230 4400
555 750 950 975
670 1 195 1 285 1 250 565 0 495
Community
Govern ments
205 1040 558 1000 300 500
0 100 0 150
150 350 0 0 0 0 200
Insti tutions
950 900 1310 1345 1845 1561
200 225 620 800
385 616 200 360 260 60 500
NonEuropean Community
Total
1295 4161 2 614 2933 3 913 4666
300 773 990 1850
851 1 300 1 215 1 300 500 600 350
Business sector
795 3 401 2204 2180 3 138 4 141
175 773 890 1 300
851 1 150 1 140 1 000 400 425 350
Govern ments
225 200 350 453 575 425
125 0 0 450
0 150 75 200 100 0 0
Insti tutions
275 560 60 300 200 100
0 0 100 100
0 0 0 100 0 175 0
[image:4.595.33.571.63.422.2](·) Recording based on the payment date
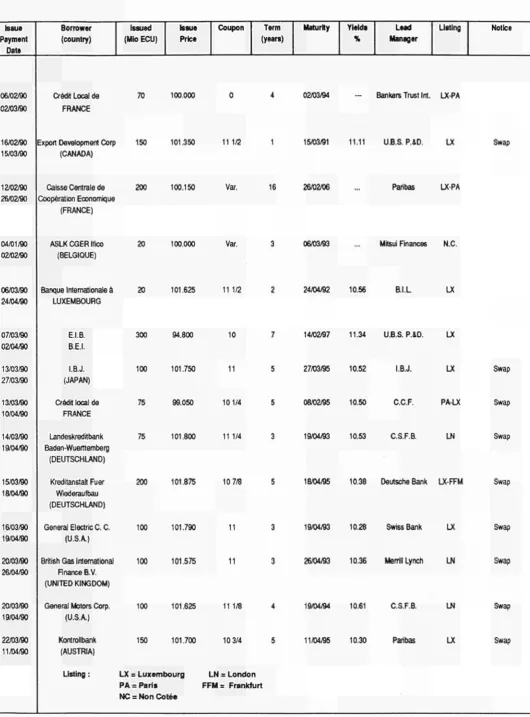
TABLE III
OPERATIONS RATES OF THE EMCF (CALCULATION MONTH) AND INTEREST RATES AND YIELDS OF ECU INVESTMENTS (%)
1986 1987 1988 1989
1989 February March April May June July August September October November December 1990 January February
EMCF Deposits
1 month
7.42 8.04
6.85 7.00
6.60 6 6 7
9.00 9.10
6.00 8.25
8.50 8.42
8.75 8.19
8.50 8.41
8.75 8.80
8.75 899
9.00 9.12
9.00 9.52
9.75 10.28
10.50 10.48
10.75 10.86
11.00 10.87
10.75 10.77
3 months
7.95 7.10 6.88 9.30
8.53 8.77 8.50 8.73 8.99 9.08 9.19 9.79 10.36 10.62 10.89
11.19 11.08
6 months
7.81 7.16 7.05 9.41
8.75 8.98 8.76 8.97 9.19 9.16 9.19 9.81 10.34 10.62 10.94
11.30 11.35
1 year
7.66 7.27 7.18 9.49
8.97 9.28 9.05 9.17 9.25 9.25 9.17 9.77 10.28 10.48 10.90
11.31 11.45
Bonds
< 5 years
7.71 7.85 7.70 8.86
8.23 8.71 8.62 8.77 8.86 8.79 8.74 8.85 9.28 9.66 9.91
10.48 11.13
57 years
8.22 8.24 7.89 8.70
8.37 8.69 8.70 8.79 8.68 8.54 8.49 8.59 8.89 9.28 9.33
10.04 10.74
> 7 years
8.34 8.51 8.18 8.76
8.44 8.83 8.79 8.83 8.71 8.59 8.53 8.67 8.98 9.24 9.25
[image:4.595.29.572.77.750.2]TABLE IV
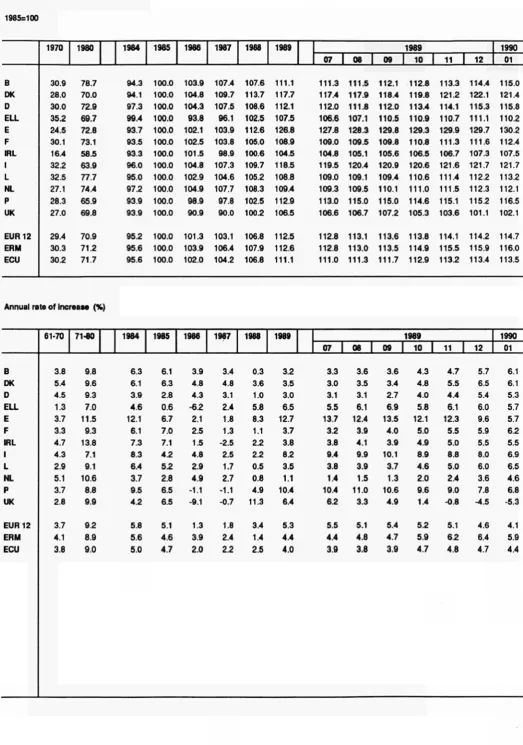
LAST M O N T H S ECU BOND ISSUES
Issue Payment
Date
06/02/90 02/03/90
16/02/90 15/03/90
12/02/90 26/02/90
04/01/90 02/02/90
06/03/90 24/04/90
07/03/90 02/04/90
13/03/90 27/03/90
13/03/90 10/04/90
14/03/90 19/04/90
15/03/90 18/04/90
16/03/90 19/04/90
20/03/90 26/04/90
20/03/90 19/04/90
22/03/90 11/04/90
Borrower (country)
Crédit Local de FRANCE
Export Development Corp (CANADA)
Caisse Centrale de Coopération Economique
(FRANCE)
ASLKCGERIfico (BELGIQUE)
Banque Internationale à LUXEMBOURG
E l B. B.E.I.
I.B.J. (JAPAN)
Crédit local de FRANCE
Landeskreditbank Baden-Wuerttemberg
(DEUTSCHLAND)
Kreditanstalt Fuer Wiederaufbau (DEUTSCHLAND)
General Electric C. C. (U.S.A)
British Gas International Fi nance B.V. (UNITED KINGDOM)
General Motors Corp. (U.SA)
Kontrollbank (AUSTRIA)
Listing :
Issued (Mio ECU)
Issue Price
70 100.000
150 101.350
200 100.150
20 100.000
20 101.625
300 94.800
100 101.750
75 99.050
75 101.800
200 101.875
100 101.790
100 101.575
100 101.625
150 101.700
Coupon
0
111/2
Var.
Var.
111/2
10
11
101/4
11 1/4
10 7/8
11
11
11 1/8
10 3/4
Term (years)
4
1
16
3
2
7
5
5
3
5
3
3
4
5
LX = Luxembourg LN = London PA = Paris FFM = Frankfurt NC = Non Cotée
Maturity
02/03/94
15/03/91
26/02/06
06/03/93
24/04/92
14/02/97
27/03/95
08/02/95
19/04/93
18/04/95
19/04/93
26/04/93
19/04/94
11/04/95
Yields
%
11.11
10.56
11.34
10.52
10.50
10.53
10.38
10.28
10.36
10.61
10.30
Lead Manager
Bankers Trust Int.
U.B.S. P.&D.
Panbas
Mitsui Finances
B.I.L
U.B.S. P.&D.
I.B.J.
C.C.F.
C.S.F.B.
Deutsche Bank
Swiss Bank
Merrill Lynch
C.S.F.B.
Pari bas
Listing
LX-PA
LX
LX-PA
N.C.
LX
LX
LX
PA-LX
LN
LX-FFM
LX
LN
LN
LX
Notice
Swap
Swap
Swap
Swap
Swap
Swap
Swap
Swap
TABLE V
CONSUMER PRICE INDICES IN NATIONAL CURRENCY
1985=100 B DK D ELL E F IRL I L NL Ρ UK EUR 12 ERM 1970 34.9 26.8 50.4 10.3 13.5 25.3 15.6 14.2 37.0 40.0 6.4 19.6 25.4 29.8
1980 1984
71.2 95.4 68.3 95.5 82.6 97.8 39.1 83.8 56.2 91.9 63.3 94.4 56.1 94.9 52.5 91.6 70.3 96.1 81.8 97.8 35.2 83.8 70.7 94.3
65.3 94.3 66.7 94.9
1985 100.0 100.0 100.0 100.0 100.0 100.0 100.0 100.0 100.0 100.0 100.0 100.0 100.0 100.0 1986 101.3 103.6 99.9 123.0 108.8 102.7 103.8 105.8 100.3 100.2 111.7 103.4 103.5 102.3 1987 102.9 107.8 100.1 143.2 114.5 105.9 107.1 110.9 100.2 99.8 122.2 107.7 106.9 104.7 1988 104.1 112.7 101.4 162.5 120.0 108.7 109.4 116.5 101.7 100.6 133.9 113.0 110.7 107.6
1989 1989
07
107.3 107.5 118.1 117.9 104.2 104.3 184.9 183.6 128.2 129.0 112.7 112.8 113.9 113.1 123.7 123.9 105.1 105.3 101.7 101.7 150.8 155.5 121.8 122.1
116.4 116.6 111.9 111.8
08 I
107.8 118.6 104.2 184.1 129.3 113.0 114.8 124.2 105.5 102.0 158.3 122.4 116.8 112.5 09 108.4 119.0 104.3 190.7 130.7 113.2 114.8 124.8 105.8 102.5 158.6 123.3 117.4 112.4 10 108.5 119.7 104.7 194.6 131.2 113.7 114.8 125.8 106.4 102.6 159.4 124.2 118.1 113.3 11 108.4 120.2 104.9 196.3 131.5 114.0 115.7 126.3 106.6 102.6 161.0 125.3 118.5 113.6 12 108.8 120.2 105.2 199.9 132.0 114.1 115.6 126.9 106.7 102.6 158.0 125.6 118.9 113.8 1990 01 109.2 119.4 105.8 201.3 133.2 114.5 115.6 127.5 107.5 102.4 160.7 126.3 119.5 114.3
Annual rate of increase (%)
Β DK D ELL E F IRL I L NL Ρ UK EUR 12 ERM EUR 12 ERM EUR 12 ERM 6170 3.0 6.0 2.7 2.1 6.1 4.1 4.8 4.0 2.6 4.2 4.5 4.1 3.7 3.3 0.8 0.7 1.7 1.2
7180 1984
7.4 6.3 9.8 6 3 5.1 2.4 14.5 18.3 15.4 11.2 9.7 7.3 13.7 8.6 14.1 10.8 6.7 6.5 7.4 3.2 18.7 29.3 13.8 5.0
9.9 7.2 8.4 6.7
3.5 3.3 3.0 3.0
4.8 5.0 3.3 4.2
1985 4.9 4.7 2 2 19.4 7.8 5.9 5.4 9.2 4.1 2.3 19.3 6.1 6.1 5.4 2.5 2.3 4.0 3.0 1986 1.3 3.6 0.2 23.1 8.8 2.7 3.8 5.8 0.3 0.3 11.7 3.4 3.2 2.2 2.8 1.8 Dis 3.9 2.5 1987 1.6 4.0 0.2 16.1 5.3 3.1 3.1 4.8 0.1 0.2 9.4 4.1 3.4 2.4 Aver 1.9 1.8 parity be 3.8 2.8 1988 1.2 4.6 1.2 13.5 4.8 2.7 2.1 5.1 1.4 0.9 9.6 4.9 3.6 2.7 ige devi< 1.8 1.4 tweenth 2.8 1.9
1989 1989
07 I
3.1 3.0 4.8 5.0 2.8 2.8 13.8 13.5 6.8 7.5 3.7 3.5 4.1 3.8 6.2 6.5 3.3 3.4 1.1 1.1 12.6 13.3 7.8 8.2
5.1 5.3 4.0 3.9
îton around the mean
2.2 2.4 1.4 1.4
08 3.2 4.9 2.8 13.6 6.7 3.4 4.5 6.3 3.4 1.1 13.7 7.3 5.1 3.9 2.2 1.4
e average and the minimum
4.1 4.3 2.9 2.8
4.0 2.8 09 3.5 4.7 2.8 14.3 6.8 3.4 4.5 6.3 3.6 1.3 12.7 7.6 5.1 3.9 2.2 1.3 3.9 2.6
io |
TABLE VI
CONSUMER PRICE INDICES IN ECU
1985=100 Β DK D ELL E F IRL I L NL Ρ UK EUR 12 ERM ECU 1970 30.9 28.0 30.0 35.2 24.5 30.1 16.4 32.2 32.5 27.1 28.3 27.0 29.4 30.3 30.2
1980 1984
787 94.3 70.0 94.1 72.9 97.3 69.7 99.4 72.8 93.7 73.1 93.5 58.5 93.3 63.9 96.0 77.7 95.0 74.4 97.2 65.9 93.9 69.8 93.9 70.9 95.2 71.2 95.6 71.7 95.6 1985 100.0 100.0 100.0 100.0 100.0 100.0 100.0 100.0 100.0 100.0 100.0 100.0 100.0 100.0 100.0 1986 103.9 104.8 104.3 93.8 102.1 102.5 101.5 104.8 102.9 104.9 98.9 90.9 101.3 103.9 102.0 1987 107.4 109.7 107.5 96.1 103.9 103.8 98.9 107.3 104.6 107.7 97.8 90.0 103.1 106.4 104.2 1988 107.6 113.7 108.6 102.5 112.6 105.0 100.6 109.7 105.2 108.3 102.5 100.2 106.8 107.9 106.8
1989 1989
07 111.1 111.3 1177 117.4 112.1 112.0 107.5 106.6 126.8 127.8 108.9 109.0 104.5 104.8 118.5 119.5 108.8 109.0 109.4 109.3 112.9 113.0 106.5 106.6 112.5 112.8 112.6 112.8 111.1 111.0 08 | 111.5 117.9 111.8 107.1 128.3 109.5 105.1 120.4 109.1 109.5 115.0 106.7 113.1 113.0 111.3 09 112.1 118.4 112.0 110.5 129.8 109.8 105.6 120.9 109.4 110.1 115.0 107.2 113.6 113.5 111.7 io | 112.8 119.8 113.4 110.9 129.3 110.8 106.5 120.6 110.6 111.0 114.6 105.3 113.8 114.9 112.9
n
113.3 121.2 114.1 110.7 129.9 111.3 106.7 121.6 111.4 111.5 115.1 103.6 114.1 115.5 113.2 12 114.4 122.1 115.3 111.1 129.7 111.6 107.3 121.7 112.2 112.3 115.2 101.1 114.2 115.9 113.4 1990 01 115.0 121.4 115.8 110.2 130.2 112.4 107.5 121.7 113.2 112.1 116.5 102.1 114.7 116.0 113.5Annual rate of Increase (%)
Β DK D E U E F RL I L NL Ρ UK EUR 12 ERM ECU 61-70 3.8 5.4 4.5 1.3 3.7 3.3 4.7 4.3 2.9 5.1 3.7 2.8 3.7 4.1 3.8
71-80 1984
9.8 6.3 9.6 6.1 9.3 3.9 7.0 4.6 11.5 12.1 9.3 6.1 13.8 7.3 7.1 8.3 9.1 6.4 10.6 3.7 8.8 9.5 9.9 4.2 9.2 5.8 8.9 5.6 9.0 5.0 1985 6.1 6.3 2.8 0.6 6.7 7.0 7.1 4.2 5.2 2.8 6.5 6.5 5.1 4.6 4.7 1986 3.9 4.8 4.3 -6.2 2.1 2.5 1.5 4.8 2.9 4 9 -1.1 -9.1 1.3 3.9 2.0 1987 3.4 4.8 3.1 2.4 1.8 1.3 -2.5 2.5 1.7 2.7 -1.1 -0.7 1.8 2.4 2.2 1988 0.3 3.6 1.0 5.8 8.3 1.1 2.2 2.2 0.5 0.8 4.9 11.3 3.4 1.4 2.5
1989 1989
TABLE VII
ECU EXCHANGE RATES
1981 1982 1983 1984 1985 1986 1987 1988 1989 89/02 89/03 89/04 89/05 89/06 89/07 89/08 89/09 89/10 89/11 89/12 90/01 90/02 02701 02/02 02/05 02/06 02707 02/08 02/09 02/12 02/13 02/14 02/15 02/16 02/19 02/20 02/21 02/22 02/23 02726 02727 02/28 B/LFR 41.2946 447115 45.4380 45.4420 44.9136 43.7978 43.0392 43.4284 43.3806 43.6811 43.5856 43.5558 43.5705 43.3857 43.3907 43.4207 43.4259 43.1875 42.9635 42.7137 42.6317 42.6473 42.6353 42.6420 42.6508 42.6263 42.6741 42.6705 42.6676 42.6527 42.6533 42.6371 42.6689 42.6739 42.6551 42.6755 42.6584 42.6126 42.6106 42.6339 42.6318 42.6157 DKR 7.92255 8.15687 8.13188 8.14647 8.01876 7.93565 7.88413 7.95152 8.04929 8.10659 8.11090 8.09474 8.10266 8.06501 8.05296 8.06397 8.06119 8.01074 7.94993 7.89523 7.88387 7.87496 7.88747 7.88533 7.88191 7.87307 7.87340 7.86831 7.87663 7.87768 7.87855 7.87343 7.87757 7.88207 7.88159 7.87676 7.87069 7.87587 7.87108 7.86373 7.86289 7.86114 DM 2.51390 2.37599 2.27052 2.23811 2.22632 2.12819 2.07159 2.07440 2.07015 2.08391 2.08088 2.08049 2.08127 2.07220 2.07243 2.07545 2.07415 2.05575 2.04715 2.03185 2.03396 2.04134 2.04001 2.04012 2.04087 2.03761 2.03477 2.03684 2.03717 2.03906 2.04024 2.03936 2.04064 2.04285 2.04232 2.04247 2.04346 2.04579 2.04594 2.04684 2.04451 2.04592 DRA 61.624 65.342 78.088 88.340 105.739 137.425 156.220 167.576 178.840 173.974 175.240 177.075 177.014 178.085 179.152 178.925 179.666 182.565 184.534 187.222 189.950 192.394 191.367 191.442 191.657 191.838 191.790 191.994 192.079 192.227 192.193 192.271 192.363 192.256 192.658 192.837 193.113 193.150 193.113 193.208 193.094 193.240 ESC 68.495 78.007 98.689 115.680 130.252 147.088 162.581 170.059 173.413 171.063 171.522 172.007 172.001 172.800 173.539 173.532 173.911 175.384 176.370 178.143 179.306 179.908 179.590 179.508 179.633 180.132 180.214 179.982 179.902 180.013 179.772 179.932 179.853 179.683 179.930 180.026 180.095 179.979 180.136 179.935 179.971 179.884
FF I HFL IRL
Yearly averages 6.03992 6.43117 6.77078 6.87165 6.79502 6.79976 6.92848 7.03643 7.02387 2.77510 2.61390 2.53720 2.52334 2.51101 2.40089 2.33428 2.33479 2.33503 0.691021 0.689605 0714956 0725942 0.715167 0.733526 0.775443 0.775671 0.776818 Monthly averages 7.09531 7.05286 7.03374 7.04064 7.03115 7.02906 7.01100 7.00422 6.97824 6.96197 6.94256 6.92398 6.93262 Daily 6.93051 6.92769 6.93202 6.93082 6.93091 6.92619 6.93185 6.93587 6.93581 6.93846 6.93977 6.93859 6.93946 6.94021 6.93498 6.93218 6.93178 6.92744 6.92460 6.92321 2.35260 2.34781 2.34705 2.34603 2.33433 2.33699 2.34002 2.33870 2.32112 2.31005 2.29349 2.29385 2.30111 0781016 0.779561 0.779877 0.778562 0.776397 0.775973 0.777654 0.777669 0.772564 0.772835 0.770622 0769421 0.769528 rates: February 2.29973 2.30062 2.30212 2.29886 2.29662 2.29801 2.29797 2.29899 2.29951 2.29840 2.29959 2.30164 2.30124 2.30202 2.30344 2.30494 2.30441 2.30514 2.30372 2.30515 0.769200 0.769403 0.769389 0.769048 0.768208 0768630 0.768900 0.769290 0.769552 0.769561 0.769683 0.769354 0.769651 0769976 0.770996 0.770107 0.770151 0.770498 0769724 0.769240
ur I
1263.18 1323.78 1349.92 1381.38 1447.99 1461.87 1494.71 1537.33 1510.47 1525.35 1528.37 1525.80 1513.25 1502.00 1499.36 1491.19 1492.73 1508.27 1503.58 1509.52 1517.25 1514.99 1515.90 1515.24 1514.84 1514.14 1517.72 1515.91 1516.26 1516.65 1515.38 1515.95 1515.43 1515.69 1515.40 1515.11 1513.79 1513.27 1513.69 1514.03 1513.37 1511.93 PTA 102.676 107.558 127.503 126.569 129.165 137.456 142.191 137.600 130.406 130.167 129.654 129.221 130.083 132.634 130.211 129.930 129.865 130.839 130.445 131.204 131.891 131.909 131.632 131.693 131.805 132.088 132.466 132.202 132.196 132.036 131.874 132.016 131.887 131.774 131.874 132.032 132.041 132.055 131.918 131.590 131.543 131.457UKL I
EXPLANATORY NOTES
Bilateral currency deviation (graph on page 3).
The various curves should be compared in pairs. To find the differential between two currencies, subtract the (positive or negative) values along the y-axis corresponding to each currency.
The graph is drawn with the curve of the strongest currency above that of the weakest. It shows there-fore the relative position of each currency vis-à-vis the other currencies.
When two curves intersect or merge over a period of time there is no differential between the two curren-cies and their market exchange rate equals their bi-lateral central rate.
The graph is drawn within a horizontal band corre-sponding to the maximum 2,25% margin of fluctua-tion applying at any given moment to market exchange rates and the bilateral central rates of the ERM currencies, with the exception of the PTA, which has a maximum authorized fluctuation of 6%. This band is divided symmetrically by a horizontal axis along which the points would be plotted if all curren-cies were at their bilateral central rate and there were therefore no fluctuations.
The daily market exchange rates of all currencies are compared with the relevant bilateral central rates and the differentials between the two calculated.
The maximum fluctuation between two currencies (with the exception of the PTA) is shown within the band, symmetrical with the horizontal axis. The fluc-tuations of the other currencies in relation to either of the two currencies in question are shown within the maximum permissible fluctuation.
The curves are drawn by linking the daily points showing the relative positions of each currency.
Exchange rate grid (Table I).
The intervention limit rates fixed in the official grid do not always correspond exactly to + or 2.25% (+ or -6% for the peseta) of the central rates, since for each currency pair (whose exchange rates are inversely proportional to one another) the lower limit of the one corresponds to the upper limit of the other.
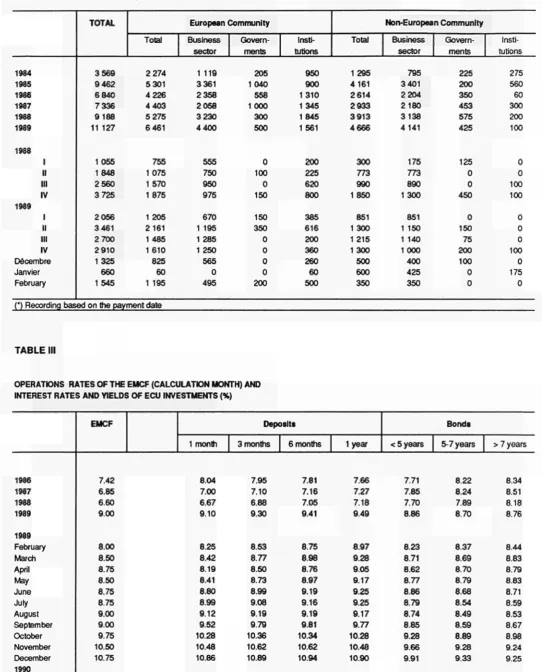
Ecu bond Issues (Table II & IV).
In the table II, the issues are recorded as at the pay-ment date. This bulletin only covers international and foreign issues in ecus, including ecu issues offering the option of conversion into other currencies. Main source: International Financing Review
Table II shows, under the headings:
- Business sector and Governments: national issuers, both private and public.
- Institutions: the European Investment Bank and the Commission of the European Communities (EEC, ECSC, Euratom).
- Organizations: the specialist institutions of the United Nations, the World Bank, the Council of Europe, etc
Table IV shows detailled information of the latest known issues, whatever the payment date.
Interest rates and yields on ecu investments (Table III).
The interest rates for 1,3 and 6 month and 1 year de-posits are calculated on the basis of the Friday Lon-don market rates (source: Financial Times, LonLon-don Money Rates, ECU Linked Deposit Bid).
The bonds are classified according to three types of terms: under 5 years, from 5 to 7 years and more than 7 years. The redemption yields of ecu bonds are calculated each Wednesday from a sample of fixed interest bonds, denominated in ecus and listed on the Luxembourg Stock Exchange. These yields are weighted by amounts in circulation, (source: Luxem-bourg Stock Exchange).
The monthly and yearly averages are the arithmetic means of these weekly interest rates and bond yields.
Operations rates of the EMCF (Table III).
The interest rate for transactions in EMCF (European Monetary Cooperation Fund) ecus, is the weighted average of the most representative rates on the do-mestic money market of the countries whose curren-cies make up the ecu basket. It is based on the weighting of the currencies in the ecu basket as derived from the ecu central rates in force. The rate thus calculated for a given month applies to EMCF transactions for the following month. In table 3, this rate relates to the month upon wich the calculations are based and not to the (following) month during which it is used by the EMCF.
Consumer price Indices In national currency (Table V).
The consumer price indices in the national currency of each country measure changes in the purchasing power of one unit of national currency spent in the country concerned.
Two composite indices are calculated, covering all the Member States of the Community (EUR 12) and the eight Member States with currencies participating in the European Monetary System exchange rate mechanism (ERM). (Although the peseta has been participating in the exchange rate mechanism since 19/06/89 and has been included in the calculation of the ecu since 21/09/89, it is only taken into account in the indices relating to the ERM which are included in this bulletin for data after 30/09/89.)
These indices are calculated as weighted arithmetic means (chain indices) of the national indices, the weighting for each Member State being its relative share in the final consumption of households of the group of countries in question (EUR 12, ERM), ex pressed in purchasing power standards, at current prices and purchasing power parities.
At the foot of the table, the average weighted fluctua tions around the mean and the minimum are given for the same groups of countries, with the same weight
ings. (These are calculated as weighted averages of the absolute fluctuations in relation to the mean and the minimum respectively). They show the degree to which price movements in the Member States in the Community converge.
Consumer price Indices In ecus (Table VI).
For each country the index of consumer prices in ecus is calculated by dividing the national consumer price index by the average movement of the national currency in relation to the ecu during the month. It measures the change in the purchasing power of one ecu in the country concerned.
Three composite indices are calculated, covering all the Member States of the Community (EUR 12 and
ECU), the 9 Member States participating in the Euro pean Monetary System exchange rate mechanism (ERM). Although the peseta has been participating in the exchange rate mechanism since 19/06/89, and the peseta and the escudo have been included in the calculation of the ecu since 21/09/89, these two cur rencies are only taken into account in the indices con tained in this bulletin for data after 30/09/89.)
These three indices are calculated as weighted arith metic means (chain-indices). The weightings are defined as follows: for the EUR 12 and ERM indices, the relative share of each Member State in the final consumption of households for the group of countries in question (EUR 12 or ERM), expressed in ecus at current prices and exchange rates (annual weighting). For the ecu index, the relative share of each Member State's currency in the calculation of the ecu (monthly weighting).
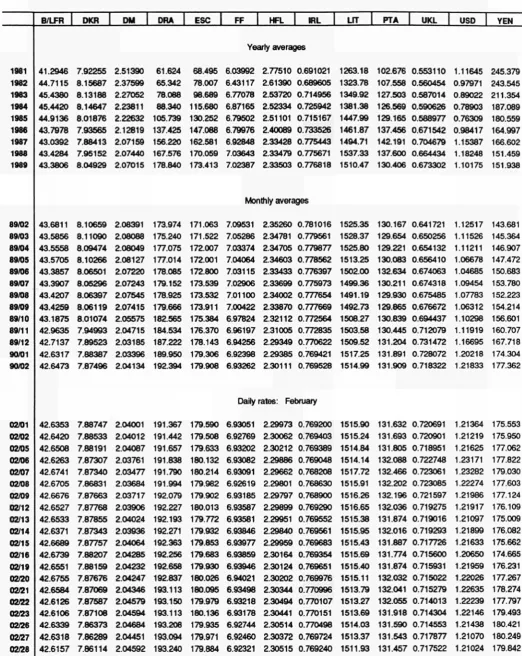
Ecu exchange rates (Table VII).
The exchange rates for the ecu against the national currencies of the Member States of the Community, the USD and yen are shown as annual averages, monthly averages (for the current year), and daily rates (for the latest available month).
1ecu= Σ
100= Σ
BFR DKR DM DRA* ESC* FF HFL IRL LFR LIT PTA
From 09/21/89 the ecu basket was made as follows :
3.301 0.1976 0.6242 1.44 1.393 1.332 0.2198 0.008552 0.13 151.8 6.885
Ecu central rates from 01/08/90.:
421679 7.79845 2.04446 187.934 177.743 6.85684 230358 0.763159 421679 1529.70 132.889
Weights of currencies on 09/21/89, calculated on the basis of current central rates, expressed In %.
7.83 2.53 30.53 0.77 0.78 19.43 9.54 1.12 0.31 9.92 5.18
UKL*
0.08784
0.728615
12.06
' does not participate to the exchange rates mechanism
Venta y suscripciones · Salg og abonnement · Verkauf und Abonnement · Πωλήσεις και συνδρομές Sales and subscriptions · Vente et abonnements · Vendita e abbonamenti
Verkoop en abonnementen · Venda e assinaturas
BELGIQUE / BELGIË FRANCE UNITED KINGDOM
Moniteur belge / Belgisch Staatsblad Rue de Louvain 42 / Leuvenseweg 42
1000 Bruxelles/ 1000 Brussel Tel. (02)512 00 26
Fax 511 01 Θ4
CCP / Postrekening 000200550227 Autres distributeurs / Overige verkooppunten Librairie européenne /
Europese Boekhandel Avenue Albert Jonnart 50 / Albert Jonnani aan 50 1200 Bruxelles/ 1200 Brussel Tél. (02) 734 02 81
Fax 735 08 60 Jean De Lannoy
Avenue du Roi 202 /Koningslaan 202 1060 Bruxelles / 1 060 Brussel Tél. (02) 538 51 69
Télex 63220 UNBOOK Β CREDOC
Rue de la Montagne 34 / Bergstraat 34 Bte 11 / Bus 11
1000 Bruxelles / 1000 Brussel
DANMARK
J . H. Schultz Information A/S EFPublikationor
Ottiliavej 18 2500 Valby Tlf. 36 44 22 68 Fax 36 44 01 41 Girokonto 6 00 08 88
BR DEUTSCHLAND Bundesanzeiger Verlag Breite Straße
Postfach 10 80 06 5000 Köln 1 Tel. (0221) 20 290 Fernschreiber:
ANZEIGER BONN 8 882 595 Fax 20 29 278
GREECE
G.C. Elefthoroudakia SA International Bookstore Nikis Street 4
10563 Athens Tel. (01) 322 63 23 Telex 219410 ELEF Fax 323 98 21
ESPAÑA
Boletín Oficial del Estado Trafalgar, 27
28010 Madrid
Tel. (91) 446 60 00
MundiPrenaa Libros, S.A.
Castellò. 37
28001 Madrid
Tel. (91) 431 33 99 (Libros) 431 32 22 (Suscripciones) 435 36 37 (Dirección) Télex 49370MPLIE
Fax (91) 275 39 98 Sucursal:
Libreria Internacional AEDOS Consejo de Ciento, 391
08009 Barcelona
Tel. (93) 301 86 15 Fax (93)317 01 41 Generalität de Catalunya: Llibreria Rambla dels estudis Rambla, 118 (Patau Moja) 08002 Barcelona Tel. (93) 302 68 35
302 64 62
Journal officiel
Service dee publications des Communautés européennes 28, rue Desaix
75727 Paris Cedex 15 Tél. (1)40 58 75 00 Fax (1)40 58 75 74
IRELAND
Government Publications Sales Office Sun Alliance House
Molesworth Street Dublin 2
Tel. 71 03 09 or by post
Government Stationery Office
EEC Section
6th floor Bishop Street Dublin 8 Tel. 78 16 66 Fax 78 06 45 ITALIA Licosa Spa
Via Benedetto Fortini, 120/10 Casella postale 552 50125 Firenze Tel. (055)64 54 15
Fax 64 12 57
Telex 570466 LICOSA I CCP 343 509
Subagenti:
Libreria scientifica Lucio de Biasio AEIOU Via Meravigli, 16
20123 Milano Tel. (02) 80 78 79 Herder Editrice e Libreria Piazza Montecitorio, 117120 00186 Roma
Tel. (06) 679 46 28/679 53 04 Libreria giuridica
Via 12 Ottobre. 172/R 16121 Genova Tel. (010) 59 56 93
GRANDDUCHÉ DE LUXEMBOURG Abonnements seulement
Subscriptions only Nur für Abonnements Messageries Paul Kraus 11, rue Christophe Plantin 2339 Luxembourg Tél. 499 88 88 Télex 2515 CCP 4924263 NEDERLAND SDU uitgeverij
Christoffel Plantijnstraat 2 Postbus 20014
2500 EA 'sGravenhage Tel. (070) 78 98 80 (bestellingen)
Fax (070) 47 63 51
PORTUGAL Imprensa Nacional Casa da Moeda, EP
Rua D. Francisco Manuel de Melo. 5 1092 Lisboa Codex
Tel. (01)69 34 14
Distribuidora de Livros Bertrand, Ld.* Grupo Bertrand, SARL
Rua das Terras dos Vales, 4A Apartado 37
2700 Amadora Codex
Tel. (01) 493 90 50 - 494 87 88
Telex 15798 BERDIS
Fax 491 02 55
H M SO Booke (PC 16) HMSO Publications Centre 51 Nine Elms Lane London SW8 5DR Tel. (01) 873 9090 Fax GP3 873 8463 Subagent:
Alan Armstrong Ltd 2 Arkwright Road Reading, Berks RG2 OSO Tel. (0734)75 18 55 Telex 849937 AAALTD G Fax (0734) 75 51 64
SCHWEIZ / SUISSE / SVIZZERA
OSEC
Stampfenbachstraße 85 8035 Zürich
Tel. (01) 365 51 51 Fax (01) 365 52 21 ÖSTERREICH Manz'ache Verlags
und Universitatsbuchhandlung Kohlmarkt 16
1014 Wien Tel. (0222)531 610 Telex 11 25 00 BOX A Fax (0222) 531 6181 TURKIYE
Dünya aOper veb ofset A S . Nariibahce Sokak No. 15
Cagaloglu
Istanbul Tel. 512 01 90 Telex 23822 DSVOTR UNITED STATES OF AMERICA UNIPUB
4611 F Assembly Drive Lanham. MD 207064391 Tel. Toll Free (800) 274 4888 Fax (301) 459 0056 Telex 7108260418 CANADA
Renouf Publishing Co., Ltd 61 Sparks Street
Ottawa
Ontario K 1 P 5 R 1
Tel. Toll Free 1 (800) 267 41 64 Ottawa Region (613) 238 89 856
Telex 053-4936
JAPAN
Kinokuniya Company Ltd 177 Shinjuku 3Chome Shiniukuku
Tokyo 16091 Tel. (03) 354 01 31 Journal Department PO Box 55 Chitóse Tokyo 156 Tei. (03) 439 01 24 SVERIGE BTJ Box 200 22100 Lund Tel. (048) 18 00 00 Fax (046) 18 01 25 AUTRES PAYS OTHER COUNTRIES ANDERE LÄNDER
Office des publications officielles des Communautés européennes 2, oie Mercier
L2985 Luxembourg Tél. 49 92 81
Télex PUBOF LU 1324 b Fax 48 85 73
Continued from page 1
bank Baden Württemberg') were the first Ger man borrowers to benefit from this measure and two loans have been launched in ecu (see de tails on page 5).
The KfW loan will be quoted in Luxembourg and Frankfurt.
The Crédit Local de France's 'zero coupon' issue (see page 5) provides for repayment indexed against the movements of a combination of Ger man (40% FAZ), French (30% CAC40), Dutch (20% EOE), Italian (5% BCI) and Swiss (5% SMI) stock exchange indices, weighted by move ments in those countries' exchange rates against the ecu. The variablerate bond coupons of the CCCE and ASKL (see page 5 again) will be cal culated on the basis of the 3month LIBID (Lon
don Interbank Bid Rate) and the threemonth LIBOR (London Interbank Offered Rate) minus 0.25%.
The Bank of England has announced that the offer of 6month Treasury stock in ecu will be in creased to 400 million ecus as from 1st April in stead of 300 million as hitherto; the offers of 1 and 3month bills remain fixed at 300 million ECU each. Approximately 3 000 million ecus of UK Treasury stock is currently in circulation. On the market for ecudenominated financial in struments, the analysts are expecting a Spanish Treasury fiveyear issue of 500 million ecus as well as the launching of a 350 million ecu bond by the EEC for Hungary.
Price (excl. VAT) in Luxembourg: Single copy ECU 6 · Subscription ECU 51
. S .
OFICINA DE PUBLICACIONES OFICIALES DE LAS COMUNIDADES EUROPEAS KONTORET FOR DE EUROPÆISKE FÆLLESSKABERS OFFICIELLE PUBLIKATIONER A M T FÜR AMTLICHE VERÖFFENTLICHUNGEN DER EUROPÄISCHEN GEMEINSCHAFTEN ΥΠΗΡΕΣΙΑ ΕΠΙΣΗΜΩΝ ΕΚΔΟΣΕΩΝ ΤΩΝ ΕΥΡΩΠΑΪΚΩΝ ΚΟΙΝΟΤΗΤΩΝ
OFFICE FOR OFFICIAL PUBLICATIONS OF THE EUROPEAN COMMUNITIES OFFICE DES PUBLICATIONS OFFICIELLES DES COMMUNAUTÉS EUROPÉENNES UFFICIO DELLE PUBBLICAZIONI UFFICIALI DELLE COMUNITÀ EUROPEE BUREAU VOOR OFFICIËLE PUBLIKATIES DER EUROPESE GEMEENSCHAPPEN SERVIÇO DAS PUBLICAÇÕES OFICIAIS DAS COMUNIDADES EUROPEIAS
ISSN 1011-0844