S T A T I S T I C A L
O F F I C E
O F T H E E U R O P E A N
C O M M U N I T I E S
Addresses
L u x e r n b o u r g ,
C e n t r e
L o u v i g n y ,
P . O . B o x 1 9 0 7 - T e l . 2 8 8 3 1
S T A T I S T I C A L
O F F I C E
O F T H E E U R O P E A N
C O M M U N I T I E S
F O R F U R T H E R D E T A I L S , P L E A S E S E E
T H E S T A T I S T I C A L O F F I C E
P U B L I C A T I O N S
.
O N " E N E R G Y S T A T I S T I C S ' ' :
Y E A R B O O K
ENERGY
IN THE
CONTE
NTS
3ess.
1 Preface
r. TTIE COMMI]NITY IN THI] hrORL])
2 Development of primary enerry consumption
3 Relative importance of the Community and certain major countries 4 Development of the pattern of primary enerry consumption 5 Depend.ence on imported. energf
rI. ffERGY IN COMMIJNITY COI]NTRIES
6 Pattern of primary energT consumption and proriuction 7 Dependence on inported energf
B Consumption of energy by major sectors g Per capita enerry consumption
rTT. PETROLEI]M
10 Prod-uction anrl suppl.y of crude petroleum in the world 11 Resources an<l processing of crud.e petroleum in the Commrrnity 1 2 P r o r l u ö t i o n a n d use of petroleum products
1 3 fnland use and foreign trade in petroleurn products 1 4 U s e o f p e t r o l e u r n p r o d u c t s by major sectors 1 5 U s e o f p e t r o l . e u m p r o d u c t s in the transport seetor
rV. COAL 1 6 C o a l s u p p l i e s 1 7 C o a l c o n s u m p t i o n
V. NATIIJRAL GAS
18 Supplies of natural gas 19 Consurnption of natural gas
VT. EI,NCTRICAL Iü{ERGY
PREFACE
FXIROSTAT (Statistical Office of the European Communities) has prepared. some twenty tables giving the main features of energg production anc1 consumption in the Community.
TLre energf situation in the Community is compared with that i n t h e I J . S . A . r U.S.S.R. and, Japan. fhen four tables summarise the contributions made by the principal sources to the enerry production and consumption in each Member State of the Community of Nine. Finally, information is g:iven on individual types of enerry.
T H E C O M M U N I T Y IN T H E W O R L D
DEV]DLOPMN{T OF PRIMARY MIERGY CONSUMPTION
1 972
Average annual growth rate
1 9 7 0 / @
r capita enerry consumption
EUR-6
EUn'.9
USSR USA Japan
ItoRtD
1 r g 2 1 2 2 r O 5 r B
-':t- -1 -1 -1
3 1 2 3 r 3 3 t 3 B r 1 2 1 4
1 1 4
During the last decad,e, the enerry rnarket has been marked by a great increase in requirements, resulting in an average annual rise of 5 ,4o in wor1d. enerry consunptionl equivalent to a doubling in 1l years.
lthile the growth rate in the Community of Nine and in U.S.A. remained. below the world. averager consumption rose sharply in the Comnunity of Six and even more so in Japan. fn 1971, enerry consumption in the Community of Nine was about half that of the United States, three times that of Japan and equal to that of the USSR.
As regard.s per capita consumption, thisisvöry high in the United States; six times the world. averaget while the leve1 in the Cornmrrnity of Nine and the USSR is lower at two and a half times the world. average.
+ t?re rrnit of measurement used. is the ton of petroleurn ecnrivalent (tp"). This is the arnount of energy required to obtain an amount of heat equal to that provided. by one ton of petroleum (tO miffion kcal) from arqr enerry soü.TC€ o
The worrl ton is used. to denote the metric tonne.
1 9 & | t g t t millions of tons of petroleurn
ecruivalent* 327 | '92
512 | Brz
437 | 773 1 o 5 l l 1 6 3 9
/"
6 r B 5 t 5 6 r 5 5 1 1 1 5 r 7
-RELATIVT] IMPORTAT{CE OF TITT] COMMTINITT AND CERTAIN MAJOR COIJNTRItrS
The relative place in the worid. market of the Corunrrnity and other large economic powers reveals the dearth of indigenous resources in the Community ancl Japan.
InCeed, primary enerry production in the Community covered. only 44" of its consumption in 1971, that of Japan, even less z |y/o. Prod,uction in the USSR greatly exceed,ecJ d.omestic reguirements, while the United States, although the largest prod.ucer, in the wor1d, has to obtain supplies on the f o r e i g n m a r k e t .
1 9 7 1
Population Prima,ry enerry p r o d u c t i o n ( " )
Primary enersr
consumption (t)
(r)
(.)
n i l l i o n s
/"
n i l l i o n s t p e/"
m i l l i o n s
t p e
/,
m i l l i o n s t p e
rxtR-6 EnR-g USSR USA Japan
}TCRLD 190 253 4 5 n 7 105
5 , 2
7 r o
6 r 7 5 t 7 2 r g
235
355
975
1 4 q
49
4 1 5 6 r 8 1 8 r 7 2 8 r 1 o r g
&4
84o 798 1 579 254
1 1 , 7 1 6 1 2 1 5 1 4
32A
4 t 9
359 485 - 1 7 7 215 n 5
DEVELOPMN{T OF THE PATTERN OF PRI}IARY H{ERGY CONSI'MPTION
Ttre increase in inland enerry consumption has been accompanied in most countries by a d.rastic change in the consumption pattern.
In the Community, the market has cleveloped differently for each source of enerry. The role of coal has continued to become less irnportant compared- to that of petroleumt which has grown year by year. lthile the consumption of coal has c'lecreased by more thart 4o atunally, consumption of petroleum has risen by an average annual rate of 14/q while natural gas has experienced. a spectacular gowth.
fn other major countries also there has been a marked tend.eney to replace coal by petroleum. Nevertheless, in the USA and. USSR the proportion of natura.L gas used" has reached a leve1 r:nknown in the Corrnunity.
m i l l i o n s o f t o n s of petroleum Eard coal a^nd lignite
Cnrde petroleum Natural gas
Prinary electrical enerry TOTAI
j6 11 543 t1
nzl ez6
h
4 l 4 3 4 t 1,rl z1B
I
z>+lt 121
tp
expressed. as a fo
Hard coal and lignite Cnrd.e petroler:n Natural gas
Primary electrical enerry TOTAL
2 7 J | 1 6 1 1 6
23,9
!
r e,e
3 9 A t 4 0 t 53 2 r o l
l e , r
4 1 6 t 4 $I 1 0 0 | 1 0 0
I 5 8 1 2 | z 5 , t
9 r 5 | 9 , 6
4 4 | 3 , 7
-DTIPENTDISICE ON IMPORMD TüIERGY
llet imports less bunkers
Degree of depend,ence* on imported enerry
1 g & 1 9 7 1 1 g & 1 9 7 1
E[JR-6 ErJR-9 USA Japarr
n i l l i o n s t p e
sB
|
:ao
I
158
|
rcr
4 8 l r t
3 1 | , ' , ,
o,
2 9 $ 3o r9 4 1 6 34 r7
6219 6 1 3
9 t 3 U 4 - r 7
Net inports less burrkers (+) Defined by the ratio t
,, as a /o
Ttre rise in primary enerry consunption has meant that the Comrnrrnity, USA and. Japanr have had to resort increasingly to obtaining supplies from outsicle sources so that in ten years the net imports of the Conrnunity anC. the USA have more than trebled. Those of Japan have increased -<e'renfolC during the sane period..
E N E R G Y
I N C O M M U N I T Y
C O U N T R I E S
PRI},IARY NIERGY CONSIIMFTTON +
PRIIVIARY M{ERGY PRODUCTION
+ For the reference period .and in the corresponding state of the tTilsfomation technicruest inlmd consmption represents the mout of prinaqr energy which the Cmity or one of its nenber countries nust have available to reet its inlild demilds.
# 1971
- O
-1972
Hard coal & ecruiv.
L i g n i t e & ecnliv.
Cnrd.e petro-leum & emriv.
Natural gas
Primary
elect-rical ener€gf TOTAL Mn tpe
/"
illn tpe/"
l,[n tpe/"
It{n tpe("
l{n tpe{,
I{n tpe/"
EtrJR-9 E{JR-6 Gernarry France Italy Netherlands Belgiurr Luxembourg United Kingvlom Ireland# Denmark189 r7 1 1 2 1 3
5 9 1 3 2 8 1 3 7 t 7 3 r o 1 1 , 5 2 1 5 7 5 t 3
o r 7 1 1 4
2 1 , 5 1 7 t 5 2 3 r B 1 7 t 2 6 1 4 5 1 2 2 6 1 1 5 2 t 9 3 5 1 1 o t 5
7 r o 4 A 2 3 r0 2 1 , 7 1 r o o r 3 o r o o r o o:o
1 1 3 o r o
2 r B 3 1 6 B r 7 o 1 6 o 1 2 o r o 0 r o o t 5
1 8 r 7 o r o
5 2 4 t 5 394 13 1 3 7 t 2 1 1 O r B
8 9 1 5 2 8 J 2 6 r 7
1 1 5 1 0 6 r g 4 t 9 1 B t 6
5 9 t 5 6 1 , 5 5 5 t 2 6 7 1 3 7 3 1 9 4 9 1 6 6 1 4 3 1 r 0 4 9 rB 6 9 ro 9 5 t 3
1 0 2 r 7 7 9 to 2 2 ro 1 1 , 7 1 2 r B 2 6 1 3 6 r o o r 1 ,t:,
1 1 , 6 1 2 1 3 B r B 7 1 1 1 o r 6 4 5 1 6 1 3 t 7 2 1 2 t t - _ '
3 9 r 7 3 1 r 3 7 1 6 1 2 r a 1 0 1 6 - o 1 3 - o r 1 o r 6 B r ? o r 1 - o 15
4 t 5 4 f i 3 r 1 ? r B B r ? 4 t 5 4 1 2 1 3 r 3
4 l 1 r 7 - 2 1 3
BBz
rz
541 tO 4 8 1 6 1 6 4 r 6 1 2 1 t1
5 7 t 7 4 4 1 2 4 t 7 2 1 4 t 6 7 r o 1 9 t 5
1 0 0 1 0 0 1 0 0 1 0 0 1 0 0 1 0 0 1 0 0 1 0 0 1 0 0 1 0 0 1 0 0
1972
Hard. coal L i g n i t e C m d e p e t r o l e u m
Natural gas
Primary
elect-r i c a l e n e r g r TOTAT,
l{n tpe
/"
Itln tpe%
Mn tpe/"
Ihn tpe/,
I,[n tpe/"
illn tpe/"
EUR-9E{'R-6 Germarry France ftaly Netherland s Belgium Luxembourg United Kingdon freland # Denmark
1 7 6 r 7 1 O O r 1
7'2 t5 1 9 ' o o r 1 1 1 9 6 1 6
7 6 1 6
o:'
5 0 1 1 4 1 , 3 & 1 3 M 1 5 o r 3 4 t o 9 8 1 6
7 O 1 6 3 1 9
23;7 22 12 N r g 1 r o t r:,
,:o
6 r 7 9 1 1 1 7 ' 4 2 1 3 , r _ ,
u,
:,
1 1 , 8 1 1 , 4 7 1 1 1 1 5 1 1 2
,:u
4 Io .
0 . 33 r 3 4 r 7 5 t 9 3 t 5 5 r o
':o
o t 3
gl,g
1 0 0 r 3 7 7 ,3 1 3 t 9 6 1 4 1 1 , 9 4 5 t o
o:o
,r:o
2 8 1 5 3 1 t9 1 1 t 6 1 4 t 9 4 9 t 3 9 2 t5 o 1 5
2 1 ,2
:
3 8 r 3 2 9 1 6 4 t 9 1 4 1 1 o t 5 o r 1 o r o o r o B 1 6 o r 1 o r o
1 o 1 9 1 2 1 2 4 1 1 3 3 , o 4 3 1 5 o 1 2 o r 7 8 3 , 9 7 1 9 B r 1 6 1 2
352 r7 2 4 2 1 5 1 n , 1 4 2 t7 2 4 12 48 r'i 6 1 7 o r o 1 o B r 5
1 1 6 o r 1
Primary enerry confllmption
of tons of petrol-eum
1 3 2 r O 1 0 6 r 7 9 r o Net irnports less bunkers
D e g r e e o f C . e p e n d e n c e o n i m p o r t e d e n e r r y
Denmark Luxenbourg Belgium freland # ftaly France
Genrarly United Kingdorn Netherlands
Prirnary enerry prod.uct ion DEPnIDEI\iCE OF COMMUNITY COUNTRIES ON IMPORTTI'D ENERGY c l a s s i f i e d i n r l e c r e a s i n g o r d e r o f d e p e n d e n c e
d e f i n e d . b y t h e r a t i o :
1971
Net im r t s l e s s b u n k e r s Primary enerry consumption
1972
Consumptior of the energy sector
Fina1 -# consumDtion
norF I gneretr
energr
I inaustry I tr"tt"port I householdu,
| | l e t c . ( + )
TOTAL
EUR-9 S o l i d f u e l s LiErid fuels Gaseous fuels Electriea.l enerry Heat
TOTAJ,
S o l i d f u e l s Liquid fuels Ga.seous fuels Electrica.l enerry Heat
TOTAL
ni1 3 r 5 3 1 t 7 B ' 5 ,,
:o 6 4 ' B
0,fl,)
5 1 6 48.-9
1 3 1
u:
1 0 0
ions of t o n s o f 4 1 1 1 1 0 4 r 6
5 6 A
9 5
r B
1 r o
3 o 2 r B
( l > , V " )
expressed. as 1 4 $
| 34t5 | 1 B 1 6
| 3 1 , 6
|
,o:' I
pet roleum ecruivalent o 1 6 1 O g , B
o r g 5 t 3
1 1 6 1 6
( t t r V " )
a / "
52rB
: , ,
O r o 0 r t / " )
3 7 J
1 2 9 1 1 4 3 t6 8 9 1 2 2 . 1 3 0 1 , 1
ß > r 4 " )
8B 1 2
1 0 0
0 , 5
|
, r , ,
9 4
t 2 |
q r , g
o , B |
, + , 1
4 ö |
, r , u
J I o r t1 0 0 1 0 0
86
14
42Bp
1 1 6 t 6 2 1 1 t3
3 r 1
8 4 5 ' l
(tov/,)
1 0 1 2 5 0 1 6 1 3 r 8 2 5 $
o 1 4 1 0 0 CONSI'MPTION OF trn[ERGY BY MAJOR SECTCIRS
+ Including coümerce, hmd.icrafts, public authorities, a6riculturer fishing and Berrrice
lltre greatest users of enerry are ind.udtry and householdsr each of yhioh oonsues one third of the total denand.
Petroleun productB alone fonn half the total of different sources of enerry. Eleotrical energf cones seoond with one quarier of conBüptioni oüe third of this howevsr ls energ,'produced frorn residml fuel oil ty thermal porer plants.
In tyo sbctors, nonFenelgr änd trsspoltr petrolem products occulDr a positlon nhere they are both pleatoEinant änd difftcult to replrce ln the $ediun tem.
-PtsR CAPITA MIERGI CONSIJMPTION
+ unit of account of the Dropean Comnunities ++ 1971
Hasty conclusions should not be drawn fron the per capita consr:rnption figuresr even if, in certain cases, they are indicative of the standard of living and of the level of industrialisation. In the household.s sectorr climatic cond.itions influence consumption to a great extent and it is obvious that within Europer for the sane stand"ard of comfort, the consumption of a country in the South will always be lower than that of a corrntry with a more rigorous climate.
Sinitarly, in regard to industrial consumption, allowance must be made for the industrial stmcture of the countryr &s well as the specific consumption of d.ifferent bra^nches of ind.ustry. The high leveI of per capita inrrustrial consumption of the Grand-DrctrJlr for exampler is due almost exclusively to the iron and steel inclustryt an intensive user of energrl which constitutes about ff/o of tlne countryf s industrial activity.
1972
TOTIIAL PRIMARY
MIERCY
Total
industry Transport
H o u s e h o l d . s , e t c .
Gross national product at market prices
EUR-9 EIJR-6 Germarllr France Italy Netherlancts Belgiun Luxembourg United KingC.on f rela^nd Denmark
k 3 465 3 359 4 030 3 1gB 2 232 4 334 4 553 1 3 7 1 6
3 u 7
2 364++ 3 9 Q ?
ilograrnmes o
1
I
1
I
I
1 2 1 0 1
1Bg 429 690 387 964 539 1 0 1 786 570 757 931
petroleurn 458 M 5 515 4 6 2 3 3 5 5 0 3 429 743 492 415 6 1 2
f e q
l'""',"1u,
I
1 1 1 i
i
, 411
i
, o 1 2
I
uro
| 1 6 8 6
I
1 5 3 7
I
1 7 a r
-|
' 3 r 7
I
'' 026
I 2 0 0 3
s4ERr!49,
o f w h i c h : U S A Canada V e n e z u e l a UIDDLE EAST o f w h i c h :
f ran Saudi. Arabia Kuwait and. N f r a o
E m i r a t e s
+Fnrga
o f w h i c h : Libya A l g e r i a N i g e r i a FAR EAST o f w h i c h : f n d o n e s i a C h i n a
ryB.o3u_G+st..Eun-l)
o f w h i c h :U S S R Rumania Countries not s p e c i f i e d .
TOTAT NON-COMMUNI collNrRiEg
EUR-g TQTAL WORTD PRONUCTION ANI)
PETROLEUM
ST'PPLY OF CRUDE PETROLEIIM IN THE WORLD
1 972
Production of crude petroleum
A
Pr.rchases by
ruR-g
B
n/t
Rrrchases by USA
c
c/t
Rrchases Japart D
by
n/ a.
mn tons rnn tons /" mn tons {" mn tons q"
e j d
ue2t
-NITT
868 f i 2 ( 1 )
B B ( 2 ) 1 6 7
1 5 2
o 0
1 4
B
6t
7/ /
42
48
1 4
B
'l 0 0 o 0 o go1 254 286 182 67 BZ 360
4o
6l
zj
1 3 1
4 6
Bo
44
37
55
40
46
22 2 7 3 9 3 2 1 0 0 4 5
1 6 7 1 9
7 9 3 1 3 1 1 1 3 8 2 1
o 0 1 2 1 4
274
1 0 5
5 2
90
1 7 0 62
Bo
76
3 1
6
50
56
23
B
5 5
4 B
1 2
1 3
5
2 0 3 0 3122
54
l o ( z )
1 1
1 2
B 7 8 1 5
3 2 2 6 3 2 5 9
4 n
394
1 4
1 3 3
1 3 3
o 0
o 0
0 0
0 0:
0 2587
1 2
599
22
5 6
/
/
/
22/
/
/ l I Tf i ; ;
l l t l
* ; ;
including natural gas liquids
inclucl,ing shale oils and bituminous sand oils
Prodlctim of crude petrolem by the Comunity of trine is neglig,ibte, representing only O.4% ot worltl production ad neeting nly 4 of Comuity requirernents. For this roason the Corüfunity of Nin€ is the largest world inpolter of crude petroleun, purchasing alnoet a qualter of trorltl production (equivalent to half the interlational trade in crude petroleu). lwo areas are the principal suppliers to the Comnity: the ltiddte EaBt vith 6{f of iraports antl Africa wi.th 3096. in 1)'12, the principal countries eupplying t_he Connunity rere, in oriler of inportüce: Saudi Arabia (23?6 ot inporte), xwait (l4l), LLWa (i4y'"), tran (lt$), Ntgeria (f,"). rueae figuea indicate the ctosenesg or.tne colmercial ties of both purchasers ed. sellarsr--since th€ Comuity of, Sine purchases 62fr of Africats crude petroleur'nroauction anqo+14-är'tn"t ot trre-uidaiä-basi.'
RESOURCES AIfD PROCESSING OF CRUDE PETROI,EI]M IN THE COMMT'NITY
M i l l i o n s o f t o n s
(t ) after d.ed.ucting trade within the Cornnunit.y (Z) includ-ing anounts drawn from stocks
E\ropean stratery as regards economics of petroleum is to transport the raw material in bulk from non-Commwrity countries and. refine it at the place of consumption. The Connunity of Nine does not re-export anJr crude petroleum, the slight differences record.ed. between resources and cruCe petroleum processecJ are due to stock movernents and some trad.e between member countries,
ft will be noted, in particular, that at the end of 1972t the Community of Nine ha.,C arnple refining capacity (atmospheric distillation) with 731 million t/yea.r, arnounting to 25fo of world capacity. The Community thus has the greatest refining capacity, more tharr the United States (6SZ million t,/year), the USSR (lfO million tfyear) and Japarr (zl> million t/year).
1 9 7 2
Crud.e petroleum prod"uction
Crude petroleurn
irnports
Crtrd e petroleum resources
Crude petroleum processed
Refining capacity
E'UR-9 1 1 , B 5 6 0 ( 1 )
__rl,d']
1 1 1 t 5 1 1 9 1 3 1 2 0 r 0 6 9 14 3 6 1 2 1 0 8 r 0 2 1 4 1 0 r 1
- - 5:2,!(:)
1 1 1 , 4 l n r a 1 2 1 , 8 6 9 1 9 3 6 1 5 1 0 7 , O
2 1 6 1 O 1 2
731
Germany France ftaly Netherland s Belgium United Kingdon Ireland Denmark
7 1 1 1 1 5 1 1 2
':u
o:,
o r 1
104 A 1 1 7 r 8 1 1 B r B
6 7 r B 3 6 r Z 1o7 t7 2 1 4 1 0 , o
1 3 3 145 1 7 4 99 4 2 1 ? 4
NET PRODUCTION OF PETROTF:ITM PRODUCTS FROM REFINERIES
TOTAL INLAND USE OF PETROLETJ}{ PRODUCTS
+ nainly norenergr
Resources of cnrde pet"olem processed in the Comnrnity of }{ine Cuing 1972 enableC aLnost l{0 nillion tons of refined products to be prduceal after allding for re_fining lossest refineries m consmption mc stock vriations. Of total proctuction JO$ ras gas mC fuel oils, 1J$ no+,or gasoline nd. lV/ norenergr products (naphthas, bitmenr lubricating oi1s, etc). In 1972, this production covered inlanil uses aouting to 482 nillion tonst net exports to nor0orrlfiunity coutries of 14 nillion tonsr md. bur&ering totalling 37 nillion tonst leaving a suplus of 7 nillion tons shich was put into stock.
U i l l i o n s o f t o n s
1972 Refi-nery gas LPG Mo'tor gaso--l i n e
Avia-t i o n fuels
Kero-sene
G a s , r l i e s e l & ,
l i g h t fuel oil
Resid-ual fire1 oil
other+ pro-ducts
TOTAL
ErJR-g 3 r 1
@ re/")
1 0 r 3 ( t , f , " )
7 0 1 2 ( t l r ü " )
1 6 1 1 ß ro/")
B 1 2
(t ,s/")
1 7 1 , O
(lt ,9"7
2O7 ,O
ß8,9")
5 3 1 9 ( t o r ü ,
5 3 9 r 8
0ov/")
Gernar5r France Italy Netherlands Selgium United Kingrlom Ireland Denmark1 r B O r 3 o 1 2 o r 1 o r 1 o t 5
o r 1 2 r 7 2 1 5 2 1 2 o r B o 1 4 1 1 5
0 o 1 2
1 5 t 5 1 5 t 5 1 3 t 9 5 r 3 4 t 5 1 3 t 6 o t 5 1 1 4
1 1 4 3 1 2 2 1 2 3 r 3 1 1 2 4 1 6 o r 1 o r 1
0 0 4 l 1 1 3 o r 1
,:u
o r 1 4 1 t9 4 3 ro 2 5 1 2 1 9 1 5 1 1 , 6 2 5 t 5 o t 7 3 1 6
2 9 t 1 3 6 $ 55'4 2 6 1 6 1 3 ' 4 4 1 to
1 1 3 3 t 7
1 0 1 4 9 t 5 1 1 , 1 9 1 2 3 1 2
, o:,
o 1 4
1 0 2 r 8 1 1 0 r ' 1 1 4 1 3
66 r't 3 4 t5 9 e A 2 r 6 9 1 6
M i l l i o n s o f t o n s
E'UR-g
2 1 4
(o r>/")
e $
(t ,Y/")
67,7
(q rv/")
1 2 r o ( z r > / " )
6 r B ( ,q/")
1 6 2 t 2
ß1rfl")
1 6 6 1 2
(y r>/")
5 5 t 5 (t t ,>/")
482 14 (tov/") Germa.rllr France Italy Netherlancls Belgium Luxembourg United Kingiom freland Denmark
1 1 1
o t 4 o 1 2 o r 1 o:'
':-o r 1 2rO 2 1 5 1 1 9 o 1 4 o 1 5 o 1 1 4 o r 1 o 1 2
1 8 1 6 1 4 t 5 1 o t 5 3 1 4 2 1 5 o r 1 1 5 t 9 o r 7 1 1 6
2 1 3 1 r 8 1 r 7 o r B o 1 4 o 4 r o o r 3 o t 7
o r 1
o
2 1 2
,:,
o
3 r o
o r 1
o r 2
5 9 t 3 4 1 rB 1 7 1
7 1 3 B t 9 o r 6 N 1 4 1 r o 6 1 4
2 8 1 9
2 e $
3 9 r 8 5 t 7 9 r 3 o 1 7 4 1 A
2 1 4 B 1 2
1 5 t 9 8 t 7 9 t 7 5 t 9 2 1 9 o 1 2 1 1 , 3 o 1 2 o r ?
1 2 8 , 2 9 9 1 5 8 3 r 1 24 rB 24 16 1 1 5 9 7 ,B
4 r 8 1 B r 1
-INTAI{D USE AI{D FOREIGII TRADE TN PETROLEI.]M PRODUCTS
+ A = production 3 = inlffid use
+f including trade witbin the Commnity
The fi.rst tro collms of thi6 table, obtained from the totals on the preceding page, show the ertent to ithich inlmd usea of petroleü prcilucts are coveted by production. This vaies greatly depending on the coütry ild affects foreign trade. The four countries sith a sur?lus olrr:iously have an exportable balance and spply the countries with a deficit.
these f,igures shon that trade in pet"oleun prod.ucts between llenber coütries reaches reIlr hig! Ie\relsr the greatest novenent being fron the lletherlanCs to Gernagr. ttre figures shtr in additioil that proaluction also covers lnrnkering reguirenents.
the Comunj.ty has a surlrlus of , ild exports, re€iilual fuel oils mc jet fuels while it has a deficit of, and. thus ir0ports, norenerry products such as lubricants, bitunehs atrd petlo1eüD coke.
m i l l i o n s o f t o n s
1972
a +
B A - B '4 Inports ExoortsBalance of Foreign Trade (import s-export s)
Sunkers
EUR-g 1 1 4 "
r r r i - r
w"
1 1 1 / "
13fl"
26q"
14q,
o / "
104"
54/"
53/"
+ 57'/
-_ 2514 + 1 1 , O + 3 1 , 2 + 4 1 ,3 + 9 t 9 - 1 1 5 + 1 1 6 2 1 2 B r 5
( r o l , t )
#
( t t l , > )
#1 4 A
37 r0Germa4lr France Italy Netherlands Belgium Lrrnembourg United. Kin$d,on Ireland Denmark
37 r3
9 r o
5 1 6 B r 2 6 1 1 1 1 5 N 1 4
3 r o 1 2 r o
? r B 1 2 1 4 2',7 ,B 3 7 t 5 1 3 ' 2
0 1 5 r B
o 1 6 2 1 4
+ 29t5 - 3 r 4 2212 2 9 t 3
7 1 1 + 1 1 5 + 4 1 6 + 2 r 4 + 9 1 6
4 r O 4 t 9 7 r B 1 1 , 4
,:,
USE OF PETROLUFM PRODUCTS BY MAJOR StrCTORS
M i l l i o n s o f t o n s
Demand. in this table shows certain special features. Approximately 1&/" of refined petroleum products are not consumed as produced, but undergo further transformation in electric power stations and- gas works. fhe important share taken by consumption by industry for non-enerry uses is clearly brought out here; the petrochemical industry (naphthas) and civil engineering works (titumens) are the principal consumers. Finat C e m a n d . f o r h e a t i n g o f b u i l d i n g s ( h o u s e h o l d s , conmerce, hand.icrafts, offices, e t c . ) which amounts to a cluarter of inland use, varies greatly, ciepend.ing on the temperature. In this respect t 1972 carl be considered. a normal year. This latter sector consunes { grad,es of prod.ucts, which are used for d"ifferent purposes; gas oils or light fuel oils for central heating (ll/"), resirlual fuel oil for heating blocks of flats and other large buildings (l>:/"), Kerosene for stoves (5/") anci. LPG (butane-propane) mainly for
c o o k i n g ( 9 " ) . 1 9 7 2
Transformations Tndustry Transport Agriculture and. fishing Household
e t c . TOTAI,
Ei-ectric power s t a t i o n s
Gas works
Ih:erry u s e s
Non-enerry
'uses
ErJR-9 7 2 t 7
( t > r t / " ) 4 r O
@,ajt)
1 A 7 t 6
(zzr9")
5 2 1 1
( t o , V "
1 1 2 1 9 (zl rq/")
1 0 , B ( 2 r 4 " )
1 2 2 t2
(z>
r9")
48214 (to4") GermarSr France ftaly Netherlands Belgium Luxembourg United Kingrr.om IreLand. Denmark
9 1 6 1 2 t B 1 6 1 9 2 r 5 4 1 9 o r 1 2 1 ,o 1 1 1 3 r B
o t 5 o r 7 o 1 2 0 0 0 2 1 2 o r 1 o r 2
2 5 , 7 2 6 r 7 1 7 , 1 2 1 5 4 r B o r 7 2 5 t 5 1 1 3 3 t 3
1 6 1 3 7 t 7 9 1 2 6 r o 2 r 7
o
9 t 5 o 1 2 o 1 5
2 9 1 9 2 2 r 7 1 7 t 2 6 1 6 4 t 7 o r 3
27
1
1 1 3 3 r 1
1 1 5 3 1 2 2 r O o 1 4 o 1 4 0 2 1 1 o 1 2 1 r 0
M t 5 2 5 1 6
N 1 6
6 r B
! , 1
0 1 4 1 0 1 4 o r 6 6 1 21 2 8 1 2 9 9 rj 8 3 r 1 24 rB ? 4 16 1 1 5 9 7 t8
4 r 8 1 8 , 1
[image:18.418.25.377.75.284.2]-USE OF PETROLEUM PRODUCTS
EUR-g
IN TI{E TRAIISPORT SACTOR
1 9 7 2 - m i l l i o n s o f t o n s
BREAKDO}üN BY PRODUCT
G a s o l i n e s
D i e s e l o i 1 f o r r o a d transport
Jet fuel F \ r e l o i l s t u b r i c a t i n g o i l s
TOTAL
67 ,1 59 r4/" 25 ,4 22 r5/"
1 2 p 1 0 , 4 " 6 1 5 5 r V " 1 r 9 1 f l o
1'ö@o 1 1 2 t g
Exclud.ing bunkering which rnay be regarded" as exports, the transport sector uses 23/" of the petroleurn prod-ucts consumed in the Cornmunity of Nine, that is to say about the same amolrnt as household.s and" as the enerry consumption of petrol.eum produets by the whole of industry.
O f t h e 1 1 1 m i l l i o n t o n s u s e d b y t h e t r a n s p o r t s e c t o r , a p p r o x i m a t e l y 33 million are used. for good s transport , while passeng:er transport (passengers, baggage ancl. post) accor:nts for Bo mi1lion.
The srnall arnounts used by the railways are partly explained. by the fact that electricity supplies Q/" of traction enerry.
Road transport is the main consumer with t{ miflion tons divided unecf,ually between gasoline (ll/,) 1 gas-oil for road transport (21ü ancl lubricating oils (4").
Except for the railways, the transport sector uses virtually no source of energy other than petroleum prod"ucts.
R a i l w a y s 3 , O 2 r 4 o
Rea.d Transport 94 14 Bl r4,
A v i a t i o n 1 2 1 1 1 O r W " lnlanC water:ways 3 14 3 rof"
COAL
SUPPLI]IS OF COAL
1 972
EUR-9 Germar\y France I t a l y N e t h e r l a n C s Belgium Luxembourg Unitetl Kingdom l)enmark f rela.n,:i.
Procl-u c t i o n
(")
252t5 1 0 3 r 5
27 1 o r 1 2 r B
,:,
1 O 9 1 4
o r 1 .
fn ad.d.ition to hand" coal , brown eoal is a.n important primary enerry source: 31 t7 rnillion tons of coal emrivalent were produced. by the Community in 1972r of which more than BO/o was consumed by power stations.
A.s regards the Communityrs eoa.l imports, Australia also occupies an important pIa.ce a.longsicle the countries mentione<i a.bove, provi,ling more than 2r'f million tons of coal i n 1 9 7 2 . C o k i n g c o a l h e a d s t h e l i s t o f g r a C e s i m p o r t e d .
Millions of tons of coal esuivalent fmports from non-Communi
corrntries . .. I of which :
Balance of trade with-in the Community
Availar b i t i t y
( r )
(")
(r)
S t o c k s a t c o 1 1 1 e ^ ' t e s enc.l of
197 2 USA Polanrt USSR
3 1 t7 5 1 2 5 r o B t 9 2 1 5
,:u
4 1 4 2 1 2 o r 7
1 3 r 0 3 r o 1 r 7 3 r 3 1 1 4 1 r o
2 1 6 o r o o r o
1 O r 1 1 1 6 1 1 6 3 r 1 o t 5 o:,
o r 7 1 r 7
3 1 6 o r o
1 1 2 1 r 7 o r o
o:,
o t 5
- gls
+ 6 1 0 + 3 r o - o t 9 + j r o + O 1 3
1 1 1 + o r 0 + o r 1
284 t2 9 8 1 9 3 8 r 1 1 2 t O
4 1 4 1 5 t 3 o t 3 1 ' 1 2 r 7 2 1 2 o t 9
Bg /" 105 /" 71 /" 1 / " 64 /" 62 f"
97 /"
, t l "
L 4 1 1e l
3 r 7 o r 1 o 1 6 o 1 41 0 1 2
:
-CONSI,JMPIIION CF COAL
(+) availability less exports to nore0onnunity cor:ntries i stoct variations.
In 1972, Comnunity production of prod.ucts derived. from the processing-löf coal arnounted to 81 ,5 million tons of coke (of which 59$ was eonsumed" by the iron a^n<l steel industry)
"nd BrO million tons of coal briquettes, consumed alnost exclusively by households.
Apart from the consumption of coal (30 riffion tons) and coal briqtrettes, the fthousehold.tt sector artcl smal1 consuners also used.9r3 million tons of coke Errd 7r2 urillion tons of brown coal briquettes. Total coal consumption by this sector is thus more than 50 million tons which shows its great importance for the eoal industrXr.
millions of tons of eoa.l ecnrivalent
1972
GROSS INLAI{D col{suMPTroN
( + )
Transformations
C o L l i e r i e s oldn Consumption
Final energv consumption Total
o f w i c h
Power stations
Coke ovens
EUR-9 2 7 6 t 5
(too {")
2 1 9 t7
0g /")
1 O 4 t 5
ßa 67
1 O 4 1 1
ße 7"1
4 A
(z /")
5 2 ro ( t g /")
Gerurargr France Italy Netherland s Belgium Luxembourg United. Kingdour freland Denmark
9 6 1 2 3 7 , 9 1 1 , 4 4 1 2 1 5 t 7 o r 3 1 O B r 1
o 1 9 1 r B
8 4 1 2
28ft
1 0 1 4 3 r 6
tr:,
7 9 ' 4 o r 1 1 1 6
34 r7
1 O r 1 o r B o r g 2 1 4
54 ro o r o 1 1 6
M , B 1 4 t 9 9 1 5 2 1 2 9 r 3
2 3 A
:
2 r 7 O t 5 o r o o r o o:o
1 1 2
':'
B r g 9 t j 1 r o o 1 6 \ 1 6 o t 3 2 7 1 1
NATURAL GAS
SUPPTIES OF NATIIRAL GAS
'
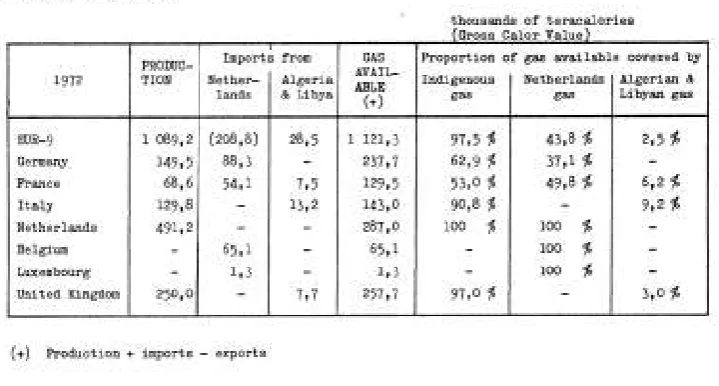
thousands of teracalories
(+) Production + imports - exports
'E '= -- :-.
Natural gas constitutes l@" of aII available ga,ses in the Coumunity of Nine. In the Netherlands, the corresponding figure is as high as 93fr.
Since 1968, the Netherlands has been the ConrounityIs largest producer of natural gas and its annual production has nore than quadrupled. over this period. and accounts tor 45% of Conmunity production, almost half of which goes to meet the requirements of other Cornnunity countries.
Production of natural gas has increased. rapidly in the last few years in the United. Kingd.om, the second- largest producer, and is now thirteen times greater t h a n i n 1 ! 5 8 .
These two countries will remain the Conrnunityfs principal producing countries for some tirne, since they ovrr, 83% of the Comrnunity confirmed reserves.
Gross Calor Va1ue
r972
PRODUC-TION
Import
Nether-lands
from A l g e r i a & Libya
GAS AVAIL-Ä3LE
(*)
Rnoportion of gas available covered. by fnd.igenous I Netherlands I Algerian &
sas |
** |
Libran sas
EUR-9 Gennany Fra^nce Italy Netherlands Belgium Luxenbourg United. Kingdour
1 O 8 g t 2 r 4 g t5 6 8 1 6
r2g
)B
o r t _ , ,
25O tO
( z o 8 , B ) 8 8 ' 3 ,O'_,
6 5 r l t:,
,U r_t
7 1 5
tr:,
, , ' ,
r 1 2 1 , 3 237 r7 129 15 1 4 3 ' O Z B 7 , O 6 5 r I
1 r 3 257 t7
9 7
, 5
6 2 1 9 5 3 ' o g o r B
9 7 , O
%
/,
f"
/,
/"
/"
43,8 /"
3 7 r I %
49,8 f'
lOO /" 1OO /" lo0 /.
2r5 fi
612 %
,r_, f
3 r o
%
[image:22.419.17.377.52.245.2]CONSI,tr,IPTION OF NAfl]RAL GAS
Thoüsand.s of teracalories ( G r o s s C a l o r V a l u e )
(*) Includ.ing own consunption a^nd. losses in the supply systens
The greatest industrial consuner of gäsr the chemical industry, accounts for 4If" of total industrial consumption. The iron a.nd steel industry a^rrd. non-netallic minerals industry each consune Llfo of tlne industrial total.
Natural gas is still being introduced. into household.s at a high annual rate in all countries (it has grohrn by nore than 43y'o fron 19?1 to L972 throughout the Community), due to the great expansion of the heating of build.ings.
fn the United. Kingd.oar, however, unrch of the natural gas is at present still being tra.nsforned. in gas works and l@, of the anount processed. is d.istributed. to the households sector, bringing real consunption by this sector up to 12010OO teracalories.
,l
L972
GROSS INLAIID CONST]MPTION
(*)
Tra^nsfornations Power Stations
Tra^nsfornations Gas ttorks
Industrial Consu-nption
(Drergy and. non-en€rgy)
Consunption by household.s, e t c .
HIR-g Gernargr France ftaly Netherla,nds Belgiun Luxenbourg United Kingdom
1 r2Lr7 LO$
24oJ rjq"
r28t2 rou/"
t39r9 roo/
287
r0 rAq"
56
ro Log'f.
11
3 LOq"
258,7 toy/"
22O r7 tg rT% 6212 25 rB/" 2 L r 7 1 6 r g % 9 r B 7 r o / ' 88, t 30r7/" 20,3 3ArB/"
o r 2 t 5 r 4 f " 1 8 r 3 7 ,t / "
87 ,, 7 ,B{" 3 r 2 t ) % 5 r 4 4r2fo
41 3,4/'
7 4 t 2 2 8 r 7 %
457 19 4ltgfo I22rO 50 r7%
5Lr5 [O12fo 8 g r 1 6 3 r 7 f " 85 16 29 ,B/, 2 g t 5 4 4 r 7 f " o r 8 6 t r 5 / o 7 9 , 5 3 0 r T f "
3 1 6 , ? 2 B t 2 f , 4gJ 20,4/o 4 1 1 0 3 2 r o f " 31r 4 221!y'o Lrzr 4 39 ,2/"
ELECTRICAL
ENERGY
NET PRODUCTION OF ELECTRTCAL FTü1RGY BY IIIIERGY SOURCES
(+) inclurling Ital.yrs geothermal prod"uction z 2.4 W{h
More 'hhan BOf" of Conrnunity production comes from conventional therma,l power stations. Although the use of tqvdrocarbons is increasing steadily each yearr soliC. fuels are stil1 the ma,in source of electrical enerry at Community leve1, although the proportion of coal used. in 1972 was only slightly greater tha.n that of petroleum prod"ucts.
At national levef, the share from each type of enerry source varies greatly accord.ing t o t h e p a t t e r n o f t h e p r o c l u c t i o n f a c i l i t i e s a . n d s u p p l y p o s s i b i l i t j e s .
Average specific oonsumption of conventional thermal power stations wa.s approximately 25O grarnmes of petroleum ecruivalent in 1972.
I^Iith the British eontribution nuclear power plants now provi<le almost 6/" of total p r o d u c t i o n .
1 972
TTET TOTAL PRODUCTION
(+)
Hydros N u c l e a rConventional thermal Dorüer stations Hard and
brown cöal
Petrol-eum p r o d u c t s
Natura.l gas
DeriveC gases & o t h e r s
T o t a l
FX]R-9 9 0 6 r 7 1 1 1 . 1
in TWh 5 1 r B
(thousand rnillion klrlh)
342,3
|
zar,e
I
aa,e
2 8 1 5 741 ,4EIIR-9 Germa.qy France f t a l y Netherlancl-s B e l g i u m Luxembourg I i n i t e d K i n g d o m I r e l a n d
Denma.rk
TI'Ih g 0 6 J 1 0 0 257 t2 10O 1 6 3 , 7 1 0 0 1 2 9 r 7 1 0 0 4 7 t2 1 0 0 3 5 , 7 1 0 0 2 1 2 1 0 0 245 t3 1oO 6 1 5 1 0 0 1 g A 1 o o
1 2 t 3 5 1 2 2 9 r 7 3 2 t7
1 1 6 4 2 r 7
1 r B 1 o , 3 o r 1
ex' 5 t 7 3 t 4 B 1 4 2 r 7 o r 7
o:,
,o:
p r e s s e d . a I
| 3 7 1 7
I
u',9
I
1 8 , 5
2 1 4 4 A 1 5 t 5o t 5 5 4 1 6 2 5 t 5 1 B , B
/"
3 1 t7 1 4 t 9 3 3 , g
55,2
N 1 5 5 1 r 3 20 14 3 0 t2 6 4 1 2 B t , 1
9 1 1 9 r o 5 t | 2 r 6 7 1 t5 N r 7
3 1 2 , r _ ,
3 1 2 4 1 6 3 1 9 2 1 5 2 1 9 1 O , B 3 3 r t
:'
B , ,7 9 1 A 6 1 , 9 62 r7 9 9 t 3 9 8 , 3 5 7 t 2 8 7 ' B 8 9 r7 9 9 1 9
-F{IEI CONSI]UPTION TN CO]f\TMITICIüAL TI{ERMAI POhNE}R STATIONS For prod.uction of electrical energr only
Eleribility of power stations with respect to the firel consuned nay considerably alter the breakdm shonn.
On 1 JauarXr 1972, 23ßof the instalted themal ""Orr*"
in the Cormmity of Six was equipped to tün petroleurn prod.ucts only anal a:.:moet JS consisted of nulti-f.uel equi@ent, in which one or nore other fuels could be used insteail of fuel oil. It oa thue be assuneal that in 1972. v}.en supply on the mrket hatl guirl.ed choice towards petroleun products, approxfunately half the firel oil consrinption could, in theory, have been trmsferred to other fire16, subject to their a%i1abi.lity.
Pattern of conventional themal power planta in EI,R-5, ty type of fuel wbich coulct be used shom as a / of the total installed caprcity (as at 1.'1.1972):
Si[gle fuel plart : l{ulti-fuel plat :
Harat and brm coal 3q" Coal/petrolem 1ry'"
Petroleun products 8ß Qoal/gas 4/.
1972 ATL FTJELS Hard
coal
Bromr coal
Petroleum p r o d u c t s (non-gaseous)
Natural gEs
Derived gases & o t h e r s
EUR-9
in miIllons of tons of petroleum equivalent
1 B B r 2 7 3 r z l B r B 6 9 1 2 1 9 r z 7 r B
EiuR-g Germargr France ftaly Netherland.s Belgiun Luxernbourg United Kingd.om Irela"nd Denmark
t 0 6 t e p 1 8 8 r 2
5 8 r7 2 3 t 7 1 9 t o 1 1 t 3 B r 7 o 1 4 & r 3
1 1 6 4 t 3
100 1 0 0 100 1 0 0 100 100 1oo 100 1 0 0 1 0 0
3 8 t 9 4 2 1 3 2 9 t 5
3 r o
5 A
1 7 , B o r B 6 2 r 6 1 t 3 1 9 t 7
expressed. a
1 o , o I
,l:ll
1 ' o
I
- l
:I
,l' I
3 6 r B 1 4 ; o 52A 8 6 r t 22 14 5 o rB 3211 34 '0 64 rB & 1 3
/"
S
l o r z B r 7 B 1 4 4 t 7 6 9 1 3 1 9 t 9 5 1 1
,:,
CONSIJMPTION OF ELECTRICAI, FXüERGY
(*) Commerce, hanriicrafts, senrices and public authorities.
During recent yearsr eonsumption of electrical energy in the Conmr:nity has increased. by nearly 7 t{" annuallyr equivalent to a cloubling in ten years.
lühile ind"ustry remains the principal consumer, the which is very sensitive to economic fluctuations,
other hand, the stead.y rise of consumption by the (tO to 11/') means that this category of consumers of total demand.
growth of inclustrial consumption, averag€s .just unCer qo. On the d.omestic sector and" tertiary sectors accounts for an increasing proportion 197 2
.gi\TSIJMPTION BY INLÄ]fD
},IARKgiI
T o t a l
industry Transport
Dornestic
U S C S
Other
U S C S
( + )
Per capita consunption I
Total
I of which I d o m e s t i c u s e
EUR-9
841
J
I ut;
(too /") I $r,7 /")
I II zr,o
I
( 2,7 /")
khth 2 1 8 1 6 ( z 6 ro /")
157 t0 ( 1 8 , 6 / " )
in kl'lh
305
B:B( r
4 2 2 l 3 7 4 I I; , ;
-B5o 154 ?40 369 987 o45 9 1 9 o 6 6go2 517 436 751 625 568 554
(8ro)
410) Germarqy France Italy Netherlands Belg:ium Lrr:rembourg United KingCom freland Denmark25215 1 4 6 1 8 1 1 6 r g 4 3 1 2 32t7 2 r 7 2 2 5 r 7 5 r B 1 5 t 3
1 3 7 r 0 8 6 r o 7 4 . 4 2 3 t 2 2 2 1 1
2 1 2 9 2 r o
2 r O 4 1 2
B 1 6 6 1 1
3 ' B
o 1 9 0 r B o r o
,:,
o r 1
55,7
2 6 1 6 2 3 1 6 1 0 , 0 6 1 1 o 1 2 8 6 r 7
( 2 , > )
0 , 2 )
5 1 ,2 2 8 1 1 1 5 t 1 9 r O 3 r B o r 3 M t 3