AIAA 2015-1709
53rd AIAA Aerospace Sciences Meeting, AIAA Science and Technology Forum, 5-9 Jan 2015, Kissimee, Florida
Numerical Simulation of Transonic Circulation Control
M. Forster
∗and R. Steijl
†School of Engineering, University of Liverpool, L69 3GH, U.K.
Simulations of circulation control via blowing over Coanda surfaces at freestreams up to Mach 0.8 are presented. Validation was conducted against experiments performed at NASA on a 6 percent thick elliptical circulation control aerofoil, which demonstrates the necessary grid requirements and compares between two-equation turbulence models of the
k−ω family. It is found that simplifications to the experimental set up are detrimental
to the results. In addition, the performance and sensitivity of several circulation control devices applied to a supercritical aerofoil are presented. It is shown that circulation control has the ability to match the performance of traditional control surfaces during regimes of attached flow at transonic speeds.
Nomenclature
α Angle of Attack, degrees
αAIL Aileron Deflection, degrees A Wing Surface Area, m2
c Chord Length, m
Cd Sectional Drag Coefficient Cl Sectional Lift Coefficient
Cm Sectional Pitching Moment Coefficient Cµ Momentum Coefficient,
˙
mjVj
q∞A
Cp Pressure Coefficient
M Mach Number
˙
mj Jet Mass Flow Rate, kg/s
q∞ Freestream Dynamic Pressure, Pa Re Reynolds Number
U Velocity Component in Streamwise Direction, m/s
UE Velocity at Boundary Layer Edge, m/s Vj Jet Velocity, m/s
y+ Non-Dimensional Wall Distance
Acronyms
AOA Angle of Attack CC Circulation Control
CFD Computational Fluid Dynamics
EARSM Explicit Algebraic Reynolds Stress Model EXP Experiment
FAST-MAC Fundamental Aerodynamics Subsonic/ Transonic-Modular Active Control
GTRI Georgia Tech Research Institute HMB Helicopter Multi-Block CFD Code PR Pressure Ratio
RANS Reynolds Averaged Navier-Stokes SARC Spalart-Allmaras Rotation/Curvature TDT Transonic Dynamics Tunnel
UAV Uninhabited Air Vehicle
∗Ph.D. Student, CFD Laboratory,[email protected]. †Lecturer, CFD Laboratory,[email protected].
1
Abstract
A wind tunnel test was conducted in the NASA Langley Transonic Dynamics Tunnel (TDT) on a six
percent thick slightly cambered elliptical circulation control airfoil with both upper and lower surface
blowing capability. Parametric evaluations of jet slot heights and Coanda surface shapes were conducted
at momentum coefficients (C
μ
) from 0.0 to 0.12. Test data were acquired at Mach numbers of 0.3, 0.5, 0.7,
0.8, and 0.84 at Reynolds numbers per foot of 2.43 x 10
5to 1.05 x 10
6. For a transonic condition,
(Mach = 0.8 at
α
= 3°), it was generally found the smaller slot and larger Coanda surface combination was
overall more effective than other slot/Coanda surface combinations. Lower surface blowing was not as
effective in producing lift and pitching moment increments at transonic conditions as the upper surface
blowing over the same range of momentum coefficients. No appreciable Coanda surface, slot height, or slot
blowing position preference was indicated transonically with the dual slot blowing. Subsonically (Mach =
0.3 at
α
= 6°), it was generally found the smaller slot and smaller Coanda surface combination was more
effective overall than other slot/Coanda surface combinations. At Mach = 0.3 and
α
= 6°, the 1.78:1
Coanda with the upper slot blowing position with a slot height of h/c = 0.0012 gave the maximum
Δ
Cl
generated of 0.75 at a C
μ
= 0.085. At Mach = 0.8 and
α
= 3°, the 2.98:1 Coanda with the upper slot
blowing position having a slot height of h/c = 0.001, slightly outperformed the lower slot position, with the
upper slot generating a maximum
Δ
Cl of 0.25 at a C
μ
= 0.008. Both subsonic and transonic trailing edge
blowing influenced the flow field upstream of the slot.
Introduction
[image:2.612.221.393.64.159.2]Circulation control is considered one of the most efficient methods for lift augmentation at low
Mach numbers (ref. 1). The device augments an airfoil's lifting capability by tangentially ejecting a thin jet
of high momentum air over a rounded trailing edge
(ref. 2). When the jet sheet velocity is greater than the
local external flow, the jet sheet remains attached over the curved surface by means of the Coanda effect
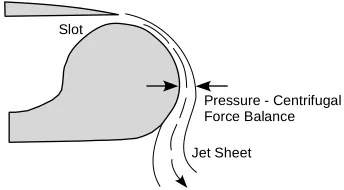
(ref. 3-5). The Coanda effect is created when a tangentially blowing slot ejects a jet sheet of air over a
curved or “Coanda surface” and remains attached to the surface due to a balance between the low static
pressures generated by the jet and the centrifugal force acting on the curving jet (ref. 6) (figure 1). The jet
not only moves the separation point around the trailing edge toward the lower surface of the wing, but also
entrains the external flow field to follow the jet. This entrainment and separation point movement produces
a net increase in the circulation of the wing resulting in lift augmentation (ref. 7).
Figure 1 - Tangential blowing over a Coanda surface.
Numerous experimental circulation control tests using the Coanda effect to enhance lift have been
conducted at subsonic velocities on thick airfoils sections (ref. 8-14). However, a void exists for transonic
data on thin circulation control airfoils. Therefore, it is the focus of this experiment to evaluate the
effectiveness of trailing edge circulation control on a thin airfoil section at transonic Mach numbers. A wind
tunnel test was conducted on a six percent thick slightly cambered elliptical airfoil with both upper and
lower surface slot blowing capability. Parametric evaluations of slot heights and Coanda surface shapes
Slot
Pressure - Centrifugal Force Balance
Jet Sheet
Figure 1: Trailing edge Coanda diagram.2
I.
Introduction
In aircraft, ailerons have traditionally been used to alter the circulation around the wings to generate additional forces about the wings for flight control. Flaps employ a similar principle and are used as high lift devices for take-off and landing. Circulation control is an alternative method of changing the circulation about an aerofoil, which works by blowing a jet of air over a rounded trailing edge of an aerofoil. Circulation control offers advantages over devices such as flaps and ailerons, removing the necessity of moving parts, and at a cost of blowing, possibly a reduction in aircraft weight.1
Circulation control relies on the phenomenon known as the Coanda effect, which describes the behaviour of a fluid moving tangentially to a convex surface. The flow then attaches to the curved surface as a result of the pressure gradients in the flow (see Fig.1). The position of the separation and stagnation points at the trailing and leading edges of the aerofoil are altered due to blowing a jet over the Coanda surface, causing a change in lift.
Circulation control usually requires a high speed jet of air which attaches to the Coanda surface. As this high speed jet meets the lower speed air in the freestream, the jet entrains the fluid of the freestream which is then also turned around the Coanda. The entrainment is due to the fluid in the jet and the freestream travelling at significantly different velocities, and as a result a shear layer forms which presents challenges to turbulence modelling. For aerofoils in the transonic regime, the Coanda jet should be supersonic to influence and entrain the mean flow around the aerofoil. In addition to shear layers there is a possibility of shock boundary-layer interactions occurring on the surface of the Coanda devices, if the jet becomes under-expanded.3 Shock boundary-layer interactions also pose modelling challenges and are often unsteady. Early research in circulation control focussed upon improving the lift of rotor blades with elliptical sections amid development of the X-Wing circulation control concept4 in the early 1980s. Conclusions from early studies suggested that ensuring the jet remains attached to the Coanda surface is not trivial since the system is sensitive to parameters such as slot heights, blowing rates and radii of curvatures of the Coanda surface.
More recently with concerns over aircraft efficiency and environmental impacts, circulation control re-search is being investigated to improve the lifting capabilities of fixed wing aircraft while keeping within the capabilities of existing airport infrastructures.5 On fixed wing UAVs, circulation control research appears to have the potential to replace moving parts and may be used for manoeuvrability control.6
Figure 2: Maximum lift obtained by Englar with different Coanda geometries at range of Mach numbers for
Cµ≤0.08.13
Circulation control at transonic freestream speeds behaves differently to CC in subsonic regimes. This has been attributed to the presence of a shock on the upper surface of the aerofoil12and the effect of Coanda shape.13 Figure 2 shows the lift obtained by Englar13 over a range of Mach numbers, which shows that the larger radius of curvature associated with the "Pure Ellipse" configuration offers greater potential at high speeds for circulation control compared with the approximately circular configuration of the "Rounded Ellipse". Schlecht and Anders14 also found that an elliptical Coanda surface was superior to a biconvex surface for both low subsonic and transonic freestreams.
Research on higher speed transonic circulation control has produced a handful of experiments and nu-merical studies, which mostly took place in the 1980s on aerofoil sections intended for use as a helicopter blade.12,13,15,16 Such experiments were conducted in moderate size wind tunnels, which introduced signi-ficant wall interference effects.17 The elliptical X-Wing type sections typically had maximum thicknesses of approximately 15% chord, which do not have the characteristics of a supercritical aerofoil, as would be used on a fixed wing aircraft. A supercritical circulation control aerofoil has been developed,8 however transonic experiments on this section have not yet been published.
the justification that the ellipse would produce desirable pressure distributions.2
Numerical studies of the X-Wing era often used coupled inviscid-viscous solvers4,18,19or two dimensional Navier-Stokes solvers with algebraic turbulence models.17,20 There remains a distinct lack of comprehens-ive numerical studies using modern techniques for transonic circulation control. As a result, fundamental problems such as grid requirements and turbulence modelling remain largely unanswered.
In 2006, Swanson et.al.21 performed two dimensional RANS simulations of the 16% thick, elliptical 103RE aerofoil,15however the simulations were limited toM = 0.6atα= 0.0. At these conditions, the flow over the aerofoil remained subcritical. It was found that each turbulence model tested (Spalart-Allmaras, Menter SST, Spalart-Allmaras with Curvature Correction and EASM-kω) failed to predict the pressure distribution over the aerofoil surface at M = 0.6. In addition, the separation point of the jet from the Coanda surface was poorly predicted. The SACC model gave reasonable results but only after unrealistic a-posteriori modifications to the baseline model constants.21 Such changes suggest that the predictions of higher speed circulation control flows are not trivial.
The deficiency in transonic circulation control research is highlighted by Millholen et. al.22 when discuss-ing the fundamental aerodynamics subsonic/transonic-modular active control (FAST-MAC) aircraft model. It is stated that the experiments on the FAST-MAC are unique as it will evaluate CC strategies at transonic speeds.22 The FAST-MAC uses a blown flap configuration to enhance lift for take off and landing, and will utilise blowing at cruise for drag reduction.
In experiments on supersonic Coanda jets in still air, Cornelius23 found that a converging-diverging geometry delayed jet detachment and increased the limiting pressure ratio. Other experimental studies have shown that introducing a step between the jet exit and Coanda surface can promote attachment at higher pressure ratios by preventing shock induced separation.24,25
Recent works on compressible shear layers suggest that modelling of the shear layer is significantly more accurate when using an algebraic Reynolds stress model.26 The anisotropy due to the EARSM gives better predictions of the spreading rate of a compressible shear layer and the mean turbulent stresses with a reduc-tion in cost compared with full RSM.26 Such nonlinear Boussinesq models that account for curvature and shear layer anisotropy may be beneficial for accurate steady state RANS simulations of transonic circulation control.
The current work investigates CFD for transonic circulation control aerofoil at Mach numbers up to
M = 0.8, with focus upon validation against the NASA experimental data produced by Alexander et.al.2 The experimental model used a converging supersonic nozzle, flow from which detaches from the Coanda surface for pressure ratios past a limit, depending on slot height and Coanda device geometry. The detachment is due to shock-boundary layer interactions causing separation of the boundary layer as a result of the jet under-expansion.
II.
Objectives
set, studies on a supercritical circulation control aerofoil in the transonic regime are scarce. The performance of the Douglas DLBA032 supercritical aerofoil with a circulation control device will be compared against the characteristics of the aerofoil with an aileron deflection, and also with experiments as published in the AGARD AR-303 technical report.27
Questions over the preferred shape of the Coanda surface and nozzle for transonic circulation control flows also remain. From the lessons learnt throughout the validation exercise, CFD based sensitivity studies will be made on the Douglas DLBA032 to assess the nozzle shape for a given Coanda surface, slot height and blowing momentum coefficient. The effect of a step will also be investigated, which may broaden the range of operating conditions for circulation control.
III.
Navier-Stokes Solver
The Helicopter Multi-Block (HMB) CFD code28–31 was employed for this work. HMB solves the com-pressible, unsteady Reynolds-averaged Navier-Stokes equations on block-structured grids using a cell-centred finite-volume method for spatial discretisation. An implicit time-integration method is employed, and the resulting linear systems of equations are solved using a pre-conditioned Generalised Conjugate Gradient method. For unsteady simulations, an implicit dual-time stepping method is used, which is based on Jameson’s pseudo-time integration approach.32 The solver has a library of turbulence closures which in-cludes several 1 and 2 equation turbulence models and also non-Boussinesq versions of thek−ωmodel.33–36 Turbulence simulation is also possible using either Large-Eddy or Detached-Eddy simulation.
Rather than imposing a jet exit profile, the flow is calculated from the plenum chamber within the aerofoil. This allows for the boundary layer growth and turbulence to develop within the nozzle similarly to the conditions in experiments. Circulation control models typically contain a porous screen within the plenum,2 the position of these screens will help influence the choice of location of a reservoir boundary condition for the simulations. This reservoir condition fixes the pressure and density from the isentropic flow equations for a given pressure ratio, and extrapolates the components of velocity assuming no gradients across the boundary.
IV.
Momentum Coefficient
The supply of air for the plenum for circulation control is often taken from bleed air from the jet engine of the aircraft.6 As a result of this the efficiency of the circulation control device is critical; mass flow taken from the engine reduces the power available for forward thrust.
The jet momentum coefficient (Cµ) is often used as a measure of blowing over a circulation control device,
which is defined as
Cµ =
˙
mjVj q∞A
(1) wherem˙j is the mass flow rate through the slot exit andA is the surface area of the aerofoil. In circulation
control experiments, m˙j is usually measured using a flow venturi meter and Vj calculated from isentropic
4
Figure 3 - Baseline elliptical airfoil section.
Reference Chord
The CCA sectional profile was sized with a 30 inch chord length without a Coanda surface. In order to have a consistent non dimensional nozzle height parameter (h/c), it was decided to establish the chord length of each CCA trailing edge configuration as seen in table 1.
Table 1 - CCA chord lengths for each Coanda surface.
CCA Planform Characteristics
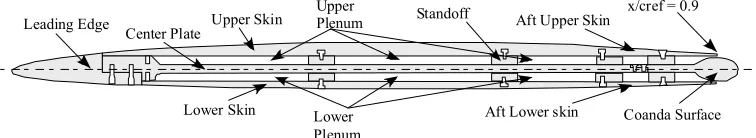
[image:6.612.118.496.64.133.2] [image:6.612.113.496.177.249.2]The CCA section is a simple six percent thick elliptical airfoil having 0.75 percent camber (figure 4). The model span (b) is 60 inches with zero leading and trailing edge sweep. A reference chord (cref) of 30 inches gave the model an aspect ratio of two and a taper ratio of one. Common practice for testing semispan models on a reflection plane is to refer to this as an aspect ratio four wing. To accommodate the trailing edge Coanda surfaces, the reference airfoil was truncated at x/cref = 0.90 (27 inches). The CCA model tip was capable of accommodating either a 30 inch diameter circular end plate to promote two dimensional flow or a "t/2" tip used to evaluate three dimensional effects.
Figure 4 – Typical CCA airfoil section.
Coanda Surface Definition
Three elliptical trailing edge surfaces (referred to as Coanda surfaces) were manufactured with length to height ratios of 1.78:1, 2.38:1, and 2.98:1 (as illustrated in figure 5) and installed on the CCA model shown in figure 6. The minor axis of the Coanda surface was aligned with the slot exit to ensure the minimum exit area occurred at the exit (x/cref = 0.9). The horizontal axis of the ellipse was mapped to the camber line of the elliptical airfoil and formed a 5 degree converging nozzle at the exit. The Coanda surface spanned the entire model (60 inches). Table 2 lists the Coanda surface characteristics.
30-inches
27-inches
Upper Skin
Lower Skin Center Plate
Aft Lower skin Aft Upper Skin
Coanda Surface Leading Edge UpperPlenum Standoff
Lower Plenum
x/cref = 0.9
y/b 1.78:1 2.38:1 2.98:1 0.5 27.82-in. 28.09-in. 28.36-in.
Coanda
Figure 3: Schematic of the NASA 6% elliptical circulation control aerofoil.2
Figure 5 - Coanda surfaces.
Figure 6 - Coanda surface installed - end view.
Suggested guidelines from reference 15 for Coanda surface radii of curvatures are listed in table 2. It was not possible to meet the entire guideline radius of curvatures on a six percent thick airfoil, and it was decided preference would be given to the slot radius of curvature in an effort to achieve initial attachment of the jet flow. For this reason, a family of elliptical Coanda surfaces was chosen which has larger slot radii of curvature and small trailing edge radii of curvature.
Table 2 - Coanda Radius and Slot Height Dimensions.
Slot Definition
Three upper and lower slot heights for each Coanda surface were possible for this wind tunnel
Chord (in.) 1.78 : 1 2.38 : 1 2.98 : 1
h1/rs 0.024 0.014 0.009 1.78 : 1 2.38 : 1 2.98 : 1
h2/rs 0.039 0.022 0.014 Chord (in.) 27.82 28.09 28.36
h3/rs 0.051 0.028 0.018 rs (in.) 1.44 2.57 4.02 h1/rTE 0.14 0.18 0.23 rTE (in.) 0.25 0.19 0.15 h2/rTE 0.22 0.30 0.37 rs/c 0.052 0.091 0.142 h3/rTE 0.29 0.38 0.48 rTE/c 0.009 0.007 0.005
h/r r/c
Coanda
Coanda
0.02 to 0.06 0.01 to 0.08
Guidelines Guidelines
1.78:1 x/cref = 0.9
2.38:1
x/cref = 0.9 x/cref = 0.9
2.98:1 r
TE
rs
Figure 4: Coanda geometries used in the experiment.2
V.
NASA Experiment Validation Case
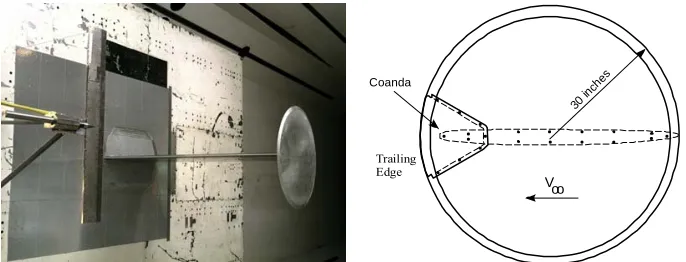
Alexander et.al.2 performed a range of experiments on a 0.75% cambered elliptical aerofoil with a thickness of 6%chord (Fig. 3). The span of the wing model was 2 chord lengths, with the end plate at 1 chord length in diameter. Comparisons were made between geometries of elliptical Coanda surfaces with different slot heights at freestream speeds ofM = 0.3andM = 0.8with Reynolds numbers of1.0−2.5×10⁶ per chord. The baseline aerofoil trailing edge was truncated at90%chord and replaced with elliptical Coanda surfaces with varying aspect ratios (Fig.4).
An extensive set of results have been published in the NASA technical report following the experimental investigations.2 Since the only unblown configuration published was for the largest 2.98:1 elliptical Coanda surface with a slot height to chord ratio of 0.12%, the numerical studies presented here have been conducted solely on this geometry. The geometry used was based upon descriptions in reports of the model regarding this dataset2,14,37and experimental data was digitised from plots in Ref. 2. Errors due to the interpretation of the model descriptions and limited accuracy of digitising the published data can be expected. In addition, Alexander et. al.2 state in the technical report that the data presented was unmodified. It is possible that some minor flow angle/Mach number corrections from wall interference or blockage effects may be required. For the present study, the freestream parameters given in the report (Table1) are used for the simulations. To minimise the finite span effects in the experiments, an end plate was used on the aerofoil which is shown in Fig. 5. An investigation into the finite span effect was carried out by Alexander et. al.2 who compared results between experiments using a "t/2" rounded wingtip and the endplate. The wingtip was circular with a diameter equal to the local aerofoil thickness. It was shown that the endplate did not produce a strong effect as the Cl−α behaviour was similar for both configurations. This suggests that the three
dimensional effects of the "t/2" wingtip were still present in the endplate case, and that modelling the wing as a finite span is crucial to generating accurate solutions.
V.A. Boundary and Initial Conditions
7 End Plate
[image:7.612.133.476.55.186.2]The purpose of the circular end plate was to promote two dimensional flow across the span so the chordwise pressure measurements at mid chord would represent the performance of a two dimensional, infinite span airfoil. As seen in figure 9, the end plate is a 30 inch diameter circular plate constructed from a 0.25 inch thick aluminum plate with the outside edge beveled. The forward edge of the end plate was flush with the airfoil leading edge and centered vertically with the airfoil. This resulted in the end plate extending past the trailing edge of the airfoil by 1.7 to 2.3 inches, depending on which Coanda surface was installed. A removable cutout located at its trailing edge was used to allow Coanda surface removal and replacement. The design of the end plate was based on sizing criteria found in reference 16.
Figure 9 - CCA end plate.
t/2 Tip
A “t/2 tip” was designed to close out the airfoil in a manner representative of a three dimensional wing (figure 10). The rounded tip had a radius equal to one half the local thickness and is referred to as the “t/2 tip” configuration. The data acquired from this configuration were used to evaluate the effects of the end plate.
Figure 10 - CCA "t/2 tip”.
Internal Plenum
As seen in figure 11, the airfoil section is divided into contiguous, separate, and isolated upper and lower plenums. The ratio of the slot height to plenum height ranged from 3.8 to 12.8 depending on the slot
Trailing Edge
30 inch
es Coanda
Voo
Figure 5: End plate diagram and experimental model photo in the NASA TDT wind tunnel.2
coloured red and the end plate is blue with orange highlighting the bevelled edge. The aerofoil and end plate are both given a solid, no-slip wall boundary condition. The cylindrical farfield is 10 chords from the centre of the aerofoil in the radial direction and 7 chord lengths from the root in the spanwise direction. In comparison, the TDT upper and lower walls are 3.2 chord lengths from the centre of the aerofoil with the side wall 5.2 chord lengths from the root. A similar CFD study37 used a cuboid shape domain with edges of length22×22×10chord and the model was placed in the centre of the domain.
The freestream flow conditions are summarised in Table 1. The Reynolds number is based upon the original chord length of the unmodified ellipse. All plots shown have been rescaled with the maximum length of the modified aerofoil with the elliptical Coanda device (see Fig.7).
Table 1: Freestream flow parameters used in the simulations of the NASA 6% experiment.
Freestream Mach 0.3 0.8
Reynolds Number 1.0×10⁶ 2.5×10⁶ Angle of Attack 3.0 & 6.0 degrees 3.0 degrees
V.B. Multiblock Structured Grid
Conclusions from preliminary two-dimensional studies suggested that the entire wind tunnel model is required to be modelled for the simulations. Flow angle corrections were necessary to achieve a fair agreement in two-dimensional cases without blowing, which is a manifestation of finite span and possibly wall interference effects.
The geometry allowed for an ‘O’-type grid topology to be created, which can be seen in Fig.7. The end plate is also shown in Fig.7which is 1.1 chord in diameter. Whilst the experimental setup had an end plate with a diameter of 1.0 chord, enlarging the plate for the simulations allowed for the structured blocks to wrap around the leading edge of the aerofoil while also resolving the flow around the end plate. This was expected to induce some changes relative to the listed geometry, however the effects were assumed to be minor.
V.B.1. Grid Refinement
Figure 6: View of the computational domain showing the boundary conditions used.
x/c
y
/c
0 0.2 0.4 0.6 0.8 1
-0.3 -0.25 -0.2 -0.15 -0.1 -0.05 0 0.05 0.1 0.15 0.2 0.25 0.3
In the preliminary two-dimensional investigations of the current study, a grid refinement study was performed which found that 384 cells along the aerofoil, 128 over the Coanda surface and 64 in the wall normal direction were adequate to resolve the flow for both unblown and blown configurations. This distribution was applied to the three dimensional grid, with 256 cells over the span of the aerofoil, 33 over the breadth of the end plate, and 64 between the end plate and the farfield. The total grid size for the finest grid with and without blowing were27×106and28×106, respectively on a multi-block structured grid with approximately 230 blocks. The first grid point for the mesh had ay+ ≈1.0 over most of the solid walls, buty+ ≈2.0 in the radial direction of the end plate to reduce computational expense.
This grid was coarsened such that the total number of cells were approximately halved, which required a refinement factor of approximately 0.8 along each block edge. The cell sizes on wall faces were retained to give y+≈1.0 on the majority of the surfaces, as with the fine grid. Along the nozzle exit, the fine grid has a uniform distribution of 64 cells with a height ofy+≈1.5, determined from the freestream conditions. This uniform distribution was also maintained for the medium and coarse grids which gave a cell height of
y+≈1.9 andy+≈2.4, respectively.
Figure 8 shows a comparison of pressure coefficients between the coarse, medium and fine grids with blowing atCµ= 0.0051. There is negligible difference in the pressure distribution between the medium and
fine grid on the upper surface of the aerofoil and the Coanda surface. As shown in Fig.8athe shock position is predicted further towards the leading edge with the coarsest mesh, this is possibly due to the boundary layer being under resolved and as a result artificially high turbulent viscosity levels were produced.
V.B.2. Splitter Plate
Table 2: Grids used throughout the study of the NASA test case.
Grid Blown Unblown
Coarse 6.94×10⁶
Med 13.93×10⁶ 13.41×10⁶
Fine 28.31×10⁶ 27.26×10⁶ Visc Splitter 24.12×10⁶ 23.50×10⁶
A similar study on a jet flap configuration37 suggested that modelling of the viscous wall of the splitter plate was necessary for more accurate solutions. Using the medium grid described above, an edge was cut to allow for a circular splitter plate with a diameter of 6 chord lengths. The original technical report2 did not include the dimensions of the rectangular splitter plate used at NASA Langley, however Cruz and Anders37 also used a circular splitter plate with a 3 chord diameter. Including a larger splitter plate should create a thicker boundary layer on the splitter plate and so the effect of the splitter will be magnified.
The densities of the medium grid over the aerofoil and end plate were maintained for the grid with the splitter plate included. However, in order to resolve the flow over the splitter plate, the mesh required some refinement to account for the viscous effects of the splitter plate. Table2 summarises the total cell count of the grid including the viscous splitter plate. The first cell normal to the splitter plate and along the circular edge had a length ofy+≈1.0, this can be seen in Fig.9
x/c
Cp
0 0.2 0.4 0.6 0.8 1
-1.2
-1
-0.8
-0.6
-0.4
-0.2
0
0.2
0.4
0.6
0.8
1
1.2
Exp C =0.003 Upper K- Coarse PR3 K- Med PR3 K- Fine PR3
Cp*
(a) Pressure distribution over the main aerofoil surface.
x/c
Cp
0.94 0.96 0.98 1
-1.2
-1
-0.8
-0.6
-0.4
-0.2
0
0.2
Exp C =0.003 Upper K- Coarse PR3 K- Med PR3 K- Fine PR3
Cp*
(b) Distribution over the Coanda surface.
Figure 8: Coefficients of pressure with blowing at Cµ ≈ 0.0051 for grids with approximately 7 , 14 and
28×106 block structured cells, using the standardk−ω turbulence model.
x/c
Cp
0 0.2 0.4 0.6 0.8 1
-1.2 -1 -0.8 -0.6 -0.4 -0.2 0 0.2 0.4 0.6 0.8 1 1.2 EXP Unblown 2D K- 2degAOA K- Med K- VSplitter
(a) Unblown case, comparing 2D and 3D simulations and the effect of a splitter plate.
x/c
Cp
0 0.2 0.4 0.6 0.8 1
-1.2 -1 -0.8 -0.6 -0.4 -0.2 0 0.2 0.4 0.6 0.8 1 1.2 EXP Unblown EXP C =0.008 K- PR3 Med K- PR3 Vsplitter K- Vsplitter
(b) Comparing the effect of a splitter plate with blowing
atCµ≈0.0051.
Figure 10: Pressure coefficients comparing the impact of simplifications to the model.
With a splitter plate, the upper surface shock position moves forwards, bringing the predicted pressure distribution closer to the experimental data. This is also the case for the lower surface pressure coefficients. The effects of the viscous splitter wall is highlighted in Fig.11, which shows that the iso contours of critical
Cp∗ curve towards the viscous wall. The shock strength also appears to be lessened with modelling of the
splitter plate. The effect of the splitter plate is more pronounced when blowing over the Coanda surface, Fig.10bshows that the shock position on the upper surface of the aerofoil moves towards the leading edge by approximately 5% chord. Modelling the splitter plate seems to have little effect on the pressure distribution on the Coanda surface on sections about the mid span position.
V.C. Results
Figure12shows the surface pressure coefficients about the mid span section of the aerofoil at Mach numbers 0.3 and 0.8 for an angle of attack at 6 and 3 degrees. AtM = 0.3the lower surface pressure distribution gives good agreement with the digitised experimental data. The suction of the upper surface is over-predicted slightly in the leading 20% of the section, while the rear 80% gave more favourable agreement.
ForM = 0.8, the simulated results show a slightly higher pressure level over the lower surface than the experiment, as shown in Figure12. This difference however decreased when incorporating the splitter plate. The difference in pressure coefficient appears to be constant over the aerofoil chord, possibly suggesting that some of the difference may be due to an error from the digitising process, or perhaps a discrepancy in aerofoil shape. A shock is predicted on the upper surface at approximately 20% chord, while experimentally it is captured at 10%. This may be due to an under-prediction of the turbulence on the aerofoil upper surface. Figure 12 also shows the critical pressure coefficient for M = 0.8. In addition, the experimental model included a boundary layer trip strip2which promoted turbulent transition of the boundary layer and hence an increase in boundary layer thickness. This tripping effect was not modelled in the current study.
With blowing andM = 0.3freestream, the predicted pressure coefficient on the lower surface for blowing atCµ= 0.0364falls between the experimental data forCµexp= 0.016andCµexp= 0.054, as shown in Fig.13a.
(a) Using symmetry plane. (b) With viscous splitter wall.
Figure 11: Isosurfaces of pressure coefficient at criticalCp∗ ≈ −0.43forM = 0.8, without blowing.
x/c Cp
0 0.2 0.4 0.6 0.8 1
-3
-2.5
-2
-1.5
-1
-0.5
0
0.5
1
Exp M=0.3 =6 Exp M=0.8 =3 CFD M=0.3 =6 CFD M=0.8 =3
Cp*
Cpthan the experimental case atCµexp= 0.054. On the Coanda surface (Fig.13b), the pressure distribution
follows the trends of the experiment with blowing at Cexp
µ = 0.042. A peak in pressure at approximately x/c = 0.96 is captured with reasonable accuracy by the simulation. The experimental data presented in Fig.13b shows that an approximate linear increase in blowing coefficient produced an approximately linear decrease inCpatx/c≈0.995. The simulated pressure coefficient at this location for blowing atCµ= 0.0364
falls between0.029≤Cµexp≤0.042.
Contours of Mach number along the centre span for the unblown and blown cases are shown in Fig. 14. The favourable pressure gradient caused by blowing over the Coanda appears to have reduced the thickness of the boundary layer on the upper surface of the aerofoil. Figure14dshows the Mach contours for blowing atCµ= 0.0051, where the jet can be seen to be under expanding. A small separation bubble is present near
the slot exit, caused by a shock wave due to the expansion of the jet flow. The Coanda flow re-attaches following the separation bubble, however it is expected that the jet will break away from the Coanda surface due to this shock for higher plenum pressure ratios which would increase the under expansion.
Figure 15 shows the boundary layer profiles on the upper surface of the aerofoil at approximately 94% chord, which is approx 1% chord upstream of the slot exit. As shown in Fig.14, the boundary layer of the blown cases are thinner than the unblown case. There appears to be little difference between the oncoming flows of thek−ω and the SST models with blowing atCµ= 0.0069, suggesting that any differences in this
case are possibly due to the model behaviour in the shear layer.
Figure 16 shows that there is little difference between the standard and the SST k−ω models at low blowing rates on the aerofoil surface. With blowing, the shock moves towards the trailing edge in both the experiment and with the numerical simulations, however the predicted shock location is approximately 20% chord further aft than the experiment (Fig. 16a). The upper surface shock is moved further aft with additional blowing.
Figure 16b shows the pressure coefficient distribution over the Coanda surface with blowing. AtCµ =
0.0051, the pressure over the upper surface of the Coanda resembles the distribution measured in the ex-periment withCexp
µ = 0.004. As the blowing rate increased to Cµ = 0.0069, the pressure distribution over
the Coanda surface is within the bounds of the experiment at0.006≤Cexp
µ ≤0.008. For higher momentum
coefficients, a discrepancy between models appears on the Coanda surface (Fig. 16b), which mainly is the effect of a difference in the separation behaviour of the jet from the Coanda surface. Although the models are typically known to produce differences in behaviour in shock-boundary layer interactions: the standard
k−ω model typically under-predicts the size of a separation bubble while the SST tends to over-predict the bubble size,38,39the shock boundary lager interaction created by the under-expansion of the jet did not significantly create differences between the models. The behaviour of the SST model in regions away from walls is similar to thek− model,34 which tends to perform well in free shear layers,40 which for the jet created over the Coanda surface could be expected to lead to a difference in the shock-shear layer interaction in the under-expanded jet. The differences between the models is subject for more detailed investigations in future work.
Lower surface pressure coefficients were not included in the NASA report for Cexp
µ <0.008, however at Cexp
µ = 0.014 the Coanda surface flow is attached and has a lower surface pressure distribution unchanged
fromCµexp= 0.008.2
At the highest blowing rate simulated (Cµ = 0.0085), unsteadiness was observed in the residual of the
x/c
Cp
0 0.2 0.4 0.6 0.8 1
-3.5
-3
-2.5
-2
-1.5
-1
-0.5
0
0.5
1
Exp C =0.016 Exp C =0.029 Exp C =0.054 K- M=0.3 =3deg PR3
(a) Aerofoil surface.
x/c
Cp
0.94 0.95 0.96 0.97 0.98 0.99 1 -4
-3.5
-3
-2.5
-2
-1.5
-1
-0.5
0
0.5
Exp C =0.029 Exp C =0.042 Exp C =0.054 K- M=0.3 =3deg PR3
(b) Coanda surface.
Figure 13: Comparing simulated pressure distribution atCµ= 0.0364,M = 0.3andα= 3on the grid with
(a) Without blowing. (b) Without blowing.
(c) Blowing atCµ= 0.0051. (d) Blowing atCµ= 0.0051.
(e) Blowing atCµ= 0.0069. (f) Blowing atCµ= 0.0069.
(g) SST blowing atCµ= 0.0069. (h) SST blowing atCµ= 0.0069.
U/UE
y
/c
0 0.2 0.4 0.6 0.8 1
0 0.005 0.01 0.015 0.02 0.025 0.03 0.035 0.04 0.045
K- Unblown K- PR3 K- PR4 SST PR4
99% UE
Figure 15: Comparing boundary layers on the upper surface of the aerofoil atx/c= 0.9415between solutions without blowing and blowing atCµ= 0.0051andCµ= 0.0069.
x/c
Cp
0 0.2 0.4 0.6 0.8 1
-1
-0.5
0
0.5
1
EXP C =0.003 EXP C =0.008 K- VSplitter PR3 K- VSplitter PR4 K- SST VSplitter PR3 K- SST Vsplitter PR4
Cp*
(a) Pressure distribution over the main aerofoil surface.
x/c
Cp
0.94 0.95 0.96 0.97 0.98 0.99 1 -1.6
-1.4
-1.2
-1
-0.8
-0.6
-0.4
-0.2
0
0.2
EXP C =0.004 EXP C =0.006 EXP C =0.008 K- VSplitter PR3 K- VSplitter PR4 K- SST VSplitter PR3 K- SST Vsplitter PR4
Cp*
(b) Distribution over the Coanda surface.
Figure 16: Coefficients of pressure with blowing at Cµ ≈ 0.0051, and Cµ ≈ 0.0069 on the grid with the
VI.
Supercritical DLBA032 Aerofoil with Circulation Control
Supercritical aerofoils are typically used on transonic aircraft. The profile of supercritical aerofoils permits a flat, prolonged suction region on the upper surface and a ’rear loading’ on the lower surface at cruise conditions. The shock strength on the upper surface is designed to be weaker on a supercritical aerofoil when compared with transonic aerofoils with a different design, such as a symmetric aerofoil with the same relative thickness.
Wood and Nielsen41 discuss that the boundary layer thickness of the outer flow approaching the jet slot affects the lift augmentation from the Coanda device, due to the difference in jet momentum and the aerofoil boundary layer momentum deficit. Since the shock wave on the upper surface of a supercritical aerofoil is comparatively weaker than the shock on an elliptical aerofoil, the boundary layer characteristics are likely to be different.
The supercritical DLBA032 aerofoil section was chosen from the AGARD CFD validation database27due to the availability of experimental data with an aileron deflection in a transonic freestream. The McDonnell Douglas DLBA032 is a supercritical aerofoil with a thickness of 12% chord and an aileron of 25% chord length. Experiments were conducted at a Reynolds number range of Re = 5×10⁶ to Re = 25×106, an aileron deflection of αAIL =−5 to αAIL = 5and M ≈0.72. A boundary layer trip was used to promote
transition and thickened the boundary layer.
Two dimensional simulations were conducted on this geometry since the original dataset was reported to be suitable for two-dimensional simulations.27 The data presented in the AGARD report included corrections regarding the wind tunnel interference. Grids were built using mesh densities and refinement strategies using conclusions from the NASA test case study.
The DLBA032 was modified to include a Coanda device by increasing the thickness of the trailing edge along the camber line. The rear 30% of the aerofoil was thickened to change the trailing edge thickness from 0.55% in the baseline aerofoil to 1.23% to accommodate a Coanda surface. Figure 17 shows the original aerofoil with the deflected aileron and the modified geometry with circulation control.
VI.A. Without blowing/Aileron deflection
Figure18shows the pressure distributions for the DLBA032 with an undeflected aileron and a deflection of 3 degrees. Without the deflection the lower surface pressure distribution agrees well with the experimental
65
CASE NUMBER A-5
GENERAL ARRANGEMENT
aileron hinae line
Y'Deflected Aileron
0 Pressure Orifice
CONFIGURATION DETAILS
The supercritical section has a simple aileron that smoothly fits into the mainplane geometry (with a small gap o f 0.254mm). The aileron can be set to fixed deflections of
-2. -5" (trailing edge up) 1, 2, 3, 4, 5" (trailing edge down) The overall configuration has dimensions
Chord = 0.254 m Span = 0.381 m Hinge-line = 75% chord
There are 80 surface pressure holes, mainly arranged on the aileron an upper surface shock.
the range of positions of the
FLOWS MEASURED
269 separate cases have been tested, whose conditions are given by Mach number Reynolds No Aileron deflection (")
0.717 5.0 x 10⁶ 0, 2, 3. 4
- 5 , - 2 , 0 , 1, 2, 3.4, 5 0 717
0 717 25 0 x 106 0 2 3 4 5 15 0 x 106
0.747 15.0 x lo6 - 5 , - 2 , 0 , 1 , 2 , 3 , 4 , 5
with a sweep of up to 12 incidences in the range -0.5 to 3.0' (in increments o f order 0.25") for each o f the above. Those cases highlighted by the figures in the main report are considered to make a good subset of data for a limited validation.
(a) Original geometry with aileron deflection.27
(b) Modified geometry with circulation control device.
Figure 17: Douglas DLBA032 geometry.
17 of28
data, and the shock location is within 5% chord (Fig. 18a). The upper surface suction is greater than the experiment, however the overall trend agrees. Table 3 shows that with the SST model, the change in lift is approximately 3% above the measured lift from the experiment. With the deflected aileron, the suction near the leading edge is over-predicted, and the shock is predicted approximately 15% aft of the experiment, as shown in Fig. 18b. A similar finding was found by Londenberg42 for Re = 5×10⁶ with a 2 degree aileron deflection. The agreement in the lift coefficient as shown in Table 3 is approximately 11% above the experimental data, due to the poor prediction of the shock location. It is emphasised however in the AGARD report that there is some uncertainty about the correction methods employed and that the dataset should be taken for qualitative trends.27
To establish that the modifications made to the DLBA032 did not significantly change the behaviour of the aerofoil, the unblown case was compared with the un-deflected aileron over a range of angles of attack. Figure 19shows the pressure coefficients and drag polars for the DLBA032 without aileron deflection and with a circulation control device fitted as shown in Fig. 17b. The shock position of the CC geometry is slightly further aft which induces greater lift than the original shape as shown in Table 3. The shape of the lift-drag polar in Fig.19bsuggests that the effects of the thickened trailing edge and circulation control device are minimal.
Table 3: Conparing sectional lift, drag, and pitching moment behaviour of the DLBA032 atM ≈0.715and
Re≈5×10⁶ with and without aileron deflection.
Configuration Turbulence model Cl Cd Cm
EXPα= 1.342 αAIL= 0 0.7311 0.01044 -0.1518
CFDα= 1.342αAIL= 0 k−ω 0.7823 0.0167 -0.1614
CFDα= 1.342αAIL= 0 SST 0.7593 0.0158 -0.1567
CFD Unblown Coanda α= 1.342 k−ω 0.8251 0.0183 -0.1710 CFD Unblown Coanda α= 1.342 SST 0.8071 0.0175 -0.1672
EXPα= 1.183 αAIL= 3 0.8931 0.01416 -0.1787
CFDα= 1.183αAIL= 3 k−ω 1.0460 0.0236 -0.2073
CFDα= 1.183αAIL= 3 SST 0.9942 0.0221 -0.1962
VI.B. Sensitivity Study
The detachment phenomena is often attributed to shock boundary layer interactions between shock waves emanating from the under-expanded jet and the Coanda surface boundary layer. Others suggest that if the rate of curvature of the Coanda at the slot exit is sufficiently high, then an adverse pressure gradient forms that is sufficient to separate the boundary layer. This sensitivity study will asses several different designs to minimise the effects of shock boundary layer interactions and the radius of curvature induced separations.
The initial trailing edge design used a circular Coanda surface with a 0.5% chord radius and 0.05% chord slot height (10:1 Coanda radius to slot height ratio). The design allowed for slots on the upper and lower surface, however the current investigations use upper slot blowing exclusively. Between the slot and upper surface of the aerofoil, a thickness of 0.06% chord was applied as a skin thickness. This skin thickness was maintained for all subsequent shape modifications to ensure comparisons between geometries which were not affected by a change in this parameter.
Each circulation control case considered was simulated at a freestream value of α= 1.342, M = 0.716
x/c
Cp
0 0.2 0.4 0.6 0.8 1
-1.5 -1 -0.5 0 0.5 1 1.5
DLBA032 AIL=0 M=0.716 =1.342 Re=5.028e6
KW SST
WILCOX2006 Clim=1
Cp*
(a) Without deflection,α= 1.342.
x/c
Cp
0 0.2 0.4 0.6 0.8 1
-1.5 -1 -0.5 0 0.5 1 1.5
DLBA032 AIL=3 M=0.715 =1.183 Re=5.083e6
KW SST
WILCOX2006 Clim=1
Cp*
(b) 3 degree aileron deflection,α= 1.183.
Figure 18: Experimental and predicted pressure distribution for the DLBA032 with and without aileron deflection atM ≈0.715,Re= 5×10⁶.
x/c
Cp
0 0.2 0.4 0.6 0.8 1
-1.5 -1 -0.5 0 0.5 1 1.5
DLBA032 AIL=0 M=0.716 =1.342
KW Original Shape SST Original Shape KW CC Unblown SST CC Unblown
Cp*
(a) Pressure coefficients.
CD
CL
0.01 0.015 0.02 0.025 0.03 0.035 0.4 0.5 0.6 0.7 0.8 0.9 1 1.1 1.2 Exp CFD Original CFD Thick TE
(b) Lift-drag polar using simulations from the standard
k−ωmodel.
VI.B.1. Converging nozzle with 10:1 radius to slot ratio
The simulated pressure coefficients for the DLBA032 aerofoil with a circular Coanda device with 10:1 radius to slot ratio are compared with an aileron deflection of 3 degrees in Fig.20. As with the NASA 6% elliptical circulation control aerofoil results, the shock moves aft with blowing which is consistent with an increase in lift and circulation. The symbols in Fig.20represent the simulated results of the aileron case at the same conditions.
Comparing the predicted results of the aileron deflection and blowing over the 10:1 configuration, the lower surface and the front section of the aerofoil have similar pressure distributions. The rear section of the aerofoil with blowing has more suction, and does not have the characteristic peak in suction at the hinge line. This additional suction towards the trailing edge has generated an increase in the ’nose down’ pitching moment, as can be seen in Table4.
With increased blowing, the sectional lift, drag and pitching moments on the aerofoil increase. However additional blowing results in detachment of the jet from the Coanda surface, due to the increased under expansion of the jet. ForCµ= 0.004 the jet separated from the Coanda surface, however in this case the jet
re-attached to the surface. This re-attachment may be due to the low pressure within the separated bubble, as shown in Fig. 21a. In Fig.21b, pressure coefficients using a higher blowing rate is shown. The shock impinging on the Coanda surface is possibly too strong for the flow to re-attach to the Coanda. As seen in Fig.21b, the separation bubble does not form and so the mechanism to re-attach the jet is not present.
The lift characteristics for blowing at Cµ= 0.003suggest that it is possible to replicate the lift achieved
with a 3 degree aileron deflection using circulation control in this flight regime. For this configuration, blowing rates between0.004≤Cµ≤0.005caused detachment of the jet.
Table 4: Lift, drag, and pitching moment behaviour of the DLBA032 with the 10:1 Coanda surface at
M = 0.716,α= 1.342 andRe= 5.028×10⁶.
Configuration Turbulence model ∆Cl ∆Cd ∆Cm Cµ αAIL= 3.0 k−ω 0.2576 0.0073 -0.0388 0
αAIL= 3.0 SST 0.2213 0.0063 -0.0301 0
10:1 PR3 k−ω 0.3070 0.0100 -0.0632 0.0030
10:1 PR3 SST 0.2399 0.0073 -0.0458 0.0030
10:1 PR4 k−ω 0.4566 0.0192 -0.1036 0.0040
10:1 PR4 SST 0.3291 0.0112 -0.0653 0.0040
10:1 PR5 k−ω 0.0160 0.0017 0.0077 0.0050
10:1 PR5 SST 0.0061 0.0018 0.0097 0.0050
VI.B.2. Converging nozzle with 21:1 radius to slot ratio
The effect of changing the slot height to radius ratio was investigated by halving the slot height of the 10:1 Coanda trailing edge device, resulting in a surface with a radius and slot height of 0.525% and 0.025% chord lengths respectively. Using the plenum pressure ratio of 5.0 was found to detach the jet from the 10:1 geometry, while with the 21:1 radius the jet remained attached.
x/c Cp
0 0.2 0.4 0.6 0.8 1
-1.5
-1
-0.5
0
0.5
1
1.5
K- AIL=3
K- PR3 K- PR4 K- PR5 Unblown
Cp*
Figure 20: Predicted pressure coefficients for Douglas DLBA032 at α = 1.342, M = 0.716 and Re = 5.028×10⁶ for an aileron deflection and with blowing at C
µ ≈0.003, Cµ ≈0.004 andCµ ≈0.005 for the
10:1 configuration. Symbols here represent the simulated pressure distribution of the deflected aileron case at the same freestream conditions and turbulence model.
(a)Cµ= 0.004 (b)Cµ= 0.005.
Table 5: Comparing the Lift, drag, and pitching moment behaviour between the 10:1 and 21:1 Coanda devices atM = 0.716, α= 1.342andRe= 5.028×10⁶.
Configuration Turbulence model ∆Cl ∆Cd ∆Cm Cµ
10:1 PR4 k−ω 0.4566 0.0192 -0.1036 0.0040
10:1 PR4 SST 0.3291 0.0112 -0.0653 0.0040
21:1 PR5 k−ω 0.3923 0.0145 -0.0809 0.0025
21:1 PR5 SST 0.3261 0.0110 -0.0610 0.0025
21:1 PR6 SST 0.3557 0.0125 -0.0663 0.0031
21:1 PR7 SST -0.0050 0.0011 0.0177 0.0036
VI.B.3. Converging-diverging nozzle with 21:1 radius to slot ratio
To limit the under-expansion of the jet, a converging-diverging nozzle can be used to expand the flow to the ambient pressure. Cornelius and Lucius23 showed that a simple converging-diverging nozzle extends the range of operating pressures at which the Coanda jet remains attached. Bevilaqua and Lee43 reported on a method of characteristics design approach which skews the velocity and pressure profile along the jet exit such that the pressure and velocities at the Coanda surface are lower and higher, respectively. Using the radial velocity and pressure profiles of an irrotational vortex at the slot exit influences the jet to adhere to the surface.43
Bevilaqua and Lee’s43 method of characteristics approach fixes a desired Mach distribution along the slot and solves the two dimensional characteristics equations to determine the nozzle wall profiles to the nozzle throat for a given pressure ratio. This method of characteristics procedure was applied to the 21:1 configuration to design a nozzle to perform at a pressure ratio of 7.0. At this pressure ratio, flow from a purely converging nozzle failed to attach, as described in SectionVI.B.2.
Figure 22 shows the geometry, Mach and pressure coefficient contour plots of the converging diverging nozzle at the design condition. In Fig. 22a, a small separation bubble appears on the Coanda surface. Figure 22b shows that a relatively weak shock occurs at the slot exit and that there is some evidence of shock cells in the jet.
Although the nozzle was designed to fully expand the jet, the used method of characteristics did not account for the boundary layer. The effective nozzle contour as seen by the flow, due to the displacement thickness, was found to significantly reduce the expansion rate and so the jet under-expanded. This can be seen from the Mach number profile at a station just upstream of the slot exit in Fig.23, where the theoretical irrotational vortex profile is also shown. The SST model predicted a thinner boundary layer than that of thek−ω, however both models gave a slope similar to the idealised profile at a reduced value for the mean Mach number.
For a pressure ratio of 9.0, the jet emanating from the converging-diverging nozzle under-expands, however the magnitude of under-expansion is lessened by the nozzle. This allows the jet to adhere to the Coanda surface and gives a lift increment of∆Cl= 0.4077using the SST model, as shown in Table6.
VI.B.4. Converging nozzle with a step and 20:1 radius to slot Coanda surface
(a) Mach contours. (b) Contours of pressure coefficient.
Figure 22: Converging diverging nozzle designed for pressure ratio of 7.0 with a 21:1 radius to slot ratio with blowing at design (Cµ= 0.0032).
Mach Number
S
c
a
le
d
S
lo
t
H
e
ig
h
t
0 0.5 1 1.5 2
0 0.2 0.4 0.6 0.8 1
SST Profile K- Profile Theoretical Profile
Table 6: Lift, drag, and pitching moment behaviour using a converging-diverging nozzle designed for PR7 on a 20:1 radius to slot Coanda surface atM = 0.716,α= 1.342andRe= 5.028×10⁶.
Configuration Turbulence model ∆Cl ∆Cd ∆Cm Cµ
21:1 Condi PR5 SST 0.2382 0.0071 -0.0394 0.0023 21:1 Condi PR7 k−ω 0.3784 0.0135 -0.0715 0.0032 21:1 Condi PR7 SST 0.3296 0.0112 -0.0563 0.0032 21:1 Condi PR9 SST 0.4077 0.0157 -0.0723 0.0041
expansion and, for cases where a converging-diverging nozzle is used, also over-expansion cases. From the results obtained so far, it was found that the converging-diverging nozzle appears to help prevent Coanda jet detachment due to the under-expansion, while the the behaviour of the jet in over-expansion is under investigation.
Carpenter and Smith,24and Gregory-Smith and Senior25have studied the effect of using a step to mitigate the effects of the under-expansion. By introducing a step, the shock waves due to under-expansion interact with the shear layer formed as a result of the step. The step also aids attachment by providing a region of low pressure which turns the jet towards the surface.24
Using the initial 21:1 purely converging configuration as described above, the radius of the Coanda was decreased by 0.025% chord to give a radius of slot height of 0.5% chord while maintaining the 0.025% chord slot height. Figure 24a shows the behaviour of the under-expanded jet at Cµ = 0.0027. Figure24b shows
the pressure coefficients for the stepped case, the shock cell structure can be seen which begins to follow the Coanda radius.
At PR7, the flow from the same nozzle caused the jet to detach from the 21:1 configuration, while including the step appears to have promoted attachment to the Coanda surface. Table 7 shows that the step case at Cµ = 0.0038induces a drag coefficient of approximately Cd = 0.005 less than the converging
diverging case atCµ = 0.0041while the pitching moment and lift coefficients are comparable.
Table 7: Lift, drag, and pitching moment behaviour using a step and a 20:1 radius to slot Coanda surface atM = 0.716,α= 1.342andRe= 5.028×10⁶.
Configuration Turbulence model ∆Cl ∆Cd ∆Cm Cµ
20:1 Step PR3 SST 0.1629 0.0035 -0.0287 0.0016
20:1 Step PR5 k−ω 0.3260 0.0084 -0.0639 0.0027
20:1 Step PR5 SST 0.2772 0.0063 -0.0498 0.0027
20:1 Step PR7 SST 0.3979 0.0109 -0.0805 0.0038
VII.
Conclusions
For the NASA test case, comparisons between experimental and numerical results for M = 0.3 showed a good agreement with and without blowing over the Coanda surface. For the limited number of cases considered, the results show that the mesh and CFD method provide an accurate representation of the flow. At transonic speeds (M = 0.8), the comparisons between experimental and numerical results without blowing showed a more aft position of the shock wave in the CFD results with only small differences for different turbulent models. Furthermore, the 3D effects in the experiment were addressed by considering pure 2D CFD calculations as well as 3D simulations with different approximation of the wind tunnel set-up: the end plate was always included while the splitter plate in the experiment was either represented as a symmetry or a viscous wall. The results showed that for the case with the viscous wall representing the splitter plate, the best agreement with the experiment was obtained with regards shock position on the upper surface and pressure distribution on the lower surface. In the experiment a trip strip was used, which could (partially) explain the discrepancies with the CFD predictions, as the CFD results are consistent with a thinner boundary layer than in the experiment. For blowing however the shock was found to move too far aft in the CFD simulations. The pressure distribution on the Coanda were generally found to agree well with the experiment for moderate blowing rates.
Following the validation, a study on a supercritical aerofoil for cruise conditions was conducted using meshing approaches tested in the NASA cases. The study involved different nozzles, nozzle exit geometries and Coanda surfaces to investigate which design performs most consistently over a range of blowing coef-ficients. It was found that replicating the lift, drag and moment characteristics of a 25% chord aileron at
αAIL = 3.0 degrees is possible with a converging nozzle and a Coanda radius to slot height ratio of 10:1.
However, a wider range of operating conditions was found for a 21:1 ratio. For the converging nozzle the limiting factor is the strong shock-induced separation created by the under-expansion of the nozzle flow. The results for converging-diverging nozzles showed that, as expected, the under-expansion related shock-induced separation can be delayed to higher pressure ratios. Furthermore, for the converging nozzle, it was found that the shock-induced separation can be delayed by applying a small step in the geometry between the nozzle exit and the Coanda surface.
Further work on the NASA is ongoing, with further investigations into the turbulence modelling. Un-steady RANS simulations are being conducted. Of particular interest is the shear layer formed between the jet and freestream. The parametric study of the DLBA032 section will be extended to further nozzle designs across a range of transonic conditions.
Acknowledgements
(a) Mach contours. (b) Contours of pressure coefficient.
References
1Paterson, E. G., Baker, W. J., Kunz, R. F., and Peltier, L. J., “RANS and detached-eddy simulation of the NCCR airfoil,” Computer Architecture, 2004. Proceedings. 31st Annual International Symposium on, 2004, pp. 112–122, ID: 1.
2Alexander, M. G., Anders, S. G., Johnson, S. K., Florance, J. P., and Keller, D. F., “Trailing Edge Bblowing on a
Two-Dimensional Six-Percent Thick Elliptical Circulation Control Airfoil Up to Transonic Conditions,” Tech. Rep. TM-2005-213545, NASA, 2005.
3Carpenter, P. W. and Green, P. N., “The Aeroacoustics and Aerodynamics of High-Speed Coanda Devices, Part 1:
Conventional Arrangement of Exit Nozzle and Surface,”Journal of Sound and Vibration, Vol. 208, No. 5, 1997, pp. 777–801. 4Dvorak, F. A. and Choi, D. H., “Analysis of Circulation-Controlled Airfoils in Transonic Flow,” Journal of Aircraft,
Vol. 20, No. 4, 1983, pp. 331–337.
5Couluris, G. J., Signor, D., and Phillips, J., “Cruise-Efficient Short Takeoff and Landing (CESTOL): Potential Impact
on Air Traffic Operations,” Tech. Rep. CR-2010-216392, NASA, 2010.
6v. Cook, M., Buonanno, A., and Erbslöh, S. D., “A Circulation Control Actuator for Flapless Flight Control,”Aeronautical Journal, Vol. 112, No. 1134, 2008, pp. 483–489.
7Abramson, J., “Two-Dimensional Subsonic Wind Tunnel Evaluation of Two Related Cambered 15-Percent Thick
Circu-lation Control Airfoils,” Tech. Rep. ASED-373, DTNSRDC, 1977.
8Jones, G. S., Yao, C. S., and Allan, B. G., “Experimental Investigation of a 2D Supercritical Circulation-Control Airfoil
Using Particle Image Velocimetry,”3rd AIAA Flow Control Conference, Vol. 1, 5th-8th June 2006, pp. 367–386.
9Wetzel, D. A., Griffin, J., and Cattafesta III, L. N., “Experiments on an Elliptic Circulation Control Aerofoil,”Journal of Fluid Mechanics, Vol. 730, 2013, pp. 99–144.
10Nishino, T., Hahn, S., and Shariff, K., “Large-Eddy Simulations of a Turbulent Coanda Jet on a Circulation Control
Airfoil,”Physics of Fluids, Vol. 22, No. 12, 2010.
11Englar, R. J., Jones, G. S., Allan, B. G., and Lin, J. C., “2-D Circulation Control Airfoil Benchmark Experiments
Intended for CFD Code Validation,”47th AIAA Aerospace Sciences Meeting Including the New Horizons Forum and Aerospace Exposition, 5th-8th January 2009.
12Abramson, J. and Rogers, E. O., “High Speed Characteristics of Circulation Control Airfoils.” AIAA 21st Aerospace Sciences Meeting., Correspondence Address: Abramson, Jane, AIAA, New York, NY, USA, 10/01 1983, Sponsors: AIAA, New
York, NY, USA; Conference Code: 2504; Cited by (Since 1996):6.
13Englar, R. J., “Two-Dimensional Transonic Wind Tunnel Tests of Three 15-Percent Thick Circulation Control Airfoils,”
Tech. Rep. AD882075, DTNSRDC, 1970.
14Schlecht, R. and Anders, S. G., “Parametric Evaluation of Thin, Transonic Circulation-Control Airfoils,” 45th AIAA Aerospace Sciences Meeting, Vol. 5, 8th-11th January 2007, pp. 3374–3398.
15Wilkerson, J. B. and Montana, P. S., “Transonic Wind Tunnel Test of a 16-Percent-Thick Circulation Control Airfoil
With One-Percent Asymmetric Camber,” Tech. Rep. ASED-82/03, DTNSRDC, 1982.
16Wood, N. J. and Conlon, J. A., “Performance of a Circulation Control Airfoil at Transonic Speeds,”AIAA 21st Aerospace Sciences Meeting., AIAA, 10th-13th January 1983.
17Pulliam, T. H., Jespersen, D. C., and Barth, T. J., “Navier-Stokes Computations for Circulation Control Airfoils,” Von Karman Inst. for Fluid Dynamics Numerical Techniques for Viscous Flow Calculations in Turbomachinery Bladings, Vol. 1,
No. N86-30988, 1986, pp. 22–34.
18York, B., Dvorak, F., Strash, D., and Dash, S., “Improved Algorithms for Circulation-Control Airfoils in Transonic Flow,” 25th AIAA Aerospace Sciences Meeting, 12th-15th Jan 1987.
19Dvorak, F. A. and Dash, S. M., “Wall Jet Analysis for Circulation Control Aerodynamics Part II: Zonal Modeling Concepts
for Wall Jet/Potential Flow Coupling.”Proceedings of the Circulation-Control Workshop 1986., NASA, Washington, DC, USA,
1987, pp. 165–181.
20Shrewsbury, G., “Numerical Evaluation of Circulation Control Airfoil Performance Using Navier-Stokes Methods.”AIAA 24th Aerospace Sciences Meeting., AIAA, New York, NY, USA, 1986.
21Swanson, R. C., Rumsey, C. L., and Anders, S. G., “Aspects of Numerical Simulation of Circulation Control Airfoils,” AIAA Progress in Astronautics and Aeronautics, Vol. 214, 2006, pp. 469–498.
22Milholen II, W. E., Jones, G. S., Chan, D. T., Goodliff, S. L., Anders, S. G., Melton, L. P., Carter, M. B., Allan, B. G.,
and Capone, F. J., “Enhancements to the FAST-MAC Circulation Control Model and Recent High-Reynolds Number Testing in the National Transonic Facility,”31st AIAA Applied Aerodynamics Conference, NASA Langley Research Center, 24th-27th
23Cornelius, K. C. and Lucius, G. A., “Physics of Coanda Jet Detachment at High-Pressure Ratio,” Journal of Aircraft,
Vol. 31, No. 3, 1994, pp. 591–596.
24Carpenter, P. W. and Smith, C., “The Aeroacoustics and Aerodynamics of High-Speed Coanda Devices, Part 2: Effects
of Modifications for Flow Control and Noise Reduction,”Journal of Sound and Vibration, Vol. 208, No. 5, 1997, pp. 803–822. 25Gregory-Smith, D. G. and Senior, P., “The Effects of Base Steps and Axisymmetry on Supersonic Jets Over Coanda
Surfaces,” International Journal of Heat and Fluid Flow, Vol. 15, No. 4, 1994, pp. 291–298.
26Gomez, C. A. and Girimaji, S. S., “Explicit Algebraic Reynolds Stress Model (EARSM) For Compressible Shear Flows,” Theoretical and Computational Fluid Dynamics, Vol. 28, No. 2, 2014, pp. 171–196.
27Elsenaar, A., Waggoner, E. G., and Ashill, P. R., “A Selection of Experimental Test Cases for the Validation of CFD
Codes,” Tech. Rep. AR-303, AGARD, 1994.
28Steijl, R., Barakos, G., and Badcock, K., “A Framework for CFD Analysis of Helicopter Rotors in Hover and Forward
Flight,”Int. J. Numer. Meth. Fluids, Vol. 51, 2006, pp. 819–847.
29Steijl, R. and Barakos, G., “Sliding Mesh Algorithm for CFD Analysis of Helicopter Roto-Fuselage Aerodynamics,” Int. J. Numer. Meth. Fluids, Vol. 58, 2008, pp. 527–549.
30Badcock, K., Richards, B., and Woodgate, M., “Elements of Computational Fluid Dynamics on Block Structured Grids
Using Implicit Solvers,”Progress in Aerospace Sciences, Vol. 36, 2000, pp. 351–392.
31Barakos, G., Steijl, R., Badcock, K., and Brocklehurst, A., “Development of CFD Capability for Full Helicopter
Engin-eering Analysis.” 31st European Rotorcraft Forum, 13-15 September 2005, Florence, Italy, 2005.
32Jameson, A., “Time Dependent Calculations Using Multigrid, with Applications to Unsteady Flows past Airfoils and
Wings,” AIAA Paper 1991-1596, 10th Computational Fluid Dynamics Conference , Honolulu, Hawai, June 24-26, 1991.
33Wilcox, D. C., “Reassessment Of The Scale-Determining Equation For Advanced Turbulence Models,” AIAA Journal,
Vol. 26, No. 11, Jan-1 1988, pp. 1299–1310.
34Menter, F. R., “Two-equation eddy-viscosity turbulence models for engineering applications,” AIAA Journal, Vol. 32,
No. 8, Jan-1 1994, pp. 1598–1605.
35Wilcox, D. C., “Formulation of the k-ωturbulence model revisited,”AIAA Journal, Vol. 46, No. 11, 2008, pp. 2823–2838. 36Spalart, P. and Allmaras, S. R., “One-equation turbulence model for aerodynamic flows,”Recherche aerospatiale, , No. 1,
Jan-1 1994, pp. 5–21.
37Cruz, J. and Anders, S. G., “Assessment of an Unstructured-Grid Method for Predicting Aerodynamic Performance of
Jet Flaps,” 24th AIAA Applied Aerodynamics Conference, Vol. 4, NASA Langley Research Center, 5th-8th June 2006, pp.
2537–2549.
38DeBonis, J. R., Oberkampf, W. L., Wolf, R. T., Orkwis, P. D., Turner, M. G., Babinsky, H., and Benek, J. A., “Assessment
of Computational Fluid Dynamics and Experimental Data for Shock Boundary-Layer Interactions,” AIAA Journal, Vol. 50,
No. 4, Jan-1 2012, pp. 891–903.
39Georgiadis, N. J. and Yoder, D. A., “Recalibration of the Shear Stress Transport Model to Improve Calculation of Shock
Separated Flows,” Tech. Rep. 2013-217851, NASA, 2013.
40Launder, B. E. and Spalding, D. B., “The numerical computation of turbulent flows,” Computer Methods in Applied Mechanics and Engineering, Vol. 3, No. 2, Jan-1 1974, pp. 269–289.
41Wood, N. J. and Nielsen, J. N., “Circulation Control Airfoils as Applied to Rotary-Wing Aircraft,”Journal of Aircraft,
Vol. 23, No. 12, 1986, pp. 865–875.
42Londenberg, W., “Turbulence Model Evaluation for the Prediction of Flows Over a Supercritical Airfoil With Deflected
Aileron at High Reynolds Number,” 31st Aerospace Sciences Meeting and Exhibit, AIAA, 11–14 Jan 1993.