Contents lists available atScienceDirect
Atmospheric Research
journal homepage:www.elsevier.com/locate/atmosres
Optimization and evaluation of multi-bed adsorbent tube method in
collection of volatile organic compounds
Steven Sai Hang Ho
a,b,c, Liqin Wang
a,b, Judith C. Chow
b,c, John G. Watson
b,c, Yonggang Xue
a,b,
Yu Huang
a,b,⁎, Linli Qu
d, Bowei Li
e,f, Wenting Dai
a,b,g, Lijuan Li
a,b,g, Junji Cao
a,baKey Laboratory of Aerosol Chemistry & Physics (KLACP), Institute of Earth Environment, Chinese Academy of Sciences, Xi'an 710061, China bState Key Laboratory of Loess and Quaternary Geology (SKLLQG), Institute of Earth Environment, Chinese Academy of Sciences, Xi'an 710061, China cDivision of Atmospheric Sciences, Desert Research Institute, Reno, NV 89512, United States
dHong Kong Premium Services and Research Company, Lai Chi Kok, Kowloon, Hong Kong
eDepartment of Environmental Science and Technology, School of Human Settlements and Civil Engineering, Xi'an Jiaotong University, Xi'an 710049, China fAcademy of Ecology Industrialization for Wisedom Environment, Langfang 065000, China
gUniversity of Chinese Academy of Sciences, Beijing, China
A R T I C L E I N F O
Keywords: VOCs Method optimization Thermal desorption Adsorbent tube Ozone precursorA B S T R A C T
The feasibility of using adsorbent tubes to collect volatile organic compounds (VOCs) has been demonstrated since the 1990's and standardized as Compendium Method TO-17 by the U.S. Environmental Protection Agency (U.S EPA). This paper investigates sampling and analytical variables on concentrations of 57 ozone (O3) pre-cursors (C2-C12aliphatic and aromatic VOCs) specified for the Photochemical Assessment Monitoring Station (PAMS). Laboratory andfield tests examined multi-bed adsorbent tubes containing a sorbate combination of Tenax TA, Carbograph 1 TD, and Carboxen 1003. Analyte stabilities were influenced by both collection tube temperature and ambient O3concentrations. Analytes degraded during storage, while blank levels were elevated by passive adsorption. Adsorbent tube storage under cold temperatures (−10 °C) in a preservation container filled with solid silica gel and anhydrous calcium sulfate (CaSO4) ensured sample integrity. A high efficiency (> 99%) O3scrubber (i.e., copper coil tubefilled with saturated potassium iodide [KI]) removed O3(i.e., < 200 ppbv) from the air stream with a sampling capacity of 30 h. Water vapor scrubbers interfered with VOC mea-surements. The optimal thermal desorption-gas chromatography/mass spectrometry (TD-GC/MS) desorption time of 8 min was found at 330 °C. Good linearity (R2> 0.995) was achieved for individual analyte calibrations (with the exception of acetylene) for mixing ratios of 0.08–1.96 ppbv. The method detection limits (MDLs) were below 0.055 ppbv for a 3 L sample volume. Replicate analyses showed relative standard deviations (RSDs) of < 10%, with the majority of the analytes within < 5%.
1. Introduction
Volatile organic compounds (VOCs) contribute to the formation of tropospheric ozone (O3) and secondary organic aerosols (SOA) (Cai et al., 2010; Wang et al., 2010; Ling and Guo, 2014; Gentner et al., 2017; Wu and Xie, 2017). They also pose human health threats and other environmental damage (Lau et al., 2010; Seco et al., 2013). Off -line analysis includes collection into a container (e.g., stainless steel canister or Tedlar sampling bag) (U.S.EPA, 1999a, 1999b; Mariné et al., 2012) or selectively trapping VOCs on a substrate (U.S.EPA, 1999c; Woolfenden, 2010a, 2010b; Wu and Chang, 2012). Evacuated canisters (e.g., 2–15 L) are easy to operate, but they are bulky to transport and have potential losses of polar and active compounds on the inner wall
(Woolfenden, 2010a).
Adsorbent tubes, including single-, dual- or multi-bed sorbents, offer portability with low operation cost. Adsorbent tubes can be reused approximately 100 times (after cleaning) before replacement (Woolfenden, 1997; Harper, 2000). Target compounds are collected by different adsorbents by either active sampling or passive diffusion (Woolfenden, 2010b; Seco et al., 2013; Magnusson et al., 2015). Each sorbent has specific retentions associated with individual VOCs, and a sorbate combination allows collection of a wide variety of target ana-lytes (Ribes et al., 2007). The adsorbed components can be extracted in solvents or thermally desorbed, re-condensed, separated by chromato-graphy, and detected by a mass spectrometer detector (MSD), aflame ionization detector (FID), or an electron capture detector (ECD).
https://doi.org/10.1016/j.atmosres.2017.11.026
Received 28 July 2017; Received in revised form 23 October 2017; Accepted 29 November 2017
⁎Corresponding author at: State Key Laboratory of Loess and Quaternary Geology (SKLLQG), Institute of Earth Environment, Chinese Academy of Sciences, Xi'an 710061, China.
E-mail address:[email protected](Y. Huang).
Available online 05 December 2017
0169-8095/ © 2017 Elsevier B.V. All rights reserved.
Thermal desorption (TD) methods yield detection limits at sub-pptv to ppbv levels (Ribes et al., 2007; Ras et al., 2009; Wu and Chang, 2013). Potential interferences include: 1) oxidation of VOCs by O3 and other oxidants during sampling (Kumar and Viden, 2007); and 2) water vapor which reduces retention and breakthrough volumes and damages the analytical instruments (Woolfenden, 2010b; Agilent Technologies, 2011; Ho et al., 2017). Purging the adsorbent tube with inert gases (i.e., helium [He] gas) prior to thermal-desorption analysis removes some of the water condensed onto the adsorbent (Gawłowski et al., 2000). However, such pre-treatments may also remove highly volatilized compounds (i.e., C2-C3), resulting in lower concentrations of the target analytes. (Agilent Technologies, 2013; Ho et al., 2017).
Performance of the multi-bed adsorbent tubes is examined using Tenax TA, Carbograph 1 TD and Carboxen 1003 materials for 57 O3 precursors (i.e., VOCsPAMS,including C2-C12saturated and unsaturated aliphatic and aromatic compounds) specified by the U.S. Photochemical Assessment Monitoring Station (PAMS) and other networks (U.S.EPA, 1998a, 1998b, 2016; Shao et al., 2016; Li et al., 2017). Effects of sampling, storage, and analysis are examined. Precisions and accuracies are estimated by replicate analyses of standards, ambient samples, and certified reference materials.
2. Experimental
2.1. Sorbent tube conditioning and storage
A multi-bed stainless steel adsorbent tube (mass capacity of 380 mg with bed length of 60 mm, 5 mm i.d., and 6 mm o.d.), combining Tenax TA (35–60 mesh), Carbograph 1 TD (40–60 mesh) and Carboxen 1003 (40–60 mesh) (C3-DXXX-5266, Markes, Llantrisant, UK), was used to collect the target VOCsPAMS. Prior to sampling, the adsorbent tubes were cleaned for 20 min at 330 °C in a thermal conditioner (TC20, Markes, UK) with a purge of high-purity nitrogen gas (99.9999% purity, Teda cryogenic equipment Co. Ltd., Xi'an, China) at a rate of 50 ml min−1. Both ends of these pre-conditioned tubes were sealed with Difflok caps (Markes, UK) and stored in a preservation container at
−10 °C for a maximum of 14 days. The preservation container, func-tioning as a desiccator, includes an air-tight glass case (231 mm W × 182 mm l × 167 mm D) filled with 100 g of solid silica gel to adsorb moisture (AR grade, Sinopharm Chemical Reagent Co. Ltd., Ningbo, China) and 100 g of charcoal to remove organic vapor (AR grade, Sinopharm Chemical Reagent Co. Ltd., China).
2.2. Standards and performance tests
A certified PAMS standard mixture (100 ppbv for each of the 57 VOCs) (Restek Corporation, Bellefonte, PA, USA) was used for cali-bration and performance tests. A 3-L Tedlar bag (Restek Corporation, USA) was filled with high-purity nitrogen gas and evacuated with a pump three times before each experiment. The standard gas was diluted with high-purity nitrogen gas to the desired concentrations (i.e., 0.08–1.67 ppbv for calibration and 2 ppbv for performance tests). These mixtures were drawn through the adsorbents with a low-flow pump (1–350 ml min−1
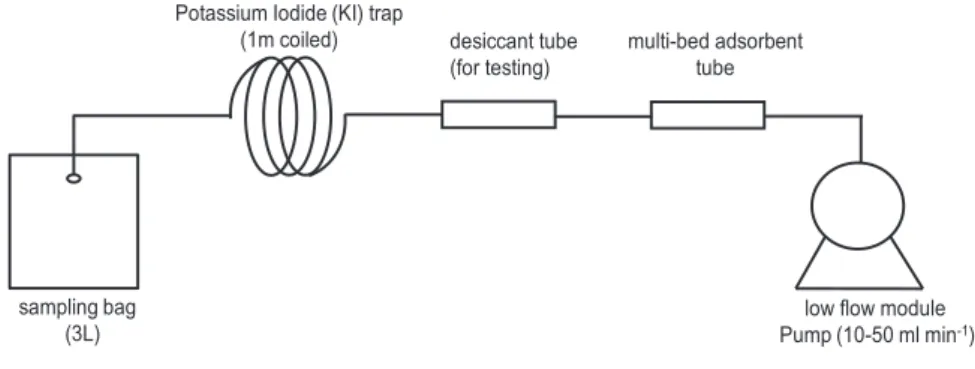
; ACTI-VOC, Markes, UK), calibrated with a massflow calibrator (Defender 510, Bios, Torrance, CA, USA) with a stability of ± 2.7% at 50 ml min−1. The sampling system used for the perfor-mance tests is illustrated inFig. 1. Each experiment was repeated three times to obtain the average and standard deviation.
A certified reference standard (CRS) (C-TO17XX-10, Markes) con-taining 100 ng each of benzene, toluene, o-xylene, 1,2,4-tri-methylbenzene, dichloromethane, 1,1,1-trichloroethane, methyl tert-butyl ether, methyl ethyl ketone, and ethyl acetate was used to evaluate the desorption accuracy.
2.3. Ozone and moisture removal tests
A laboratory-made O3scrubber was prepared using a coiled copper tube (length of 1 m with o.d. of 9.5 mm and i.d. of 6.4 mm)filled with saturated potassium iodide (KI) (Spaulding et al., 1999; Ho and Yu, 2002). To ensure that no water remained inside the tube, the scrubber was purged and dried under a gentleflow of high-purity nitrogen gas for 24 h. O3from an ozone generator (Model 1001, SABIO, Round Rock, TX, USA) and exhaust gases were discharged in a safety fume hood. The removal efficiency of the scrubber was examined under various O3 concentrations andflow rates measured by an ozone analyzer (Model 205, 2B Technologies, Inc., Boulder, CO, USA). The removal efficiency was calculated as:
⎜ ⎟ = ⎛ ⎝ − ⎞ ⎠ × Removal efficiency O O O 100% 3 in 3 out 3 in (1)
where O3 inand O3 outare the concentrations of O3measured before and after the scrubber.
Two types of dryers (i.e., water trap and desiccant tube) were evaluated for their ability to remove moisture from the sampling stream. The water trap consisted of a cryogenic cooling unit (Bead Ruptor 24, OMNI, NW Kennesaw, GA, USA), which maintained a
−50 °C temperature with a liquid nitrogen (N2) supply. The desiccant tube consisted of a glass tube (length of 0.3 m with o.d. of 25.4 mm and i.d. of 19.1 mm)filled with 5.0 g of anhydrous calcium sulfate (CaSO4) (AR grade, Sinopharm Chemical Reagent Co. Ltd., China). Both types of dryers were installed upstream of the sampling system, as shown in Fig. 1.
2.4. Sample analysis
The samples were analyzed using a TD unit (Series 2 UNITY-xr system with ULTRA-xr, Markes, UK) coupled with a gas chromato-graph/mass spectrometric detector (TD-GC/MS, Models 7890A/5977B, Agilent Technology, Santa Clara, CA, USA). The adsorbent tube was connected to the TD unit at room temperature (~ 20 °C) and purged with ultra-high purity He gas at aflow rate of 40 ml min−1for 10 s to eliminate air and oxygen intrusion. For thefirst desorption stage, the analytes were desorbed at 330 °C for 8 min and refocused onto a cryogenic-trap (U-T1703P-2S, Markes) to capture high volatility target compounds at−15 °C. For the secondary desorption stage, the trap was dry-purged for 10 s and rapidly heated from−15 °C to 320 °C and maintained for 5 min. The analytes were passed via a heated transfer line at 160 °C, and refocused again onto a cold GC capillary column head (Rtx®-1, 105 m × 0.25 mm × 1 mm film thickness, Restek Corporation, USA) at−45 °C with liquid N2in the GC oven. After the second desorption, the oven temperature remained at −45 °C for 4 min, ramped to 230 °C at a rate of 6 °C min−1, and stabilized at 230 °C for 5 min. Supplemental Fig. S1 illustrates the time events of the TD-GC/MS steps. The He carrier gasflow rate was 1.0 ml min−1for the duration of GC analysis. The selective ion monitoring (SIM) mode was applied to scan and identify the target analytes with the MSD in elec-tron impact (EI) ionization (70 eV) mode.
2.5. Breakthrough
Collection efficiencies were determined by passing test atmospheres through two identical tubes connected in series for different tempera-tures andflow rates:
⎜ ⎟ = ⎛ ⎝ − ⎞ ⎠ × Collection efficiency 1 C C 100% b f (2)
where Cfand Cbare the amounts of a VOCsPAMScollected on the front and back-up adsorbent tubes, respectively.
2.6. Ambient sample collection
Five sets of collocated samples from roadside locations (i.e., Shapo Overpass of the South Secondary Ring Road in Beilin District, Xi'an) were used to determine the reproducibility for 57 VOCsPAMSin ambient air. Detailed sampling conditions are reported byLi et al. (2017). Each set of samples was collected at aflow rate of 50 ml min−1for 60 min. During the sampling period, ambient temperatures ranged from 27.8–32.1 °C with 46.7–62.2% RHs.
3. Results and discussion 3.1. Breakthrough tests
Table 1summarizes the breakthrough of the target VOCsPAMSat
various tube temperatures (i.e., 0, 10, 20, 30, and 40 °C) andflow rates (10 and 50 ml min−1) as recommended in the manufacturer's technical notes (Agilent Technologies, 2013). The tests were conducted at high concentrations (i.e., 2 ppbv for each of the 57 VOCsPAMS) under a dry atmosphere (~ 0% RH), as RH may influence measurements (Ho et al., 2017).
Breakthrough is considered to be negligible when analytes are < 5% for the backup adsorbent tube (U.S.EPA, 1999c). No breakthrough was found for tube temperatures≤20 °C; low breakthrough (8–10%) was observed for C2-C3 at 30 °C. At a tube temperature of 40 °C, breakthrough was found for C2-C3 (11–23%) and C4-C5 (12–13%). Table 1shows lower abundances of highly volatile compounds (i.e., C2-C3) for samples collected at higher tube temperatures. High tempera-tures minimize the extent of water condensation, but they also reduce the retention of adsorbed VOCsPAMS, which may lead to desorption of
Fig. 1.Schematic of the sampling system for laboratory perfor-mance test.
Table 1
Breakthrough of the multi-bed tube in detection of 57 VOCs collected at different tube temperatures andflow rates.
Tube temperature (°C) 0 10 20 30 40
Collectionflow rate (ml min−1) 10 50 10 50 10 50 10 50 10 50
VOCs
C2-C3 na n n n n n 8 ± 6% 10 ± 4% 11 ± 6% 23 ± 7%
C4-C5 n n n n n n n n 12 ± 7% 13 ± 5%
C6-C9 n n n n n n n n n n
C10-C12 n n n n n n n n n n
aThe values presented are in percentage of the analytes in the second tube, and n represents the values < 5%.
volatiles during sampling. The effect of sampling rates on breakthrough was not apparent with an increasing trend for the C2-C3group at high tube temperatures (30–40 °C) whenflow rates increased from 10 to 50 ml min−1.
3.2. Sample stability
Fig. 2demonstrates the relative responses for the target analytes collected in the absence (i.e., using O3 scrubber) and presence of varying O3levels (i.e., 10, 50, and 200 ppbv). The tests were conducted at a temperature of 20 °C with a concentration of 2 ppbv for each of the 57 VOCsPAMS. Without the O3scrubber, the effect of O3is most apparent for alkenes and aromatics with decreasing response (~ 14–41%) at 200 ppbv of O3; < 15% variation was found for alkanes. The reduction in response was 37–41% for ethene, acetylene, propylene, and isoprene. Oxidation or degradation of the analytes occurred as ambient O3 con-centrations exceeded 200 ppbv, supporting the need for an O3scrubber during VOC sampling.
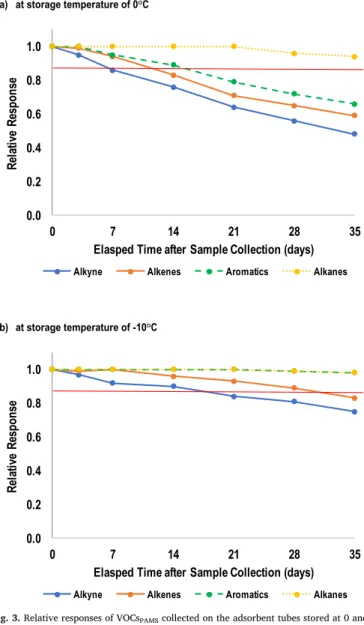
In contrast to canisters, adsorbent tubes are not completely sealed and isolated from surrounding environments by hand-tightened caps. Therefore, adequate sample storage is essential to ensure the integrity of samples.Fig. 3shows the relative responses of four classes of target
analytes (i.e., alkanes, alkenes, alkyne [only acetylene] and aromatics) for adsorbent tubes stored at 0 and−10 °C. While alkanes remained stable at 0 °C, lower concentrations for alkynes (36%), alkenes (29%), and aromatics (21%) were found after 21 days in storage.
As shown inFig. 3b, VOCs are stable at−10 °C for 14 days. De-gradation of alkynes and alkenes (~ 15–20%) is less than those of aromatics (~ 10%). In addition to high reactivity, alkenes might also evaporate due to a low boiling point (b.p. =−83.4 °C). Similar to aromatics, alkanes remain stable over 35 days, except for ethane (b.p. =−88.6 °C) and propane (b.p. =−42.1 °C). These tests indicate that the sampled adsorbent tubes should be stored in air-tight con-tainers under cold temperatures (−10 °C) and analyzed within 14 days after sampling.
3.3. Adsorbent tube blanks
The variable blank levels of the adsorbent tubes can increase the method detection limits (MDLs). To examine the passive adsorption of VOCs,Table 2compares the detected VOCsPAMSamong fresh and aged thermally-cleaned adsorbent tubes along with field and transport blanks. Only trace amounts (< 0.13 ng per tube) of propylene, ben-zene, and toluene were detected in the fresh thermal-cleaned blanks. A sharp increase in cyclopentane, followed by 2,3-dimethylbutane and 1-hexene, was found after 14 days of storage at−10 °C. Cyclopentane, a cyclic aliphatic C5, has been used to produce polyurethane insulating foam (used in freezers and refrigerators); replacing the chloro-fluorocarbons (Choczynski et al., 2011) which have been found to de-stroy O3layers.
Without use of a cold-temperature storage container,Table 2shows that VOC levels from passive adsorption are similar to those offield and transport blanks. Therefore, the use of the air-tight preservation con-tainer at−10 °C could efficiently reduce undesired passive adsorption.
3.4. Ozone removal
Fig. 4illustrates the removal efficiency for 200 and 1000 ppbv O3 using KI-coated coil tubes at aflow rate of 50 ml min−1. The saturated KI maintained excellent efficiency (99%) to remove 200 ppbv O3for ~ 30 h; but saturated with 1000 ppb O3 after 6 h of exposure. The lifetime of the O3scrubber may vary due to non-equivalent amounts of KI coated in each tube. Although application of the KI coating presents a technical challenge,field testing shows that the O3scrubber is ade-quate for integrated 24-h sampling at ambient O3levels < 200 ppbv. Other media are also used to remove O3, such as combining im-pregnated granular activated carbon powder with copper chloride (CuCl2) or potassium nitrate (KNO3) (Takeichi and Itoh, 1993). How-ever, the activated carbon treatment may lead to the adsorption of organics and increase the uncertainties of VOC measurements.
3.5. Water removal
Previous studies have illustrated the influence of atmospheric water vapor on adsorbent tubes (Helmig and Vierling, 1995; Gawłowski et al., 2000; Karbiwnyk et al., 2002; Ho et al., 2017). The U.S. EPA Com-pendium Method TO-14A recommends using a Nafion® permeable membrane dryer to remove water vapor upstream of the sampling train. As volatile and polar organics also permeate this membrane similar to water vapor pathways, it may bias the VOC measurements due to the acid nature of the dryer (Compendium Method TO-15;U.S.EPA, 1999a, 1999b). Models have been developed to estimate compound losses due to physical adsorption of VOCs on canister walls and to dissolution of the water condensed VOCs in the canisters (Coutant, 1993). A sys-tematic approach to correct the biases caused by water vapor in the adsorbent tubes requires further investigation.
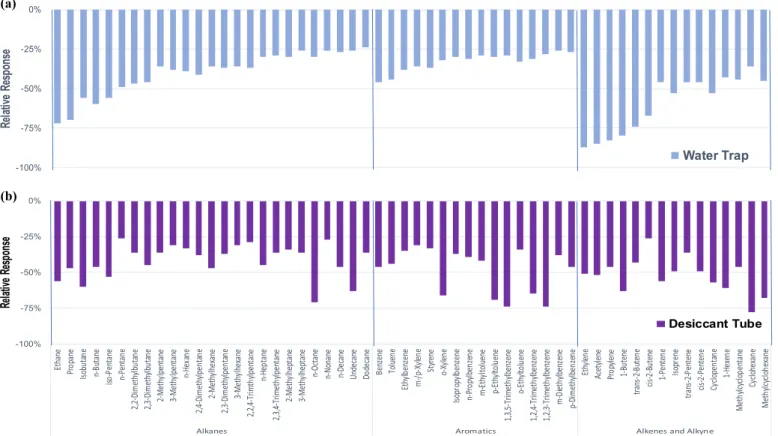
Two types of dryers (i.e., water trap and desiccant tube) were in-stalled upstream of the collocated absorbent tubes (two tubes in series)
Fig. 3.Relative responses of VOCsPAMScollected on the adsorbent tubes stored at 0 and
10 °C for the duration of 35 days (the red line represents the relative responses at 90%). (For interpretation of the references to color in thisfigure legend, the reader is referred to the web version of this article.)
forfield testing.Fig. 5shows the negative relative response for VOC-sPAMSmeasurements. Using the water trap (Fig. 5a), there was clearly a loss (35–87%) of C2-C5aliphatic compounds, presumably due to the condensation or dissolution from water vapor at lower temperatures; large reductions (27–46%) were also found for aromatics. The negative responses were less uniform using the CaSO4-filled desiccant tube (Fig. 5b). It is possible that the desiccants become progressively loaded with water, which leads to unanticipated gas adsorption. These non-selective water removal approaches are therefore not appropriate for VOC sampling.
3.6. Thermal desorption duration
The optimal desorption duration is the minimum time required for complete desorption of target analytes from the adsorbent tube before transfer to the cryogenic trap (Karbiwnyk et al., 2002; Fernandez-Villarrenaga et al., 2004; Ribes et al., 2007; Ras et al., 2009; Gallegoa et al., 2011; Wu and Chang, 2012; Agilent Technologies, 2013; Brown et al., 2014).Fig. 6compares the responses for VOCsPAMSmeasured at five durations (i.e., 1, 3, 5, 8, and 10 min) during the first stage of thermal desorption (Fig. S1) at 330 °C (Agilent Technologies, 2013). Lower responses were found for desorption durations≤5 min. Heavier VOCsPAMS(C6-C12) had the slowest desorption rates among the five VOC groups (i.e., C2, C3, C4, C5, and C6-C12), attributed to their rela-tively high boiling points and high retention of the sorbate combina-tion. Declines in responses were found for C2, C3and C4at 10 min in-tervals. It is possible that the cryogenic trap might not efficiently retain all of the desorbed analytes for the extended desorption duration. Negligible (1%) amounts of the target analytes were found in the sub-sequent re-analysis of the same desorbed tube at 330 °C, suggesting that no carryover occurred. An optimal desorption duration of 8 min is re-commended as it demonstrates complete desorption of target analytes.
3.7. Method detection limits (MDLs), precision, and accuracy
Table 3summarizes the calibration parameters and MDLs of the 57 VOCsPAMS using the optimized analytical protocol. The calibration curve for each target analyte was established by collecting a series of adsorbent tubes from the certified standard gas in the range of 0.08 to 1.67 ppbv, based on a collection volume of 3 l (i.e., 50 ml min−1for 60 min). These levels were in-line with VOCsPAMSconcentrations found in China (Cai et al., 2010; Zhang et al., 2012). Excellent linearity of each target analyte was demonstrated with correlation coefficients (R2) of > 0.995, with the exception of acetylene (R2= 0.9334) which had the lowest response factor (i.e., calibration slope). For relative standard derivation (RSDs) < 30%, the MDL was calculated as three times the
Table 2
Variations of average blanks levels (in ng per multi-bed adsorbent tube) for VOCsPAMSat different storage environments.
Cleaned tubes stored at−10°Ca Dynamic blanksb Fresh cleaned thermal desorption tubes
Preservation box Yes No Yes No
No. of storage day 14 28 14 28 Field Transport Field Transport
VOCsc Ethylene 0.159 0.223 0.504 0.689 0.215 0.198 0.469 0.415 nd Ethane 0.046 0.056 0.077 0.145 0.065 0.051 0.079 0.083 nd Propylene 0.138 0.236 0.281 0.362 0.156 0.155 0.265 0.258 0.124 Propane 0.069 0.086 0.119 0.190 0.077 0.056 0.122 0.105 nd Isobutane ndd nd 0.062 0.174 nd nd 0.017 0.015 nd n-Butane nd nd 0.053 0.101 nd nd 0.044 0.041 nd cis-2-Butene nd nd 0.020 0.050 nd nd 0.035 0.028 nd iso-Pentane nd nd 0.026 0.053 nd nd 0.007 0.006 nd 1-Pentene nd nd 0.048 0.073 0.045 0.023 0.066 0.054 nd n-Pentane nd nd 0.101 0.230 nd nd nd nd nd 2,3-Dimethylbutane nd nd 0.392 1.120 nd nd nd nd nd Cyclopentane nd nd 5.020 18.381 nd nd nd nd nd 2-Methylpentane nd nd 0.015 0.046 nd nd 0.029 0.025 nd 1-Hexene nd nd 0.236 0.867 nd nd 0.066 0.051 nd n-Hexane nd nd 0.020 0.037 nd nd 0.023 0.017 nd Benzene 0.148 0.169 0.359 0.501 0.225 0.155 0.412 0.391 0.129 Toluene 0.026 0.036 0.026 0.061 0.024 0.021 0.017 0.022 0.019 Styrene 0.017 0.019 0.059 0.081 0.021 0.018 0.056 0.053 nd p-Diethylbenzene nd nd 0.014 0.027 nd nd 0.022 0.017 nd
aCleaned tubes were stored in the laboratory's freezer at−10 °C.
bBlanks were cleaned tubes which shipped tofields at−10 °C. Field blank represents passive deposition; it refers to a blank adsorbent tube connected to the sampler without turning
on the pump (no air passes through the tube). Transport blank refers to a blank tube shipped to and from thefield along with ambient samples.
cOnly lists the 19 species that were detected in the blanks. dOnly denotes values below the method detection limit.
Fig. 4.Efficiencies of ozone removal for a laboratory-made potassium iodide coated copper tube for O3concentrations of 200 and 1000 ppb.
RSD of the average peak areas from seven replicates at the lowest mixing ratio (i.e., 0.08 ppbv) (U.S.EPA, 1999c). The MDLs of all target analytes ranged from 0.001 to 0.055 ppbv, which are lower than, or close to, those reported in other studies (Ribes et al., 2007).
Reproducibility has been examined with regard to both laboratory standards and field samples. Replicate analyses with laboratory stan-dards verify the reproducibility of the analytical methods, whereas re-plicate analyses of field samples incorporate variabilities of the la-boratory process, transport to and from thefield, and ambient sampling under difference environmental conditions to better represent real-world reproducibility.
Seven replicate analyses of standard gas samples reported RSDs of 0.31–7.10% with a median RSD of 2.56% for 57 VOCsPAMS(Table 3). These levels are similar to the three replicate analyses offive roadside samples (i.e., RSDs ranged 1.23–9.47%, with a median of 3.88%). RSDs for different classes of organic compounds did not exceed 10% with the exception of acetylene (C3) for two sets of roadside samples (Li et al., 2017). Most (> 80%) of the RSDs were < 5%. Among the quantified compound classes (excluding alkyne), alkenes had higher RSDs (1.70–6.52%) than the other two compound classes with a median RSD of 3.24%. Roadside samples are affected by the sampling environment in addition to the uncertainties of the analytical process. Consistent precisions between the laboratory standards and the vehicle-dominant samples confirm that the combination of sampling and analytical pro-tocol developed in this study is highly reproducible for VOCsPAMS quantification. The RSDs also attained the performance criteria for VOCs measured by the adsorbent method followed by thermal deso-rption analysis established by Compendium Method TO-17 (U.S.EPA, 1999c).
For analyses offive CRS tubes,Table 4shows that the differences from the certified values ranged from−2.55% to 0.85% for benzene, toluene, o-xylene, and 1,2,4-trimethylbenzene. Five additional re-ference standard tests were included (i.e., dichloromethane, 1,1,1-tri-chloroethane, methyl tert-butyl ether, methyl ethyl ketone, and ethyl acetate) for independent quality assurance; not part of the list of VOCsPAMS. The desorption accuracy for other VOCsPAMS cannot be verified due to the availability of certificate standards.
4. Conclusion
The collection, sample preservation, and analytical protocols for thermal desorption-gas chromatography/mass spectrometry (TD-GC/ MS) have been optimized for VOCsPAMSmeasurement by the multi-bed adsorbent tube method. Oxidants present in the sample stream, such as O3(< 200 ppb), interfere with the stability of target analytes and can
Fig. 5.Relative responses for the target VOCs using two types of dyes: a) water tap and b) desiccant tube dryers with calcium sulfate (CaSO4). Samples are normalized to measurements
without proceeding dryers.
Fig. 6.Relative responses of VOCsPAMSdesorbed from the adsorbent tubes loaded with
be efficiently removed by a laboratory-made potassium iodide (KI) scrubber installed upstream of the sampling system. No proper media was found that can efficiently remove water content without biasing VOCsPAMS measurements. Low storage temperature (−10 °C) of the adsorbent tubes allows the best preservation of both blanks and sam-ples. The optimized multi-bed adsorbent tube sampling and analytical protocols result in low method detection limits (MDLs) of 0.055ppbv,
good precisions (< 10%), and high accuracy (< 3%) for the quantifi -cation of VOCsPAMS.
Acknowledgment
This research was financially supported by the National Key Research and Development Program of China (2016YFA0203000), the
Table 3
Physical properties, linear regression parameters for calibration curves, method detection limits, and method precisions.
Compound CAS No M.W.a B.P.(°C)b SIMc Formula Slope Intercept R2 MDL (μg/m3)d MDL (ppbv)d RSD
STDe RSDSamplef Ethylene 74-85-1 28 −103.7 26 C2H4 1393.8 129.5 0.9995 0.045 0.039 4.11 6.52 Acetylene 74–86-2 26 −83.4 26 C2H2 160.7 764.4 0.9334 0.058 0.055 3.37 9.47 Ethane 74-84-0 30 −88.6 27 C2H6 506.5 −69.1 0.9950 0.040 0.033 1.96 5.23 Propylene 115-07-1 42 −47.4 41 C3H6 7779.2 13,151.0 0.9996 0.071 0.042 2.49 8.22 Propane 74-98-6 44 −42.1 43 C3H8 7218.8 564.6 0.9993 0.035 0.019 5.51 6.12 Isobutane 75-28-5 58 −11.8 43 C4H10 16,474.4 4798.7 0.9992 0.056 0.024 2.49 5.23 1-Butene 106-98-9 56 −6.3 56 C4H8 13,364.6 6182.9 0.9989 0.017 0.008 6.03 4.22 n-Butane 106-97-8 58 −0.5 43 C4H10 16,962.1 1959.4 0.9993 0.040 0.017 1.70 6.25 trans-2-Butene 107-01-7 56 0.88 56 C4H8 11,244.7 765.3 0.9999 0.024 0.010 1.83 3.22 cis-2-Butene 590-18-1 56 3.7 56 C4H8 9601.0 1669.2 0.9993 0.014 0.006 0.12 0.98 iso-Pentane 78-78-4 72 27.8 57 C5H12 8778.0 1642.5 0.9994 0.005 0.002 6.35 3.56 1-Pentene 109-67-1 70 30.1 70 C5H10 7528.3 2752.8 0.9998 0.038 0.013 2.83 5.22 n-Pentane 109-66-0 72 36.1 72 C5H12 13,049.8 4356.6 0.9997 0.057 0.019 0.46 1.98 Isoprene 2004-70-8 68 27.8 67 C5H8 8335.0 1444.0 0.9998 0.013 0.005 3.40 2.56 trans-2-Pentene 646-04-8 70 37.0 70 C5H10 13,758.2 −1252.6 0.9998 0.033 0.012 0.17 1.22 cis-2-Pentene 627-20-3 70 37.0 70 C5H10 13,644.7 −2324.7 1.0000 0.017 0.006 2.27 4.65 2,2-Dimethylbutane 75-83-2 86 49.7 71 C6H14 9815.1 −339.0 0.9993 0.015 0.004 0.78 4.23 Cyclopentane 287-92-3 70 50.0 70 C5H10 6092.3 −236.6 0.9993 0.037 0.013 0.28 3.27 2,3-Dimethylbutane 79-29-8 86 58.7 86 C6H14 5272.2 −692.2 1.0000 0.016 0.004 4.83 5.29 2-Methylpentane 43,133-95-5 86 60.3 71 C6H14 15,300.6 4467.0 0.9999 0.083 0.024 2.47 3.33 3-Methylpentane 96-14-0 86 64.0 57 C6H14 16,539.4 −1970.1 1.0000 0.020 0.006 0.28 2.86 1-Hexene 592-41-6 84 63.3 84 C6H12 7314.1 −256.2 0.9992 0.011 0.003 3.10 3.56 n-Hexane 110-54-3 86 68.7 86 C6H14 28,313.9 −4038.9 0.9999 0.064 0.018 3.38 4.11 Methylcyclopentane 96-37-7 84 71.8 84 C6H12 6239.1 549.5 0.9975 0.026 0.008 4.85 5.23 2,4-Dimethylpentane 108-08-7 100 80.5 85 C7H16 5285.3 −1159.5 0.9999 0.015 0.004 1.00 2.71 Benzene 71-43-2 78 80.1 78 C6H6 31,919.0 36,200 0.9957 0.049 0.015 7.10 6.55 Cyclohexane 110-82-7 84 80.7 84 C6H12 13,066.2 −557.5 1.0000 0.016 0.005 0.27 3.08 2-Methylhexane 591-76-4 100 90.0 85 C7H16 15,283.9 −3302.2 1.0000 0.027 0.007 0.31 2.20 2,3-Dimethylpentane 565-59-3 100 89.8 71 C7H16 14,588.6 −955.7 0.9996 0.029 0.007 0.73 3.65 3-Methylhexane 589-34-4 100 90.7 71 C7H16 11,495.7 −1034.9 0.9990 0.024 0.006 1.45 2.69 2,2,4-Trimthylpentane 540-84-1 114 99.2 99 C8H18 29,132.5 −4351.2 0.9995 0.047 0.010 0.56 1.77 n-Heptane 142-82-5 100 98.8 100 C7H16 10,845.4 −2048.3 0.9991 0.028 0.007 0.38 1.23 Methylcyclohexane 108-87-2 98 100.9 98 C7H14 14,972.1 −3500.1 0.9999 0.019 0.005 1.26 3.22 2,3,4-Trimethylpentane 565-75-3 114 113.5 71 C8H18 15,529.0 −4127.4 0.9997 0.033 0.007 0.69 1.89 Toluene 108-88-3 92 110.6 91 C7H8 31,669.0 −12,279 0.9992 0.083 0.026 4.34 5.13 2-Methylheptane 592-27-8 114 117.8 99 C8H18 17,137.1 −5425.8 0.9996 0.022 0.005 0.36 2.47 3-Methylheptane 589-81-1 114 118.8 85 C8H18 12,497.1 −2902.8 0.9991 0.030 0.006 0.08 1.69 n-Octane 111-65-9 114 125.8 114 C8H18 14,439.9 −3520.6 0.9994 0.025 0.005 0.70 1.56 Ethylbenzene 100-41-4 106 136.2 106 C8H10 36,066.8 8217.9 0.9995 0.018 0.004 1.77 3.29 m-Xyleneg 108-38-3 106 139.1 106 C8H10 60,865.4 1499.5 0.9992 0.036 0.008 1.82 3.56 p-Xyleneg 106-42-3 106 138.3 106 C8H10 60,865.4 1499.5 0.9992 0.036 0.008 1.82 3.56 Styrene 100-42-5 105 146 104 C8H8 13,775.3 −810.4 0.9992 0.028 0.006 3.64 4.21 o-Xylene 95-47-6 106 144.4 106 C8H10 27,197.4 −2886.3 0.9997 0.013 0.003 0.91 1.89 n-Nonane 111-84-2 128 151.7 128 C9H20 15,897.5 −2478.7 1.0000 0.021 0.004 0.91 1.74 Isopropylbenzene 98-82-8 120 152.4 120 C9H12 34,700.6 −8199.4 0.9997 0.018 0.004 1.08 2.06 n-Propylbenzene 103-65-1 120 159.2 120 C9H12 50,739.5 −1587.0 0.9991 0.015 0.003 3.64 4.13 m-Ethyltoluene 620-14-4 120 159.7 120 C9H12 38,892.1 −332.8 0.9958 0.011 0.002 1.87 3.08 p-Ethyltoluene 25,550-14-5 120 162.0 120 C9H12 39,026.5 −1995.6 0.9984 0.014 0.003 0.44 3.21 1,3,5-Trimethylbenzene 108-67-8 120 164.7 120 C9H12 29,195.7 −4027.4 0.9986 0.007 0.001 0.61 2.46 o-Ethyltoluene 611-14-3 120 165.2 120 C9H12 32,171.0 −5983.4 0.9996 0.014 0.003 1.14 2.26 1,2,4-Trimethylbenzene 95-63-6 120 169.4 105 C9H12 28,174.9 −3504.3 0.9960 0.014 0.003 0.73 1.71 n-Decane 124-18-5 142 174.2 85 C10H22 20,272.0 −2165.3 0.9997 0.015 0.002 0.87 2.69 1,2,3-Trimethylbenzene 526-73-8 120 176.7 105 C9H12 22,142.4 −3807.1 0.9995 0.012 0.002 0.61 3.23 m-Diethylbenzene 141-93-5 134 182.0 134 C10H14 15,486.0 −2208.4 0.9996 0.013 0.002 1.30 2.22 p-Dimethylbenzene 105-05-5 134 183.7 134 C10H14 15,132.9 −2766.0 0.9996 0.012 0.002 1.88 3.68 Undecane 1120-21-4 156 195.6 85 C11H24 14,248.3 −4151.5 0.9998 0.023 0.004 1.76 4.10 Dodecane 112-40-3 170 200.7 85 C12H26 8963.9 −809.6 0.9998 0.026 0.004 3.43 3.69 aMolecular weight. bBoling point.
cSelective ion used for quantification by MS.
dMinimum detection limit is expressed in assumption of a sampling volume of 3 l. eRelative standard derivation from seven replicates of standard.
fRelative standard derivation for three collocated roadside samples. gm-Xylene and p-xylene are co-eluted.
National Science Foundation of China (41401567, 41503117, 41573138), and the “Strategic Priority Research Program” of the Chinese Academy of Sciences (Grant No. XDB05000000). Yu Huang is also supported by the “Hundred Talent Program” of the Chinese Academy of Sciences.
Appendix A. Supplementary data
Supplementary data to this article can be found online athttps:// doi.org/10.1016/j.atmosres.2017.11.026.
References
Agilent Technologies, 2011. Maintaining Your GC/MS System: Operating Your Agilent GC/MS System with Maximum Efficiency. http://www.sisweb.com/art/pdf/ms-maint.pdf.
Agilent Technologies, 2013. Thermal Desorption Technical Support Note 86a: EPA Method TO-17 for Monitoring‘Air Toxics’in Ambient Air Using Sorbent Tubes and Automated, Cryogenfree Thermal Desorption.http://www.agilent.com/cs/library/ applications/5991-2828EN.pdf.
Brown, V.M., Crump, D.R., Plant, N.T., Pengelly, I., 2014. Evaluation of the stability of a mixture of volatile organic compounds on sorbents forthe determination of emissions from indoor materials and products using thermaldesorption/gas chromatography/ mass spectrometry. J. Chromatogr. A. 1350, 1–9.
Cai, C., Geng, F., Tie, X., Yu, Q., An, J., 2010. Characteristics and source apportionment of VOCs measured in Shanghai, China. Atmos. Environ. 44 (38), 5005–5014. Choczynski, M., Krajewska, B., Stegowski, Z., Necki, J., 2011. Emission of styrene from
polystyrene foam and of cyclopentane from polyurethane foam - measurements and modeling. Polimery 56 (6), 461–470.
Coutant, R.W., 1993. Theoretical evaluation of stability of volatile organic chemicals and polar volatile organic chemicals in canisters. In: U.S. Environmental Protection Agency (U.S.EPA), EPA Contract No. 68-DO-0007, Work Assignment No. 45, Subtask 2, Battelle, Columbus, OH, U.S.
Fernandez–Villarrenaga, V., Lopez–Mahia, P., Muniategui–Lorenzo, S., Prada–Rodriguez, D., Fernandez–Fernandez, E., Tomas, X., 2004. C1 to C9 volatile organic compound measurements in urban air. Sci. Total Environ. 334, 167–176.
Gallego, E., Roca, F.J., Perales, J.F., Guardino, X., 2011. Comparative study of the ad-sorption performance of an active multi-sorbent bed tube (Carbotrap, Carbopack X, Carboxen 569) and a Radiello®diffusive sampler for the analysis of VOCs. Talanta 85, 662–672.
Gawłowski, J., Gierczak, T., Pietruszyñska, E., Gawryś, M., Niedzielski, J., 2000. Dry purge for the removal of water from the solid sorbents used to sample volatile organic compounds from the atmospheric air. Analyst 125, 2112–2117.
Gentner, D.R., Jathar, S.H., Gordon, T.D., Bahreini, R., Day, D.A., Haddad, I.E., Hayes, P.L., Pieber, S.M., Platt, S.M., Gouw, J.D., Goldstein, A.H., Harley, R.A., Jimenez, J.L., Prévôt, A.S.H., Robinson, A.L., 2017. Review of urban secondary organic aerosol formation from gasoline and diesel motor vehicle emissions. Environ. Sci. Technol. 51 (3), 1074–1093.
Harper, M., 2000. Sorbent trapping of volatile organic compounds from air. J. Chromatogr. A 885, 129–151.
Helmig, D., Vierling, L., 1995. Water adsorption capacity of the solid adsorbents Tenax TA, Tenax GR, Carbotrap, Carbotrap C, Carbosieve SIII, and Carboxen 569 and water management techniques for the atmospheric sampling of volatile organic trace gases. Anal. Chem. 67 (195), 4380–4386.
Ho, S.S.H., Yu, J.Z., 2002. Concentrations of formaldehyde and other carbonyls in en-vironments affected by incense burning. J. Environ. Monit. 4, 728–733.
Ho, S.S.H., Chow, J.C., Watson, J.G., Wang, L.Q., Qu, L.L., Dai, W.T., Huang, Y., Cao, J.J., 2017. Influences of relative humidities and temperatures on the collection of C2-C5 aliphatic hydrocarbons with multi-bed (Tenax TA, Carbograph 1TD, Carboxen 1003) sorbent tube method. Atmos. Environ. 151, 45–51.
Karbiwnyk, C.M., Mills, C.S., Helmig, D., Birks, J.W., 2002. Minimization of water vapor interference in the analysis of non-methane volatile organic compounds by solid adsorbent sampling. J. Chromatogr. A 958, 219–229.
Kumar, A., Viden, I., 2007. Volatile organic compounds: sampling methods and their
worldwide profile in ambient air. Environ. Monit. Assess. 131, 301–321. Lau, A.K., Yuan, Z., Yu, J.Z., Louie, P.K., 2010. Source apportionment of ambient volatile
organic compounds in Hong Kong. Sci. Total Environ. 408 (19), 4138–4149. Li, B.W., Ho, S.S.H., Xue, Y.G., Huang, Y., Wang, L.Q., Cheng, Y., Dai, W.T., Zhong, H.B.,
Cao, J.J., Lee, S.C., 2017. Characterizations of volatile organic compounds (VOCs) from vehicular emissions at roadside environment: thefirst comprehensive study in Northwestern China. Atmos. Environ. 161, 1–12.
Ling, Z.H., Guo, H., 2014. Contribution of VOC sources to photochemical ozone formation and its control policy implication in Hong Kong. Environ. Sci. Pol. 38, 180–191. Magnusson, R., Rittfeldt, L.,Ǻstot, C., 2015. Evaluation of sorbent materials for the
sampling and analysis of phosphine, sulfurylfluoride and methyl bromide in air. J. Chromatogr. A 1375, 17–26.
Mariné, S., Pedrouzo, M., Marcé, R.M., Fonseca, I., Borrull, F., 2012. Comparison between sampling and analytical methods in characterization of pollutants in biogas. Talanta 100, 145–152.
Ras, M.R., Borrull, F., Marcé, R.M., 2009. Sampling and preconcentration techniques for determination of volatile organic compounds in air samples. Trac-Trend. Anal. Chem. 28 (3), 347–361.
Ribes, A., Carrera, G., Gallego, E., Roca, X., Berenguer, M.A., Guardino, X., 2007. Development and validation of a method for air-quality and nuisance odors mon-itoring of volatile organic compounds using multi-sorbent adsorption and gas chro-matography/mass spectrometry thermal desorption system. J. Chromatogr. A 1140 (1–2), 44–55.
Seco, R., Peñuelas, J., Filella, I., Llusia, J., Schallhart, S., Metzger, A., Müller, M., Hansel, A., 2013. Volatile organic compounds in the western Mediterranean basin: urban and rural winter measurements during the DAURE campaign. Atmos. Chem. Phys. 13 (8), 4291–4306.
Shao, P., An, J., Xin, J., Wu, F., Wang, J., Ji, D., Wang, Y., 2016. Source apportionment of VOCs and the contribution to photochemical ozone formation during summer in the typical industrial area in the Yangtze River Delta, China. Atmos. Res. 176–177, 64–74.
Spaulding, R.S., Frazey, P., Rao, X., Charles, M.J., 1999. Measurement of hydroxy car-bonyls and other carcar-bonyls in ambient air using pentafluorobenzyl alcohol as a chemical ionization reagent. Anal. Chem. 71, 3420–3427.
Takeichi, Y., Itoh, Y., 1993. Removal of ozone from air by activated carbon treatment. Sep. Technol. 3 (3), 168–175.
U.S. Environmental Protection Agency (U.S.EPA), 1998a. Photochemical Assessment Monitoring Stations (PAMS) Issue Summary. US Environmental Protection Agency Monitoring and Quality Assurance Group Emissions. Monitoring and Analysis Division Office of Air Quality Planning and Standards Research Triangle Park, NC, U.S.
U.S. Environmental Protection Agency (U.S.EPA), 1998b. Technical Assistance Document for Sampling and Analysis of Ozone Precursors. U.S. Environmental Protection Agency National Exposure Research Laboratory Human Exposure and Atmospheric Sciences Division Research Triangle Park, North Carolina, NC, U.S.
U.S. Environmental Protection Agency (U.S.EPA), 1999a. Compendium of Method TO-14a: Determination of Volatile Organic Compounds (VOCs) in Ambient Air Using Specially Prepared Canisters with Subsequent Analysis by Gas Chromatography. Center for Environmental Research Information, Office of Research and Development, Cincinnati, OH, U.S.
U.S. Environmental Protection Agency (U.S.EPA), 1999b. Compendium of Method TO-15: Determination of Volatile Organic Compounds (VOCs) in Air Collected in Specially-Prepared Canisters and Analyzed by Gas Chromatography/Mass Spectrometry (GC/ MS). Center for Environmental Research Information, Office of Research and Development, Cincinnati, OH, U.S.
U.S. Environmental Protection Agency (U.S.EPA), 1999c. Compendium of Method TO-17: Determination of Volatile Organic Compounds in Ambient Air Using Active Sampling onto Sorbent Tubes. Center for Environmental Research Information, Office of Research and Development, Cincinnati, OH, U.S.
U.S. Environmental Protection Agency (U.S.EPA), 2016. Quality Assurance Guidance Document, PAMS Required Quality Assurance Implementation Plan. U.S. Environmental Protection Agency Office of Air Quality Planning and Standards Air Quality Assessment Division Research Triangle Park, NC, U.S.
Wang, B., Shao, M., Lu, S.H., Yuan, B., Zhao, Y., Wang, M., Zhang, S.Q., Wu, D., 2010. Variation of ambient non-methane hydrocarbons in Beijing City in summer 2008. Atmos. Chem. Phys. 10 (13), 5911–5923.
Woolfenden, E., 1997. Monitoring VOCs in air using sorbent tubes followed by thermal desorption-capillary GC analysis: summary of data and practical guidelines. J. Air
Table 4
Concentrations (ng/tube) of four VOCs in certified CRS standard tubes determined by the TD-GC/MS method.
VOC concentrations (ng/tube) determined by the TD-GC/MS method CRS certified value (ng)
Relative difference (%)a
Tube 1 Tube 2 Tube 3 Tube 4 Tube 5 Average Standard
deviation VOCs Benzene 100.5 103.4 104.2 101.1 104.4 102.7 1.80 100.1 −2.55% Toluene 101.8 100.2 101.7 104.4 100.1 101.6 1.74 100.5 −1.12% o-Xylene 99.9 99.2 97.1 98.9 99.2 98.9 1.05 99.7 0.85% 1,2,4-Trimethylbenzene 97.3 101.1 99.2 100.4 100.0 99.6 1.46 100.2 0.60%
Waste Manage. Assoc. 47 (1), 20–36.
Woolfenden, E., 2010a. Sorbent-based sampling methods for volatile and semi-volatile organic compounds in air Part 1: sorbent-based air monitoring options. J. Chromatogr. A 1217 (16), 2674–2684.
Woolfenden, E., 2010b. Sorbent-based sampling methods for volatile and semi-volatile organic compounds in air. Part 2. Sorbent selection and other aspects of optimizing air monitoring methods. J. Chromatogr. 1217 (16), 2685–2694.
Wu, Y., Chang, V.W., 2012. Development of analysis of volatile polyfluorinated alkyl substances in indoor air using thermal desorption-gas chromatography-mass spec-trometry. J. Chromatogr. A 1238, 114–120.
Wu, Y., Chang, V.W., 2013. Comparison of solvent extraction and thermal desorption methods for determination of volatile polyfluorinated alkyl substances in the urban atmosphere. Anal. Methods 5, 3410–3417.
Wu, R., Xie, S., 2017. Spatial distribution of ozone formation in china derived from emissions of speciated volatile organic compounds. Environ. Sci. Technol. 51 (5), 2574–2583.
Zhang, Y., Wang, X., Blake, D.R., Li, L., Zhang, Z., Wang, S., Guo, H., Lee, F.S.C., Gao, B., Chan, L., Wu, D., Rowland, F.S., 2012. Aromatic hydrocarbons as ozone precursors before and after outbreak of the 2008financial crisis in the Pearl River Delta region, south China. J. Geophys. Res. Atmos. 117 (D15).