International Journal of
ELECTROCHEMICAL
SCIENCE
www.electrochemsci.orgThe Oxygen Evolution Reaction on Passive Oxide Covered
Transition Metal Electrodes in Alkaline Solution.
Part III – Iron.
Michael E. G Lyons*, Michael P Brandon
Physical and Materials Electrochemistry Laboratory, University of Dublin, Trinity College, Dublin 2, Ireland
*E-mail: [email protected]
Received: 24 October 2008 / Accepted: 6 November 2008 / Published: 17 November 2008
The kinetics of the oxygen evolution reaction (OER) at passive oxide covered polycrystalline Fe electrodes in aqueous alkaline solution were examined using both dc steady state polarisation and ac impedance techniques. It proved difficult to obtain reproducible polarisation data for bright anodes, and so an electrochemical pre-treatment routine was devised. Upon ageing of a given electrode specimen, and with application of the pre-treatment regime before each experiment, it was possible to determine reproducible values of the Tafel slope and the reaction order with respect to OH- ion
activity. The link between OER polarisation behaviour and the changing nature of the passive oxide film, with repeated electrode pre-treatment and experimental utilisation, was characterised by cyclic voltammetry. As was previously found for oxidised Co electrodes, it is necessary to admit a dual energy barrier model in order to rationalise some of the experimental Tafel slope values. By considering the kinetic data presented here, in tandem with complimentary results obtained for extensively aged and also for multicycled iron electrodes, a preferred reaction pathway emerges. The electrode active surface area for the OER has been been estimated using the same current transient decay technique that we have applied to Ni and Co anodes. On this basis, the “real” surface area normalised activity series for the OER amongst the passive oxides of these first row transition metals is outlined.
Keywords: oxygen evolution electrocatalysis, oxidized iron electrodes, transition metal electrochemistry, oxygen evolution mechanisms
1. INTRODUCTION
Ni [1] and Co [2] electrodes in aqueous alkaline solution. The motivations behind this body of work were outlined in the first paper of the series [1].
The oxygen evolution electrocatalytic properties of oxidised Ni electrodes have received much attention in the literature [1], while several independent workers have investigated the details of the reaction at oxidised Co anodes [2]. By contrast, to the best of our knowledge, the only meaningful studies of the kinetics of the OER at oxidised Fe substrates are those of the present authors [3,4] and a rather limited early contribution by Scarr [5]. Our preliminary communication [3] on this matter dealt primarily with the OER electrocatalytic properties of relatively thick polymeric hydrous oxide films generated by the repetitive potential cycling of an iron electrode in alkaline solution. Tafel slopes of
(
)
2.303
b RT F (≈ 60 mV dec-1 at 25ºC) and b2.303 2
(
RT F)
(≈ 120 mV dec-1 at 25ºC) were observed for such electrodes in 1.0 M NaOH solution, at lower and higher oxygen overpotentials respectively. On this basis a possible OER pathway was outlined, that was in essence a modification of the classic mechanism of Krasil’shchikov [6], which is in turn, probably the most commonly cited oxygen evolution pathway for oxide electrodes in the literature.We have revisited this system more recently [4] – in addition to confirming the Tafel slope parameters detailed above, experimental values of the reaction order with respect to OH- ion activity,
mOH-, were determined by conducting OER steady state polarisation experiments in NaOH solutions of
different concentrations. These measurements indicated that a non-integral reaction order of ca. 3/2 is associated with the ~60 mV dec-1 Tafel region, while an order of approximately unity characterises the
higher overpotential straight line Tafel region. Similar experimental values of b and mOH- were
obtained for pre-reduced, “aged”, passive oxide covered Fe anodes [4] – i.e. aged electrodes which were not subjected to potential multi-cycling to deliberately deposit a hydrous oxide phase. Of course, bright iron electrodes spontaneously become passivated upon introduction to an aqueous alkaline solution [7] and the passive oxide is further developed by anodic polarisation [4, 8], with the result that oxygen evolution will always occur at an oxidised iron surface, regardless of whether or not, an oxide has been deliberately grown prior to the OER steady state polarisation experiment. In the case of the “aged” passive oxide covered Fe electrodes mentioned above, reproducibility in OER experiments was ensured by a single prior voltammetric cycle (note, that the electrodes were cathodically pre-reduced before this) [4].
The possession of a more complete kinetic data set (now with well defined mOH- values in
addition to the b values) forced a revision in our viewpoint regarding the most likely pathway for the OER at the aforementioned “types” of oxidised iron electrodes [4] – the modified Krasil’shchikov pathway was rejected in favour of the so-called physisorbed hydrogen peroxide mechanism:
S OH+ −→ −S OH e+ − (AI)
2 2
S OH OH− + − → −S H O +e− (AII)
2 2 2 2
S H O− +OH− → −S HO−+H O (AIII) 2 2 2 2( ) 2
S H O− + −S HO− →O g +H O OH+ − (AIV)
Bockris and Otagawa [9] to describe the OER at perovskite electrode substrates, and is, to the best of our knowledge, uniquely capable, amongst the various OER paths that have been postulated in the literature [9 – 11], of rationalising the set of experimental kinetic parameters that we have observed for multi-cycled and “aged” passive Fe electrodes. The lower overpotential polarisation behaviour is explained, by considering (A II) to be the rate determining step (RDS) under Temkin adsorption conditions (i.e. 0.2 ≤ θ ≤ 0.8, where θ is the fractional coverage of OER intermediate species). The experimental values of b and mOH- obtained at higher overpotentials arise from a conventional kinetic
analysis if (A II) is again taken as the RDS, this time under high coverage Langmuir adsorption conditions (i.e. θ → 1). We have outlined elsewhere [4] the kinetic analysis for the two aforementioned situations in full, as well as discussing the requirement for the formation of a physisorbed, as opposed to chemisorbed, intermediate species in the rate limiting second step. In addition, on the basis of our own voltammetric data, and with reference to some literature sources, we have tentatively suggested [4] that S is an Fe(VI) based entity, stabilised at high anodic potentials on the surface of the outer dispersed and hydrous oxide phases that are likely to exist for both multi-cycled and “aged” iron electrodes in aqueous alkaline media.
In the present article it will be shown that OER polarisation measurements on relatively un-aged, passive oxide covered Fe electrodes, yield different values of b and mOH- to those outlined above
for more aged and for muti-cycled anodes. Despite this it will be shown, in a manner consistent with our interpretation of the OER kinetic data for oxidised Ni [1] and Co [2] electrodes, that a slight modification of scheme (A) can provide a satisfactory rationalisation for each of the sets of experimental parameters (b and associated mOH-) that we have encountered for the various “types” of
oxidised Fe electrodes that we have studied.
Following the mechanistic analysis, a series of current transient decay measurements will be outlined, which were aimed at the estimation of the active surface area of the passive oxide covered Fe electrodes towards the OER, based upon the technique originally described by Ho and Piron [12]. This surface roughness factor estimation technique was also applied to passive oxide covered Ni [1] and Co [2] OER electrodes, thereby enabling us to make a meaningful comparison of the catalytic activities of the passive oxides of the three metals for the OER, based upon the active surface area normalised current density values at a given overpotential.
At the end of the article, we outline our principal conclusions regarding the OER at passive oxide covered, first row transition metal electrodes, based upon the results detailed across the three papers of the series. We believe that these conclusions are worthy of consideration by workers involved in the wider science of OER anodic materials research, particularly since some of the more practically promising materials are oxides and mixed oxides (i.e. spinels or perovskites) of Ni and Co.
2. EXPERIMENTAL PART 2.1. Materials and methods
was utilised. The electrochemical measurements were all performed using a Zahner Elektrik IM6 Impedance measurement unit (with its in-built frequency response analyser (FRA) for electrochemical impedance spectroscopy (EIS) measurements) interfaced to a personal computer. The SIM module of the IM6 Thales software suite facilitated complex non-linear least squares (CNLS) fitting of raw EIS data to equivalent circuit models. Consistency between the measured values of impedance magnitude |Z| and phase angle were checked using the Kramers-Kronig rule check option provided by the Thales software package – any data failing this test were rejected.
All electrolyte solutions were prepared from NaOH pellets (BDH AnalaR®, minimum 98% purity) using millipore water (resistivity > 18 MΩcm). No excess salts were added and all experiments were conducted at 25 ± 1°C. The OH- activity, aOH, for each solution concentration was calculated
using the literature value [13] for the mean ionic activity coefficient, γ±, for an NaOH solution of that
concentration. Electrode roughness factors were estimated using the OHads desorption method of Ho
and Piron [12] – a schematic diagram of the appartus for such measurements was included in the first article of this series [1].
2.2. Electrode preparation and pre-treatment
The iron electrodes were prepared from a 1mm thick polycrystalline iron foil as supplied by Alfa Aesar (Johnson Matthey), purity 99.995% (metals basis). Sections of the foil were cut and filed to a size of 4 mm × 4 mm (exposed geometric surface area = 0.16 cm2), and were then sealed into glass tubes in an identical manner to that described elsewhere1 for the preparation of Ni electrodes. Before its first experimental use, the exposed metal surface was polished successively with 1200 grit carbimet paper and a slurry of 0.05 micron alumina powder (in millipore water) until a “mirror bright” finish was achieved.
As in our communications on the OER at oxidised Ni [1] and Co [2] anodes, it is useful at this stage to distinguish between the various “types” of Fe electrode investigated in the present work. These electrodes are, of course, all just passivated iron, however their OER electrocatalytic properties vary somewhat as a result of differences in pre-treatment or polarisation history. For clarity we will refer to Fe electrodes “types” A – C, where:
• Type A: A bright electrode was polished in a slurry of 0.05 micron alumina powder, rinsed in de-ionised water and used directly in this condition.
• Type B : A bright electrode was polished as for A, but was then pre-reduced in 1.0 M NaOH solution at a potential of –1.1 V (vs. Hg/HgO) for a period of 5 minutes. Following this, the electrode was allowed to rest on open circuit for 10 minutes. The pre-treatment was completed by one potentiodynamic cycle between the limits of –1.175 and 0.625 V in the same 1.0 M NaOH solution, at a scan rate of 40 mV s-1.
• Type C: This is a somewhat aged “type” B anode.
some variability over the course of its first number of polarisation experiments. As will be outlined later, stability was observed after approximately 10 experiments – and it is this stabilised pre-reduced Fe electrode that will be referred to as a “type” C electrode. It is important to note that, prior to each polarisation experiment, the electrode was still subjected to pre-treatment routine B.The reader should also avoid confusing this relatively mildly aged electrode (Type C) with the “aged” Fe electrode mentioned to in the introduction and described elsewhere [4]. The latter refers to an iron electrode that was used in many polarisation experiments (> 40 over the course of four months) and its OER catalytic behaviour is characterised by different values of b and mOH- than were observed (results
section) for the “type” C anode under investigation in the present article.
2.3. Reference and counter eletrodes
A mercuric-mercuric oxide reference electrode (Radiometer Analytical, cat no. XR400) was used throughout the present study. As we have previously discussed [1], the equilibrium oxygen electrode potential is is 0.303 V vs. Hg/HgO in the same solution. It is common practice in the literature [14-16] on the OER, to express potential in terms of the oxygen overpotential, η, when the reference electrode is a Hg/HgO electrode in the same solution as the working anode. In this case η is related to the voltage Emeas measured on the Hg/HgO scale (at a temperature of 298 K) as follows:
0.303
meas
E V
η= − (1)
For the sake of consistency it was elected to use Hg/HgO, 1M NaOH, throughout the present study. It is therefore appropriate to plot polarisation curves on an oxygen overpotential, η, scale, in cases where all the data has been recorded in 1.0 M NaOH solution. This approach is useful for comparing the OER catalytic performance of an electrode, with that of other anodes reported in the literature.
When used in NaOH solutions of different concentrations, the potential of the Hg/HgO electrode was checked relative to a second Hg/HgO, 1 M NaOH electode, both before and after the experiment. No significant potential drift was noted after such experiments, implying that the concentration of the NaOH in the reference electrode chamber remains effectively constant over the time scale of typical polarisation measurements (ca. 2 – 3 hours). In any case, the 1M NaOH solution in the reference electrode, was changed regularly to ensure experimental consistency. Graphs containing data recorded in electrolyte solutions other than 1.0M NaOH, are plotted in terms of the potential, E, vs. Hg/HgO, 1M NaOH.
Finally it is noted that a platinum wire electrode (CH Instruments, Inc. -catalogue no. CHI 115) was employed as the counter electrode.
3. RESULTS AND DISCUSSION
The close interrelationship between the surface redox chemistry of transition metal electrodes and their steady state oxygen evolution polarisation behaviour has been emphasised in the previous instalments of this series, and accordingly it was considered pertinant to provide brief reviews of the aqueous alkaline electrochemistry of Ni [1] and Co [2] electodes before discussing their electrocatalytic activites for the OER. In the case of Fe, we have already discussed the surface oxide and oxyhydroxide electrochemistry in detail some years ago [8] and recently in a more succinct form [4]. We therefore provide a very brief overview of the topic below, and refer the reader who seeks a greater level of detail to our aforementioned earlier works and those of other authors [4, 17 – 23].
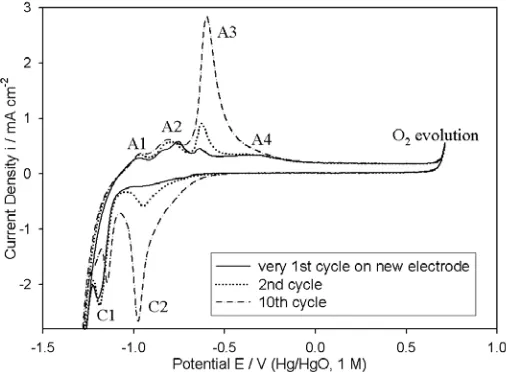
Figure 1. 1st, 2nd and 10th voltammetric cycles (-1.42 V to 0.68 V, 40 mV s-1) for a “type” A iron electrode in 1M NaOH at 25°C.
shown in the present paper that electrode ageing provides an even greater obstacle to the attainment of reproducible OER polarisation data in the case of Fe electrodes, than it did for Ni [1] or Co [2 ]anodes.
It is evident from Fig. 1 that upon repetitive potential cycling, the redox charge capacity Q (as estimated by integration of the voltammetric profile between appropriate limits) is enhanced only for the A3 and C2 peaks. Indeed, we have previously reported [8] that, while the other peaks exhibit zero shift in peak potential with respect to a pH independent reference electrode over a range of solution pH (~7-14), the complimentary peaks A3 and C2 display a super-Nerstian shift of the order of
3 2.303 2
dE RT
dpH F
⎛ ⎞
= − ⎜⎝ ⎟⎠ V/pH unit with increasing pH. Such super-nernstian shifts are characteristic of
electrochemically generated hydrous oxide phases [24].
Bearing in mind the observations of the foregoing paragraph, we have made the following peak assignments [4, 8] in relation to the voltammetric data of Fig. 1. Peak A1 is most probably due to the formation of a layer of adsorbed hydroxyl species,
( )
Fe OH+ − →FeOH ads +e− (2)
In combination with a displacement of adsorbed hydrogen:
FeH ads( )→Fe H+ + +e− (3)
In agreement with other workers [17 – 21], we have proposed [8] that peak A3 is associated with the formation of ferric species, however we have postulated, based on the aforementioned super-nerstian shifts, that the operative reaction is not the formation of species such as Fe2O3 or FeOOH in a
compact well defined phase, but rather a Fe(II)/Fe(III) transition in an outer dispersed hydrous oxide phase. Such a phase is envisaged to result from the hydration and oxidation of the external surface region of the Fe(II) oxides formed in eqns. 4 and 5. The oxide is thus envisaged to take on a dual layer structure [4] in line with a model proposed some time ago by Burke et al.[25 – 27] These workers proposed that for some transition metals (e.g. Ir, Rh and Ni) the anodic oxide comprises an inner compact anhydrous layer MOx and an outer microdispersed hydrous layer of general form
MOa(OH)b(OH2)c.
The decrease in the peak potential of A3 (and indeed its complimentary cathodic peak C2) with increasing pH points to the formation of an anionic hydrous oxyhydroxide species. We have proposed [4] that the complex redox switching process, which forms the outer dispersed hydrous oxide by the oxidation of the hydrated surface region of the Fe(II) based oxide may be written as:
(
) (
)
2(
) (
)
32 6 2 3 3 2 3 3 2 3 3 2 2
Fe OH OH − OH− Fe O OH OH − H O e−
⎡ ⎤ + →⎡ ⎤ + +
⎣ ⎦ ⎣ ⎦ (6)
An equivalent representation, which emphasises the anionic nature of the outer region of the oxide in aqueous alkaline solution, is given by:
[
]
0.5( )
2 2 3.5 2 0.5
( ) 0.5 1.5 ( )
Peak A4 is also related to an Fe(II)/Fe(III) redox transition – however at this potential it is the inner amorphous region of the Fe(II) oxide, close to the metal surface, that is oxidised. Possibly oxidation products are largely anhydrous phases of Fe2O3, Fe3O4 or FeOOH. The cathodic C1 peak, is
in turn related to the reduction of this inner compact layer back to metallic iron. The increasing redox charge associated with the A3/C2 peak pair upon multi-cycling, indicates the importance of the redox switching process in the outer hydrous layer (i.e. that represented by eqn. 6) with regard to the growth of thick multi-cycled oxide phases [4, 8]. In the present article we are more concerned about the initial passivation of Fe electrodes, however the presence of the A3 and C2 peak features in the profile of the 2nd voltammetric cycle of Fig. 1 (recall from earlier this is typical of the 1st cycle of electrodes that have been polished back to a “bright” finish following previous passivation) and indeed in the voltammograms of Fig. 5 indicate that the dual layer nature of the anodic oxide formed on iron is significant from the very beginning of passivation under conditions of anodic polarisation in alkaline media.
In the voltammetric characterisation of passive oxide covered Ni and Co electrodes, it was observed that the rising edge of the OER current density appeared directly anodic to the Ni(II)→Ni(III) oxidation peak in the case of Ni anodes [1], and, for Co electrodes [2], developed from the anodic feature associated with the surface oxidation of Co(III)→Co(IV) species. We therefore concluded (in tandem with some other considerations) that oxygen evolution is most likely catalysed by Ni(III) and Co(IV) entities respectively for oxidised electrodes of these metals. Referring to Fig. 1, it is obvious that the anodic redox peak (A4) closest in potential to the onset of the oxygen evolution current feature, is separated from the latter by approximately ¾ of a volt! This absence of an obvious “preceeding redox transition” in the case of oxygen evolution on oxidised iron, raises questions as to the valance state of the OER electrocatalytic entity for this substrate. As alluded to in the Introduction, we have suggested that the aforementioned active sites are Fe(VI) species. The experimental results on which this hypothesis is based, and the reason why the Fe(III)↔Fe(VI) redox transition is not normally sensitive to detection by voltammetry, have been discussed in detail elsewhere [4].
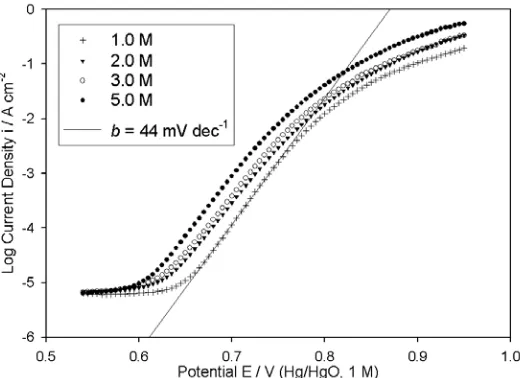
3.2. Steady state polarization measurements: Fe electrode’ type’ A
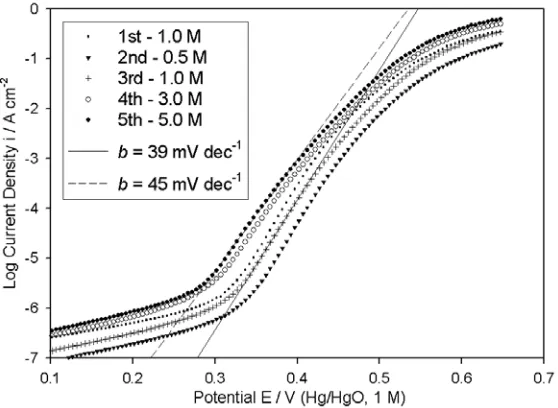
A series of iR compensated OER steady state polarisation curves for a “type” A Fe electrode in various NaOH solutions are presented in Fig. 2. These measurements were conducted on successive days (one experiment per day) in the order indicated in the legend. From the point of view of extracting meaningful values of the reaction order parameter mOH-, several difficulties arise with the
therefore appear, that it is extremely difficult to record reproducible oxygen evolution polarisation data for bright Fe anodes, probably due to electrode ageing effects related to the inability of polishing alone, to completely remove the oxide formed during anodisation, as discussed in the review above on iron oxyhydroxide electrochemistry. Similar problems were noted for bright Ni anodes [1], although in that case we postulated that it was a variation, with ageing, of the relative amounts of the active oxide existing in the β-β or α-γ Bode cycles, that mainly caused the irreproducibility in OER polarisation measurements. By contrast, the polarisation behaviour of bright Co electrodes displayed satisfactory reproducibility, over the course of a number (~10) of successive experiments [2].
Figure 2.iR corrected, OER steady state polarisation curves measured in the direction of increasing potential for a “type” A iron electrode in NaOH solutions of various concentration. These characteristics were recorded on consecutive days in the order indicated in the legend.
A further difficulty is that the value of the Tafel slope in the lower overpotential region increases progressively with increasing OH- concentration, from 39 mV dec-1 (≅2.303 2
(
RT F3)
at 25ºC) for 0.5 and 1.0 M electrolyte to 45 mV dec-1 (≅2.303 4(
RT F5)
at 25ºC) for 5.0 M NaOH solution. The possibility was considered that this observation was an artifact arising from electrode ageing (remember that the 5.0M data was the last to be recorded) – however the measured values of b for each solution remained the same when the polarisation experiments were repeated in the opposite order. A somewhat similar phenomenon was observed [2] for OER polarisation measurements performed with bright (non-electrochemically pre-treated) Co electrodes, although in that case the directly opposite trend prevailed – i.e. the Tafel slope decreased from b≅2.303 4(
RT F5)
for 1.0 M NaOH to b≅2.303 2(
RT F3)
for 5.0 M NaOH.electrochemical pre-reduction routines and consequently it was decided that a similar approach was necessary in the present case.
3.3. Steady state polarization measurements : Fe electrode’ type’ B
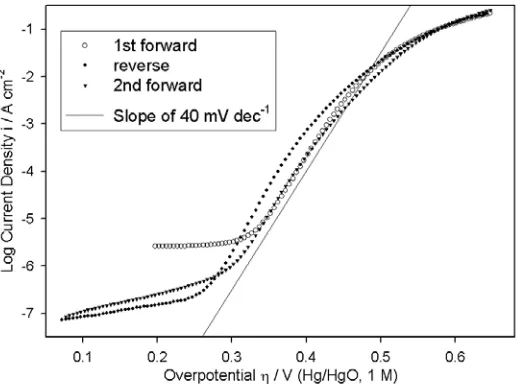
[image:10.612.173.433.272.464.2]A bi-directional oxygen evolution steady state polarisation curve, recorded in 1.0 M NaOH for an Fe electrode that had been subjected to pre-treatment routine B, as outlined in the Experimental section, is presented in Fig. 3. As we previously noted for oxidised Ni [1] and Co [2] electrodes there is significant hysterisis between the log i(η) characteristic recorded in the direction of increasing potential (forward) and that of the direction of decreasing potential (reverse). Such hysterisis was also observed for A and C “type” Fe anodes.
Figure 3. Bi-directional, iR corrected, OER steady state polarisation curve for a “type” B iron electrode in 1.0 M NaOH at 25°C. This data was recorded continuously, started in the direction of increasing potential.
In the case of Ni and Co OER electrodes, the scans in opposing directions were largely coincident at potentials associated with the lower straight line Tafel region, while at higher overpotentials the reverse direction sweeps were characterized by lower values of log i at a given η than were prior sweeps recorded in the direction of increasing potential. The issue of hysterisis in OER steady state polarisation characteristics has received very little attention in the literature, with the majority of authors detailing measurements recorded in one direction only. A notable exception in this regard are Kobussen et al., who reported hysterisis of a similar nature to that described above for Ni and Co anodes, in OER studies at both La0.5Ba0.5CoO3 [28] and polycrystalline Co [14] electrodes in
alkaline solution. In the La0.5Ba0.5CoO3 case they attributed the decrease in activity on a reverse
however inconsistent with our viewpoint [2] that it is Co(IV) entities that are electrocatalytically active for the OER. The hysterisis effect might instead be understood in terms of a decrease in the conductivity of the underlying oxide phase accompanying polarisation at high overpotentials, arising either from film thickening or due to a change in the nature of the oxide (related possibly to dehydration at extreme potentials).
Whatever the origin of the aforementioned effects for Ni, Co and La0.5Ba0.5CoO3 anodes, it is
apparent from Fig. 3, that the hysterisis in oxidised Fe OER polarisation curves is entirely different. In this case the the reverse direction scan displays superior OER activity relative to the prior forward scan, over a range of overpotentials from ca. 335 mV to ca. 500 mV. In addition the slope of the straight line Tafel region on the reverse sweep is slightly less (~36 mV dec-1) than that observed for the forward sweeps (~40 mV dec-1). The indication here is, that for oxidised iron electrodes, polarisation at extreme anodic potentials either produces a greater surface density of the Fe(VI) OER electrocatalytic entity or alternatively reduces the resistivity of the passive oxide.
It should be noted that the type of hysterisis described above for Fe electrodes also prevails when the reverse direction sweep is performed first (following stabilsation of the current density at a high overpotential) with the subsequent (and continuous) recording of the scan in the direction of increasing potential. However, while satisfactory reproducibility in OER steady state measurements was finally achieved for pre-reduced electrodes with the first polarisation sweep in the forward direction (as will be described presently), it couldn’t be achieved for the case of pre-oxidation followed by polarisation in the direction of decreasing potential. The latter approach was successfully adopted for the measurement of OER polarisation curves at Pt electrodes by Damjanovic et al. [30-32], but given the intrinsic differences in the anodic oxidation mechanism of Pt compared to base metals such as Fe [7], it is not surprising that it is much more difficult to restore an Fe electrode to a pre-polarisation state (by electrochemical reduction and polishing) than is the case for Pt.
In view of the comments of the two foregoing paragraphs, the experimental values of b and mOH- considered in this article have been extracted from the first steady state polarisation sweep in the
direction of increasing potential for each of the “types” of Fe electrode. This approach is consistent with the methodology adopted in the prior instalments of this series [1, 2], the reasoning behind which, has been discussed previously [ 1].
while the electrode was subjected, before each polarisation measurement, to the pre-reduction regime outlined above, and was polished thoroughly subsequent to each experiment, it appears that an ageing process was still able to influence its electrocatalytic properties towards the OER – c.f. the above review of the electrochemistry of Fe electodes.
Figure 4. Comparison of iR corrected steady state polarisation curves, recorded in the direction of increasing potential in 1.0 M NaOH, for “type” B and “type” C iron electrodes.
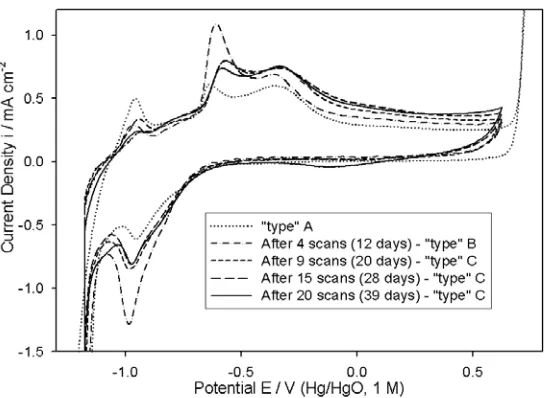
Figure 5. Cyclic voltammograms (1 M NaOH with scan rate of 40 mV s-1) characterising the changing nature, with electrochemical ageing, of the passive oxide film formed on a polycrystalline Fe electrode surface. All CVs, except that of the “type” A electrode, were recorded immediately following pre-reduction of the electrode at –1.1 V for 5 minutes in the same 1 M NaOH solution.
[image:12.612.166.439.396.595.2]electrode ageing – see Fig. 5. This figure shows the development of the CV profile of a Fe electrode specimen from its initial characterisation after preparation (“type” A), to the stage at which it has become well aged, after 20 steady state polarisation experiments in NaOH solutions of various concentrations, over a period of 39 days. The “type” B polarisation curve of Fig. 4 was recorded for the electrode characterised by the “after 4 scans” profile of Fig. 5.
It can be appreciated that the CV profiles become largely similar from that recorded after 9 scans onward. This stabilisation of the CV after pre-reduction, corresponded to the stabilisation of the Tafel slopes observed in subsequent 1.0 M steady state polarisation measurements, to values of the order of 5 – 7 mVdec-1 greater than those observed in the initial experiments on the pre-reduced electrode. Accordingly, the “type” C polarisation curve of Fig. 4 was recorded for the electrode characterised by the “After 15 scans” profile of Fig. 5. Further ageing of the electrode didn’t bring about any significant change in Tafel slope – a polarisation curve recorded in 1.0 M NaOH for the electrode characterised by the “After 20 scans” CV of Fig. 5 exhibited a Tafel slope of ca. 45 mV dec
-1. The significance, with regard to OER polarisation behaviour, of this variation in voltammetric
profile with electrode ageing will be discussed later.
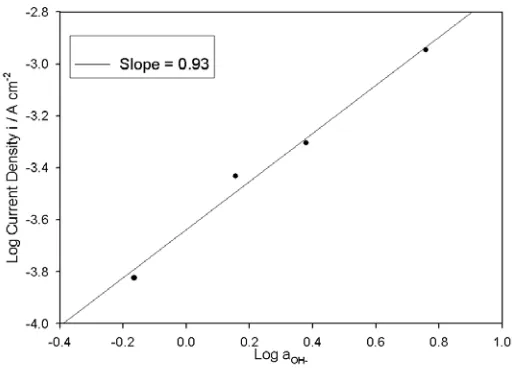
3.4. Steady state polarization measurements : Fe electrode’ type’ C
[image:13.612.174.434.491.680.2]It was found that “type” C Fe electrodes characterised by voltammograms similar in profile to the later scans of Fig. 5, facilitated the measurement of reasonably reproducible oxygen evolution steady state polarisation characteristics over a range of NaOH concentrations from 1.0 – 5.0 M – see Fig. 6. For each of these electrolyte concentrations, lower straight line Tafel regions were observed with slopes in the range of 44 – 47 mV dec-1 (≅2.303 4
(
RT F5)
at 25ºC), in contrast to the situation that prevailed for “type” A electrodes (Fig. 2).Reaction order plot were constructed, based upon the data of Fig. 6 at potentials associated with the aforementioned Tafel region. Typical of these plots is that presented in Fig. 7. The linearity of this reaction order plot is not altogether satisfactory, possibly owing to the fact that the Tafel slopes for the 2.0 and 3.0 M NaOH solutions are slightly larger (~ 47 mV dec-1) than those of the 1.0 and 5.0 M solutions (~ 44 mV dec-1). It is however resonable to conclude that the reaction order parameter is approximately unity, and certainly does not approach the non-integral value of mOH- ≈ 3/2 noted at
[image:14.612.175.432.202.386.2]lower overpotentials for both multi-cycled and extremely “aged” Fe anodes [4].
Figure 7. Reaction order plot based on the steady state polarisation data of Fig. 6 at a potential of E = 0.705 V.
3.5. Electrochemical Impedance Spectroscopy (EIS) measurements
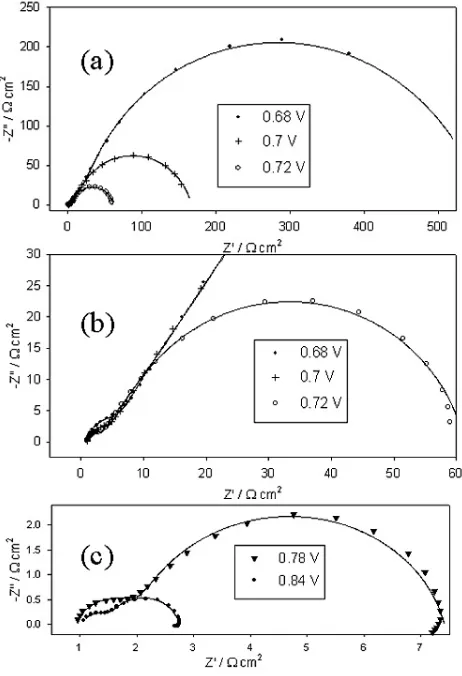
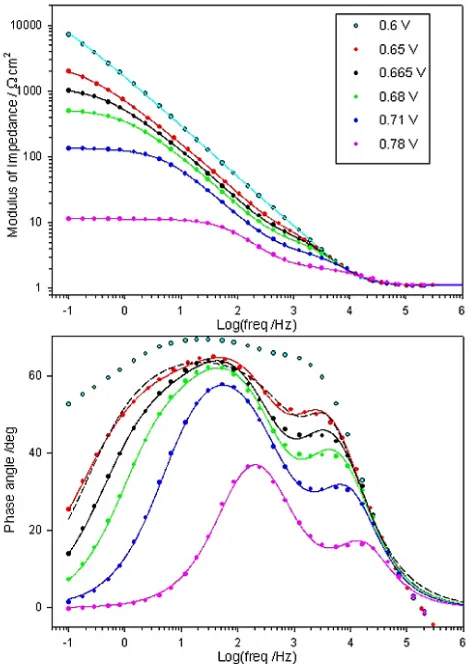
Electrochemical impedance spectra, recorded successively in the direction of increasing potential for a “type” A Fe electrode in 1.0 M NaOH solution are presented in the Bode format in Fig. 8. The same data is also plotted in the complex plane (Nyquist) format in Fig. 9. In addition, the EIS responses of a “type” C Fe electrode in 1.0 M NaOH, at various potentials associated with significant oxygen evolution current density, are depicted in Bode format in Fig. 10.
Figure 8. Bode plots recorded at various potentials within the region of significant OER current density for a “type” A Fe electrode in 1.0 M NaOH solution. The raw data is represented by the circles, while the continuous lines plot the optimised transfer functions for the relevant equivalent circuit model (Fig. 11). The dashed line represents the transfer function yielded by attempting to fit the data recorded at 0.68 V to a two RC loop circuit model similar to Circuit B of Fig. 11.
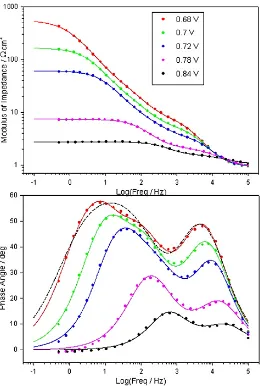
The peak feature at frequencies between 103 and 105 Hz in the phase angle vs. log frequency
Bode plots of Figs. 8 and 10 is indicative of the relaxation of the dielectric properties and resistivity of the passive oxide film. In the Nyquist plots of Fig. 9 this oxide film impedance response is manifested as the smaller, high frequency psuedo-semi-circular feature. The CfilmRfilm loop of the equivalent
circuits of Fig 11 models these oxide film electrical properties. The various other circuit elements retain the significance assigned to them earlier in this series, when they formed the simpler equivalent circuit models that were sufficient to simulate the impedance response of passive oxide covered Ni [1] and Co [2] OER anodes. Recapping briefly, RΩ represents the uncompensated electrolyte resistance, while the Cdl element models the double layer capacitance. The resistive elements Rp and Rs are related
in parallel with the resistance, Rs, models correctly the relaxation of the charge associated with the
adsorbed intermediate(s) [34]. In Figs. 8 – 10, the simulated impedance responses of the equivalent circuit models when the various elements take on their optimised values (for a given potential) are presented as continuous traces, whereas the measured raw data is represented as discrete points.
Figure 9. Nyquist representations of the impedance data of Fig. 8; (a) the data recorded at lower overpotentials, (b) a higher resolution view of the aforementioned data, (c) higher overpotential EIS data. Again the continuous lines are generated by the results of the CNLS fitting process, while the discrete points represent the raw data.
In the case of the EIS spectra that we have presented elsewhere [4] for extremely aged Fe OER electrodes, the phase angle vs. log freq. Bode plots were characterised at lower overpotentials by three very distinct capacitance peaks (modelled, in order of decreasing frequency by the Cfilm, Cdl, and Cø
[image:16.612.189.420.144.482.2]Figure 10. Bode plots recorded at various potentials for a “type” C Fe electrode in 1.0 M NaOH solution. The comments of the caption of Fig. 8 also apply here. The dashed line represents the transfer function obtained by attempting to fit the data recorded at 0.65 V to a two RC loop equivalent circuit model.
[image:17.612.188.423.70.402.2]Figure 11. Equivalent circuit models used in the CNLS fitting of the impedance data of Figs. 8 - 10. As discussed in the text, Circuit A reduces to Circuit B at higher overpotentials.
Table 1(a). Optimum fit parameters for the CNLS fitting of the data of figs.8 and 9 to Circuit A (lower overpotentials).
E V
Rs
Ωcm2
Cø
µFcm -2
α Rp
Ωcm2
Cdl
µFcm -2
α Rfilm
Ωcm2
Cfilm
µFcm -2
α RΩ
Ωcm2
0.68 446.8 85.2 0.97 110.3 59.3 0.78 4.44 19.65 0.94 0.91 0.7 110.4 135.8 0.98 52.3 85.4 0.81 3.42 18.26 0.92 0.91 0.72 40.6 128.8 0.92 17.5 104.1 0.84 2.25 17.11 0.93 0.94
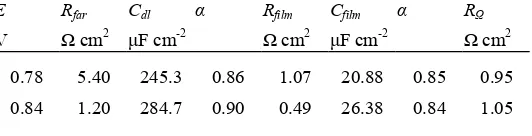
Table 1(b). Optimum fit parameters for the CNLS fitting of the data of Figs. 8 and 9 to Circuit B (Higher overpotentials).
E
V
Rfar
Ω cm2
Cdl
µF cm-2
α Rfilm
Ω cm2
Cfilm
µF cm-2
α RΩ
Ω cm2
0.78 5.40 245.3 0.86 1.07 20.88 0.85 0.95 0.84 1.20 284.7 0.90 0.49 26.38 0.84 1.05
[image:18.612.202.407.68.266.2] [image:18.612.171.439.383.470.2] [image:18.612.175.441.542.610.2]still be obtained for Cø at these higher potentials (E = 0.78 and 0.84 V for the data of Figs. 8 and 10),
however the fitting program output indicates that they have little significance. The best-fit values of the equivalent circuit elements for the CNLS fitting of the EIS data of Figs. 8 and 10 are listed in Tables 1 and 2 respectively. A feature common to the equivalent circuit analysis of the present article, and that performed for oxidised Ni [1] and Co [2] OER anodes in the previous parts of this series, is the need to use constant phase elements (CPEs) in place of pure capacitors, in order to simulate frequency dispersion in the experimental capacitive response. The depressed nature of the complex plane semicircles of Fig. 9 are indicative of such dispersion, the physical origin of which is believed to lie in electrode surface roughness and inhomogeneities [35]. The mathematical treatment, in terms of the CPE model, of a capacitive process displaying such frequency dispersion takes the form:
ZCPE A j( ω) α
−
= (8)
In eqn. 8, A = 1/Cα=1, where Cα=1 is the value of the capacitance in the absence of frequency
dispersion, and α is an exponent (α ≤ 1 for a physically reasonable situation) equal to unity in the case of an ideal capacitor. The result of a CNLS fitting of raw impedance data to a CPE using the SIM program, is an output in the form of optimised values for Cα=1 and α.
Table 2(a). Optimum fit parameters for the CNLS fitting of the data of CNLS fitting of the data of fig.10 to Circuit A (lower overpotentials).
E V
Rs
Ωcm2
Cø
µFcm -2
α Rp
Ωcm2
Cdl
µFcm -2
α Rfilm
Ωcm2
Cfilm
µFcm -2
α RΩ
Ωcm2
0.65 2719.8 8.2 0.61 208.6 42.5 0.87 4.29 28.13 0.91 1.11 .665 923.0 17.1 0.66 238.3 53.7 0.86 3.83 24.19 0.91 1.11 0.68 338.6 30.0 0.80 182.3 64.1 0.85 3.04 22.31 0.91 1.11 0.71 73.0 48.5 0.81 59.13 86.6 0.85 1.89 20.01 0.94 1.11
Table 2(b). Optimum fit parameters for the CNLS fitting of the data of Fig. 10 to Circuit B (higher overpotentials).
E
V
Rfar
Ω cm2
Cdl
µF cm -2
α Rfilm
Ω cm2
Cfilm
µF cm -2
α RΩ
Ω cm2
0.78 9.46 159.7 0.86 0.777 17.88 0.99 1.15 0.84 2.16 165.3 0.85 0.494 14.17 0.98 1.18
[image:19.612.169.441.406.508.2] [image:19.612.187.425.569.636.2]0 1
log log 2.303
far
i
R b b
η
⎛ ⎞ ⎛ ⎞
= +
⎜ ⎟ ⎜ ⎟
⎜ ⎟ ⎝ ⎠
⎝ ⎠ (9)
This equation implies that that the inverse slope of a plot of log (1/Rfar) against η is equal to the
Tafel slope b. At lower overpotentials where Circuit A applies, Rfar = Rs + Rp. Therefore the listed
fitting parameters of Tables 1 and 2 can be used to verify the values of b obtained by the dc steady state polarisation technique for “type” A and C Fe electrodes respectively. Plots of log (1/Rfar) against
η for these two electrodes are presented in Fig. 12. It is apparent that there is excellent agreement between the values of the Tafel slopes obtained from the impedance data, bEIS, and those obtained by
the steady state polarisation method, bSS. For the “type” A Fe electrode, bEIS = 41 mV dec-1 compared
to the value of bSS =39 mV dec-1 for the same system (Fig. 2, 1.0 M). In the case of the “type” C Fe
electrode in 1.0 M NaOH, bEIS = 45 mV dec-1 while bSS = 44 mV dec-1 (Fig. 6).
Figure 12. Log (Rfar)-1 vs. η plots constructed from the impedance data of Figs. 8 (“type” A electrode)
and 10 (“type” C electrode).
3.6. Mechanistic pathway for oxygen evolution
As outlined above, irreproducibility in OER polarisation measurements, rendered more challenging the task of the experimental determination of the kinetic parameters b and mOH- for
relatively un-aged passive oxide covered Fe electrodes, than was the case for passivated Ni [1] and Co [2] electrodes and indeed for multicycled and extremely aged Fe anodes [4]. Summarising briefly, for non-electrochemically pre-treated Fe electrodes (“type” A) the Tafel slope was observed to vary with increasing electrolyte concentration from 2.303 2
(
RT F3)
in 1.0 M NaOH to 2.303 4(
RT F5)
in 5.0 M NaOH, thus creating a problem for the meaningful determination of mOH-. In any case the [image:20.612.141.452.273.497.2]the same NaOH solution. At first, the electrochemical pre-reduction of a freshly prepared electrode didn’t improve the situation, with b observed to increase progressively from 2.303 2
(
RT F3)
to(
)
2.303 4RT F5
in 1.0 M NaOH, over the course of the first 10 experiments, despite the application of pre-treatment routine B prior to each experiment. However, it was noted that subsequent to these initial 10 or so experiments, the Tafel slope of b 2.303 4
(
RT F5)
was observed reproducibly in successive measurements and so the electrocatalytic behaviour of the electrode had become stable for the OER (“type” C electrode). Furthermore this same value ofb≅2.303 4(
RT F5)
characterised the lower overpotential oxygen evolution polarisation behaviour for various electrolyte solutions where 1.0 M ≤ [OH-] ≤ 5.0 M, thus facilitating the determination of a value of mOH- = ~ 1 for the reactionorder parameter. Therefore the identification of an OER pathway, the kinetic analysis of which yields
(
)
2.303 4 5
b RT F with mOH- = 1, would seem to be a good starting point in the rationalisation of the
experimental data for the various iron electrodes.
In fact the aforementioned combination of experimental values of b and mOH- has already been
encountered in the present series for the OER on pre-reduced Co electrodes [2]. As we commented in that case, a Tafel slope of b 2.303 4
(
RT F5)
cannot be reconciled with any of the standard OER mechanisms proposed in the literature, regardless of which step is chosen as rate-determining or whether the Langmuir or Temkin isotherm is admitted to describe the potential dependent coverage of the reaction intermediates – cf. ref. 9, Table II. However, it is possible to account for such a Tafel slope, if a dual barrier model of the metallic electrode/solution interface is admitted. One such model that is applicable to the present system proposes that only a fraction of the total potential difference, E, between the metallic electrode and the solution is effective in charge transfer at the electrode/solution interface, with the remainder of the potential drop occurring across an electronically conductive barrier oxide layer, through which the charge passed during the course of the OER must migrate under the influence of an electric field. This model was first developed by Meyer [36] for cathodic processes at oxide covered zirconium electrodes and was subsequently applied by MacDonald and Conway [37] to the OER at gold anodes in both acidic and basic aqueous solutions. We have discussed the model in detail elsewhere [2] and to avoid repetition we provide only a functional outline below.The model envisages a potential drop of Vf, related to a field driven charge migration process
across the barrier oxide, in series with the potential drop, Vs, affecting the electrochemical charge
transfer process (i.e. the OER) at the electrode/solution interface. Thus the total applied potential, E, can be expressed as the simple sum: E = Vf + Vs. In the normal kinetic analysis (i.e. where the only
potential barrier is that to the electrochemical interfacial charge transfer) of a OER pathway, that yields a Tafel slope of b=2.303 2
(
RT F3)
when a particular step is considered to be rate limiting, the overall current density i at an applied potential E can be written as,(
)
0
1
exp s FE
i wi
RT β
+
⎡ ⎤
= ⎢ ⎥
where, w is a constant which would be equal to unity, had we chosen to represent the potential in terms of the oxygen overpotential η. If the charge transfer barrier for the rate determining step is considered to be symmetrical, then βs = ½, and b= ∂ ∂E logi=2.303 2
(
RT F3)
.On the other hand, under the dual barrier model, when the OER is proceeding in the steady state, its RDS must be in equilibrium with the charge transport process across the oxide film. If rate equation (10) is equated with the rate equation for the barrier oxide charge migration process, it can be shown [2, 36] that the overall current density, i, across the two barriers is given by,
(
1)
exp FE i W RT βΣ + ⎡ ⎤ = ⎢ ⎥
⎣ ⎦ (11)
Where f s f s β β β β β
Σ = + (12)
and W is a constant, the nature of which we outlined previously [2]. In eqn. 12, βf is the symmetry
factor for the field assisted migration of the charge carriers in the barrier oxide film, and so the βΣ term has the significance of an overall symmetry factor taking account of the two charge transfer barriers. If we adopt the usual assumption that both of these barriers are symmetrical, then βs = βf = ½
and soβΣ = ¼. Inserting this value of βΣ in eqn. 11, and performing a logarithmic analysis yields a value of b= ∂ ∂E logi=2.303 4
(
RT F5)
, where dual barrier conditions prevail. It can therefore be concluded, that if the dual barrier model applies to oxygen evolution at our “type” C Fe electrodes, then the observed Tafel slope of 2.303 4(
RT F5)
is indicative of a pathway (with a given RDS) which leads to a prediction of b=2.303 2(
RT F3)
when the more usual “single barrier” type of kinetic analysis is applied.MacDonald and Conway [37] didn’t extend their analysis to the effect of the dual barrier model on the predicted value of the reaction order, However after Meyer [36], we have shown [2] that under dual barrier conditions, the experimentally measured reaction order with respect to the activity, as, of a
particular reactant species in the electrochemical charge transfer reaction, (∂logi/∂logas)E, is given by
the expression,
log log
s f
s E f s
m i a β β β ⎛ ∂ ⎞ = ⎜∂ ⎟ +
⎝ ⎠ (13)
where, ms, is the value that would be measured for the relevant reaction order in the absence of the
oxide film charge transport related potential barrier. If we again assume that βf = βs = ½, then the
quantity βf /βf +βs = ½. Substituting the measured value of (∂logi/∂logas)E≈ 1 into eqn. 13, therefore
yields ms = 2. This leads to the conclusion, that if we admit the dual barrier model to explain the
conventional (single barrier) kinetic analysis of which, yields predictions of b = 2.303×2RT/3F and mOH- = 2.
As we discussed when dealing with the experimental data obtained for pre-reduced Co electrodes [2], several of the commonly proposed OER pathways can account for the aforementioned kinetic parameters, where in each case a particular step is considered to be rate determining with a low fractional coverage (i.e. θ → 0) of the reaction intermediates prevailing – c.f. Table II of ref. 9. For these Co anodes, a clue to the most likely pathway was provided by experimental data obtained for the OER on aged electrode specimens – at lower overpotentials it was found that b = ~60 mV dec-1 (≈ 2.303×RT/F at 25°C) with mOH- = ~3/2, while for higher potentials the observed values of these
parameters were b = ~120 mV dec-1 (≈ 2.303×2RT/F at 25°C) with mOH- = ~1. Recall from the
introduction to the present article, that we have observed an identical set of OER kinetic parameters for multi-cycled and “aged” Fe electrodes4 and have rationalised it in terms of the physisorbed hydrogen peroxide pathway (A). Thus it would appear that passive oxide covered Co and Fe electrodes exhibit very similar OER polarisation behaviour, with relatively un-aged, pre-reduced anodes characterised by b = ~2.303×4RT/5F and mOH- = ~1 (equivalent to b = ~2.303×2RT/3F and mOH- = ~2 when the dual
barrier effect is factored out) at lower overpotentials, which alters with ageing to b = ~2.303×RT/F and mOH- = ~3/2 in this same lower overpotential range, while for the “aged” electrodes at higher
overpotentials, a second straight-line Tafel region (b = ~2.303×2RT/F and mOH- = ~1) is also
reproducibly resolved. In our communication on the OER at Co electrodes [2], it was shown that a mechanism very similar to pathway (A) could account for the experimental data observed for the relatively fresh Co electrodes as well as for the aged anodes of the same metal. A pathway analogous to that proposed for Co [2], is outlined below for oxide covered Fe electrodes:
[
( ) ( )]
[
( ) ( ) 1]
p p
m n m n
Fe VI O OH − OH− Fe VI O OH − e− +
+ → + (BI)
[
( ) ( ) 1]
[
( ) ( ) 2 2]
p p
m n m n
Fe VI O OH − OH− Fe VI O OH H O − e−
+ + → − + (BII)
[
( ) ( ) 2 2]
[
( ) ( ) 2]
2p p
m n m n
Fe VI O OH −H O −+OH− → Fe VI O OH −HO −+H O e+ − (BIII)
[
( ) ( ) 2]
[
( ) ( )]
2( ) 2p p
m n m n
Fe VI O OH −HO −+OH− → Fe VI O OH −+O g +H O e+ − (BIV)
The important features of this mechanism are as follows:
2 2 H O
− represents physisorbed hydrogen peroxide.
• For cobalt, we demonstrated [2] that such a mechanism (identical to (B), except developing from a [Co(IV)Om(OH)n]p- (p=2m+n-4) active site in step I) can account for
(
)
2.303 2 3
b= RT F , andmOH− =2, where the second step is considered to be the RDS, with θ → 0.
• As outlined in the Introduction and discussed in detail elsewhere [4], the kinetic parameters for “aged” Fe (and also aged Co [2]) anodes can also be rationalised by admitting the physisorbed hydrogen peroxide type of mechanism with the second step rate limiting. A formal kinetic analysis [4] shows that b=2.303
(
RT F m)
, OH− =3/ 2 is expected if an intermediate fractional coverage of reaction intermediates is achieved (0.2 ≤ θ ≤ 0.8), changing to b=2.303 2(
RT F m)
, OH− =1 where full surface coverage is approached (θ → 1).• As previously mentioned, mechanism (B) is only one of several candidate pathways which can account for the measured kinetics in the case of the relatively un-aged Fe electrodes dealt with in this article. However, the physisorbed peroxide mechanism ((A) or (B)) is, to the best of our knowledge, uniquely capable of accounting for the experimental value of b = ~60 mV dec-1 with mOH- = ~3/2, observed for aged Fe [4] and Co [2] electrodes. In view of
this, we have previously proposed [2] for oxidised Co electrodes, that a pathway analogous to (B) is most likely to be that operative for the OER. This prediction was made on the basis that regardless of electrode age, or passive oxide film thickness, one is fundamentally dealing with electrocatalysis at the surface of a rather hydrated cobalt oxyhydroxide film and therefore the nature of the active sites and the reaction mechanism should remain unchanged. Changes in b and mOH- with electrode ageing at lower oxygen overpotentials,
therefore occur, not due to a change in reaction mechanism, but instead due to a change in the appropriate intermediate adsorption isotherm from Langmuir (θ → 0) for fresher electrodes to Temkin (0.2 ≤ θ ≤ 0.8) for aged anodes. This logic should also apply to the Fe electrodes considered in the present article, and to the “aged” and multi-cycled Fe anodes described elsewhere [4]. We therefore propose that pathway B (with step (B II) as the RDS) is the most likely mechanism for oxygen evolution at oxidised iron electrodes in aqueous alkaline solution.
amphoteric character displayed by an anodic oxide is expected to be proportional to its degree of hydration [4, 8, 24]. It is therefore expected that “aged” and multi-cycled Fe electrodes would contain a larger surface density of the catalytically active, complex anionic [Fe(VI)Om(OH)n]p- species at lower overpotentials, relative to fresher Fe
electrodes.
• Pathway (B) has been devised in preference to the original physisorbed hydrogen peroxide mechanism, (A), because in the case of the latter, it is intuitively rather difficult to understand how the chemical recombination step, (A IV), could proceed at a sufficient velocity under low coverage Langmuir conditions, such as not to render it rate-limiting for the entire process. We have commented further on this matter previously [2]. It is worth noting that when Bockris and Otagawa [9] originally outlined scheme (A), their kinetic data was suggestive of the applicability of the Temkin adsorption isotherm at lower overpotentials and thus the aforementioned reservation didn’t arise.
3.7. The physical origin of the oxide charge transport barrier
When discussing the differences in the OER steady state polarisation behaviour of “type” B and C Fe electrodes in 1.0 M NaOH (Fig. 4), we commented without further elaboration, that a comparison of the “After 4 scans” (“type” B) voltammetric trace of Fig. 5 with the later profiles of the same figure (now characteristic of a “type” C anode) could be useful in elucidating this matter. Of particular interest is the fact that the A3/C2 peak pair is significantly more prominent (i.e. is characterised by a greater associated redox charge capacity Q) in the voltammogram for the “type” B electrode, relative to the profiles for the more aged anodes (“type” C). We recall from the review of the electrochemistry of Fe electrodes presented earlier in this article, that this peak pair has been attributed to the formation and reduction of an outer, dispersed, hydrous Fe(III) based oxy-hydroxide layer [4, 8].
we commented that, under the dual layer structural model for anodic oxides proposed by Burke et al.[25 – 27], the inner region is envisaged to consist of a rigid network of polar covalent bonds, through which ionic transport is difficult – such a model is consistent with the “barrier oxide” of the analyses of Meyer [36] and MacDonald and Conway [37]. On the other hand, the outer dispersed region of the oxide is considered to have a structure similar to that of redox polymers, with electron transfer along the “polymer” strands facilitated by self exchange between neighbouring oxy metal groups – we have demonstrated elsewhere [4] that the average diffusion coefficient for charge percolation through anodically generated hydrous iron oxy-hydroxide films is similar in magnitude to that reported for electronically conductive organic polymers such as polyaniline or poly(pyrrole).
While the increase in OER Tafel slope, which accompanies the ageing of “type” B to “type” C Fe electrodes, can be rationalized in terms of the simultaneous increase in the influence of the anhydrous inner region on charge transport across the oxide film, it is clear that such an explanation is inadequate with regard to the variation of Tafel slope with OH- concentration observed for fresh “type” A anodes in Fig. 2. The latter effect is more difficult to explain, since, for these electrodes there were no pre-treatment CVs – recall that prior to steady state polarisation experiments, “type” A anodes were subject to mechanical polishing only. Instead, in an attempt to understand the aforementioned experimental observations, we appeal to our experiences [4] with hydrous oxide films generated by the repetitive potential cycling of an iron electrode in NaOH solutions of various concentrations.
For such oxide films, voltammetry experiments were conducted to examine the influence of OH- ion concentration on the extent of hydrous film growth, which was quantified in terms of the charge capacity, Q, evaluated by integration of the A3 anodic peak. In the case of oxide layers grown for a shorter activation time (5 minutes) a maximum charge capacity was observed at [OH-] = 1.0 M. However for layers grown for 20 minutes the maximum value of Q was noted for [OH-] = 0.1 M, with a sharp decrease in charge capacity with increasing hydroxide ion concentration. On the basis of these results we postulated that the behaviour noted for longer times was due to a suppression of hydroxide dissociation with increased OH- ion concentration, causing an inhibition of crystallisation of the hydrous outer layer. This in turn leads to the formation of a more amorphous film structure that is more effective in excluding water from the inner region of the film, thereby inhibiting the growth of the dispersed outer hydrous layer. The net effect of this is that the inner compact layer will have an increasing influence on the overall surface electrochemistry of an Fe electrode with increasing OH -concentration. Thus the explanation for the increase in Tafel slope for “type” A Fe electrodes with increasing NaOH solution concentration, may be effectively equivalent to that forwarded for the similar Tafel slope increase that accompanies electrode ageing. It is recognised however, that drawing direct parallels between the growth of oxide films by repetitive potential cycling, and their growth during slow potential stepping experiments associated with recording of steady state polarisation curves, may not be an entirely valid exercise.
The oxide film resistance Rfilm, as characterised by EIS should not be identified with the
resistance of the barrier layer as discussed above. This is demonstrated by the Tafel plot for the “type” C electrode in Fig. 12. The dual barrier Tafel slope value of b = ~2.303×4RT/5F is obtained in this case even though the analysis is based only on Rfar (see eqn. 9) which does not include Rfilm. In fact the
vs. η rather than Log[Rfar-1] vs. η makes practically no difference to the Tafel slopes presented in Fig.
12. Furthermore, no high frequency RfilmCfilm impedance response is observed for oxidised Co anodes
[2] even though the dual barrier model also applies to this system. The physical origin of the RfilmCfilm
relaxtion process for passive oxide covered Fe electrodes is discussed elsewhere [33].
3.8. Estimation of electrode roughness factors
At the beginning [1 ]of the present series of articles, one of the stated aims was the performance of a comparative analysis of the oxygen evolution performance of passive oxide covered Ni, Co and Fe electrodes. Clearly if this is to be conducted in a meaningful manner it is necessary to normalize the recorded values of the OER current (as a function of overpotential) to the active electrode surface area as opposed to the geometric surface area. However as was discussed in an IUPAC commission report [38], the experimental evaluation of electrode roughness factors, fr, is a
rather imprecise science and this is particularly true for electrodes of base metals covered by anodic oxide films, for which there is a scarity of applicable techniques. In view of this, we have turned to a rather novel in-situ approach (the OHads desorption method) originally proposed by Ho and Piron for
the estimation of the active surface areas for the OER, of electrodeposited Ni, Co and Ni-Co alloy electrodes [12]. As we previously discussed for our Co electrodes [2] and some of our Ni anodes [1], the significant deviation from unity of the values of the double layer CPE α parameter listed in Tables 1 and 2, indicate that application of the double layer capacitance ratio method is probably not viable for a meaningful estimation of fr for our oxidised Fe electrodes.
Figure 13. Raw decay current transients for a “type” B Fe electrode in 1.0 M NaOH solution. Indicated are the overpotentials corresponding to the values of iappl in each case.
A detailed discussion of the OHads desorption technique and the assumptions upon which it is
[image:27.612.177.431.431.609.2]the working electrode at a number of current densities, iappl, corresponding to the OER proceeding in
the steady state at known overpotentials η. Upon interruption of the charging current, the electrode is allowed to discharge to ground through a 1Ω series resistor, with the cathodic decay current–time (i-t) transient recorded by a digital storage oscilloscope connected across the resistor. Integration of this transient between the time of termination of the polarisation and that at which the decay current becomes zero, yields a value for the total charge, Qdec, passed during the course of the discharge
process, which is envisaged to occur by the desorption of the intermediate species involved in the OER.
Referring to the voltammograms of Figs. 1 or 5, recorded for Fe electrodes in 1.0 M NaOH solution, it is obvious that the peaks associated with the Fe(II)↔Fe(III) transition (i.e. A3, A4, C1 and C2) occur at potentials significantly cathodic to the oxygen electrode reversible potential of 0.303 V (vs. Hg/HgO, 1 M OH-). Indeed we have previously shown [8] that in 1.0 M NaOH solution, the peak potential for the A3 anodic feature increases steadily from ~ -0.6 to ~ -0.4 V over a range of voltammetric scan rates from 1 mV s-1 to 400 mV s-1. The foregoing observations indicate strongly that desorption of the OER intermediate species from an iron electrode in 1.0 M NaOH solution (upon the interruption of a galvanostatic polarising current density associated with the OER proceeding at a significant rate in the steady state), will involve the discharge of the active oxide surface Fe sites to the +3 oxidation state, from a higher valance state. Recall from mechanism (B), that we have postulated that this higher state is the Fe(VI) state which is stabilised at the oxide surface (at high anodic potentials in concentrated alkaline solution) by existing in the form of an anionic hydroxylated surface complex represented as [Fe(VI)Om(OH)n]p-. A suitable overall discharge reaction, consistent with
mechanism (B), can thus be written as,
[
( ) ( ) 1]
2 4[
( ) 1( ) 1]
4p p
m n m n
Fe VI O OH − H O e− Fe III O OH − OH−
+ + + → − − + (14)
where, it is considered that desorption of the [Fe(VI)Om(OH)n+1]p- intermediate (the only one likely to
achieve a significant fractional coverage of the active surface since it is consumed in the RDS), facilitates the discharge process.
From Fig. 14, it is obvious that plots of Qdec vs. η are characterised by a steady increase in Qdec
with increasing η for lower values of the latter. In such discharge experiments for Ni [1] and Co [2] OER anodes, a plateau was observed in the Qdec vs. η plots in the higher overpotential region
characterised by the onset of limiting current behaviour in the associated logi(η) characteristic for the same system. The technique of Ho and Piron [12] is based on their proposal that the plateau in such Qdec vs. η plots, corresponds to the desorption of the electrosorbed intermediate (OHads) for the
situation where the coverage of this species approaches a full monolayer. They further proposed that for a two electron desorption process, a resonable estimate of the roughness factor is given by the expression, fr = Qdec(plateau)/420µC cm-2, where Qdec(plateau) is the average charge density associated
with the plateau region of the Qdec vs. η plot and 420 µC cm-2 is a “benchmark” theoretical value, due
originally to Fedorova and Frumkin [39], for the charge passed during the two electron deposition or desorption of a monolayer of OHads. We have previously applied the above formula to estimate
Figure 14. Plots of the total charge, Qdec, passed during the discharge of “types” A and B Fe
electrodes in 1.0 M NaOH vs. oxygen evolution overpotential η. Also included is the steady state polarisation curve for the “type” B electrode.
Raw discharge current decay transients are presented in Fig. 13, recorded for a “type” B Fe electrode in 1.0 M NaOH following the interruption of prior anodic charging current densities, corresponding to the overpotentials indicated in the legend. The overall results of this experiment are graphed as a Qdec vs. η plot in Fig. 14, along with the closely related steady state polarisation curve
(logi vs. η) for the same system – the latter curve was previously presented in Fig. 4. Also included is Qdec(η) data for a “type” A Fe anode in 1.0 M NaOH solution. The Qdec(η) data points represent the
mean value of Qdec calculated from four transients, recorded in separate experiments, for each value of
iappl, while the vertical error bars span ± one standard deviation from this mean. The Qdec vs. η plots of
Fig. 14 are not characterized by very obviousplateau regions at higher η, as was the case for Ni [1] and Co [2] anodes at comparable overpotentials. Nonetheless it is apparent for the “type” B data of Fig. 14, that the rate of change of Qdec, with increasing η, becomes small in the higher overpotential range
where a limiting current density is approached in the steady state polarisation curve – the same was observed to be true for the data recorded for the “type” A electrode, although in the interests of clarity of presentation the logi vs. η plot has been omitted in this case. It would therefore seem to be resonable for both “type” A and B electrodes, to use the value of Qdec measured at the highest investigated
overpotential for the estimation of fr. Since, according to eqn. 14, we envisage the discharge of Fe
OER anodes to occur by the passage of 4 moles of electrons per mole of active sites, instead of 2 moles of electrons per mole of electrocatalytic centres as was the case for Ni [1] and Co [2] electrodes, it is necessary to double the “benchmark” value of 420 µC cm-2 with the result that the expression for the estimation of the roughness factor becomes,
2
( )
840
dec r
Q plateau f
C cm
µ −
[image:29.612.152.464.79.288.2]in the case of iron.
Figure 15. The total charge, Qdec, passed during the discharge of an “aged” Fe electrode in 1.0 M
NaOH vs. oxygen evolution overpotential η. Also included is the steady state polarisation curve for this system.
Roughness factor estimation experiments were also conducted for an extremely aged iron electrode – the “type” which (as described above but dealt with in detail elsewhere [4]), is characterised in OER steady state polarisation experiments by a Tafel slope of ~60 mV dec-1 at lower
overpotentials and a second straight-line region with b = ~120 mV dec-1 at higher potentials. A plot of
Qdec vs. η, based on transient decay experiments conducted for such an electrode in 1.0 M NaOH is
presented in Fig. 15, along with the steady state polarisation curve for the same system. Taking for Qdec(plateau), as discussed above, the values of Qdec associated with the highest investigated
overpotential, roughness factors were calculated for the “type” A and B electrodes and also for the aged Fe anode. The results are tabulated in Table 3. As we pointed out in the previous articles [1, 2] of this series, the quoted error refers simply to the experimental error – the true error is likely to be significantly greater, owing to the questionable nature of some of the assumptions on which the OHads
desorption method is based [12].
Table 3. Summary of the roughness factors, fr, determined for “aged” and “type” A and B iron
electrodes in 1.0 M NaOH solution, using the OHads desorption method.
Fe Electrode “type” Qdec(plateau)
µC cm-2
fr
![trans Tetraaquabis[bis(pyridin 3 yl)methanone κN]manganese(II) bis(perchlorate)](data:image/gif;base64,R0lGODlhAQABAIAAAP///wAAACH5BAEAAAAALAAAAAABAAEAAAICRAEAOw==)