Abstract: E. coli is the first organisms to be sequenced as genome and the classification within the DEC pathotypes has epidemiologic and clinical implications for managing diarrheal diseases. In many developing countries E.coli leads to cause of diarrhea in children. where the mode of transmissions takes place via food and water. based on their pathogenic phenotype and diseases they cause it can be classified into 6 groups. consequently, our awareness of the spectrum of diseases and syndromes that they cause is quite limited. Also, because we cannot readily identify infected patients, there are many complexities in defining the modes of attainment, prevention and treatment strategies, and estimating the burden of infectious squealed. These infections create many challenges, and no progress will take place until the diagnostic potential for these agents got improved. Identifying E. coli isolate co-express LA reiterates the difficulty of assigning bacteria to groups on the basis of their adherence phenotype or genotype. Therefore the analysis of E -coli with molecular methods demonstrates that strains carry will represent more characteristics of typical EPEC and also the lack of AggR regulon, we propose a novel classification approach for classifying E-coli therefore to recognize pathogens. In addition, the ability to simultaneously induce attaching effacing lesions and biofilm production may enhance the potential of the strains to cause diarrhea and prolong bacterial residence in the intestines, thus worsening malnutrition in the patients.
Keywords: Ecoli , classification , BayesNet, Navie Bayes, RBFNetwork, SMO.
I. INTRODUCTION
The data is provided by Institute of Molecular and Cell Biology, Osaka University, Japan, used to predict the protein localization sites of E Coli bacteria. The dataset consists of 336 instances of E Coli and 8 Instances. A novel model is developed from the data set by using data mining tool “Weka”, to predict the protein localization sites of E coli bacteria. The problem is suitable for data mining solution, as historical data is readily available such that 336 instances, the problem is not well understood. therefore the problem can be characterized as an input-output relationship and the inputs are casually related to the output.
Revised Manuscript Received on November 05, 2019.
A.Rama,Assistant Professor (Sg), Department Of Computer Science And Engineering, Saveetha School Of Engineering, Simats, Chennai, India
Email: [email protected]
A.Gayathri,Associate Professor, Department Of Computer Science And Engineering, Saveetha School Of Engineering, Simats, Chennai, India
Email: [email protected]
S.Christy, Assistant Professor (Sg), Department Of Information Technology,Saveetha School Of Engineering, Simats, Chennai, India
Email: [email protected]
II. E-COLIDATASET A. Input attribute
The input attribute is defined as sequence name that deals with the Access number used for SWISS-PROT database, mcg stands for signal sequence recognition used by McGeoch's method , gvh which deals with signal sequence recognition for von Heijne's method, lip that takes Binary attribute dealing with von Heijne's Signal Peptidase II also called consensus sequence score.chg determine the presence of charge on N-terminus of predicted lipoproteins and it is a Binary attribute. aac resolve score of discriminant analysis of the amino acid content of outer membrane and periplasmic proteins. alm1 and alm2 has score of the ALOM membrane spanning region prediction program and score of ALOM program after excluding putative cleavable signal regions from the sequence respectively.
Table – I : E-Coli Data Set
B. Output Attribute
The data set represents a prediction task because the output is nominal. The output attribute is defined as
cp (cytoplasm)
im (inner membrane without signal sequence) pp (perisplasm)
imU (inner membrane, uncleavable signal sequence) om (outer membrane)
omL (outer membrane lipoprotein) imL (inner membrane lipoprotein)
imS (inner membrane, cleavable signal sequence) in the arff file, so that Weka treats the variable name as labels.
III. EVALUATIONMETHOD
This Here 10-fold cross-validation are chosen as the model evaluation method; this is because, it is one of the best methods to produce a more accurate model. This method carries out multiple train/test trials and they are normally more reliable than a single train/test trial. After the model is being built, the accuracy of the model is re-evaluate using the E Coli data set which is an “out-of-sample” data supplied to produce the performance results. The performance measure using is primarily the “Correctly Classified Instances” percentage, which shows the percentage of instances being classified correctly by the model.
Fine Tuning Data Mining Algorithm for an
Efficient Classification of E-Coli
A.Rama, A.Gayathri, S.Christy
Data Set
Input Output
E-Coli dataset
Sequence Name, Mcg, Gvh, Lip, Chg, Aac, alm1, alm2.
110
Published By:
Blue Eyes Intelligence Engineering & Sciences Publication
Retrieval Number: A3936119119/2019©BEIESP
(Good performing model generally has high percentage of “Correctly Classified Instances”.) When models have the same percentage of “Correctly Classified Instances”, we also use the “Mean Absolute Error” as the other performance measure. (Good performing model generally has low rate of “Mean Absolute Error”.)
IV. SEARCHFORBESTMODEL
We have checked whether each attribute in E Coli data set have missing values. The missing values is not found in this E coli data set. We have applied a filter to replace each missing value with the most frequent value: weka.filters.unsupervised.attribute.ReplaceMissingValues. In order to have a better accuracy of data to build the models, after all the missing data have been replaced, E Coli data set are now set without any missing value.
V. SELECTINGANALGORITHM
[image:2.595.300.555.304.414.2]Using the pre-processed data, we have tried different algorithms from each classifier with their default parameter settings and used the percentage of “Correctly Classified Instances” and “Mean Absolute Error” as a basis to assess the models. The reason why we use another performance measure, “Mean Absolute Error” is because the result of “Correctly Classified Instances” could be the same for many algorithms.
Table II- Algorithm and Results from weka
Algorithm
Result from weka Correctly Classified Instances
Mean Absolute Error weka.classifiers.bayes
BayesNet 82.3881% 0.0543
NaiveBayes 85.3731% 0.0445
NaiveBayesUpdateable 85.3730% 0.0445
weka.classifiers.functions
Logistic 85.6716% 0.048
RBFNetwork 82.9851% 0.0495
SMO 85.9701% 0.1896
weka.classifiers.lazy
IB1 80.2985% 0.0493
KStar 80.8955% 0.0554
LWL 64.4776% 0.1212
weka.classifiers.meta
Decorate 86.2687% 0.1546
FilteredClassifier 78.806% 0.0634
LogitBoost 83.5821% 0.05
weka.classifiers.misc
HyperPipes 70.7463% 0.2036
VFI 69.5522% 0.1862
weka.classifiers.trees
J48graft 84.7761% 0.0483
BFTree 42.3881% 0.1822
RandomTree 62.0896% 0.1293
weka.classifiers.rules
DecisionTable 76.7164% 0.1062
DTNB 81.4925% 0.0597
PART 83.8806% 0.0482
With the highest percentage of instances being classified correctly and lowest mean absolute error (if the percentage of
instances being classified correctly is the same) from 7 different classifiers, we have chosen the best 4 algorithm from it to build different models and evaluated the best model. They are:
1. “Decorate” with percentage “Correctly Classified Instances” of 86.2687% from meta classifier.
2. “SMO” with percentage “Correctly Classified Instances” of 85.9701% from trees classifier.
3. “Logistic” with percentage “Correctly Classified Instances” of 85.6716% from trees classifier.
4. “NaiveBayes” with percentage “Correctly Classified Instances” of 85.3731% from rules classifier.
VI. SELECTINGALGORITHMTRAINING
PARAMETERS
We will now choose “Decorate”, 1 of the best algorithm that we have worked on earlier to explore their different training parameters. We will then re-train/re-test the model again using the E Coli data set to compare the percentage of “Correctly Classified Instances” and “Mean Absolute Error“ for each parameter setting.
Table III- Algorithm and Evaluation Method Algorithm and
Evaluation Method
weka.classifiers.meta.Decorate
Training Parameter Result from Weka
Classifiers Correctly
Classified Instances
Mean Absolute Error
FT 80.597% 0.0974
J48graft 85.0746% 0.1526
LADTree 85.0746% 0.0698
RandomForest 67.7612% 0.1844
SimpleCart 62.9851% 0.1891
This algorithm has many training parameters, for simplicity and efficiency we only change some of the classifiers in the training parameter as changing of the classifiers in the training parameter as changing of values in other parameters do not have significance improvement. Other parameters are in their default values (artificialSize = 1.0, debug = False, desiredSize = 15, numIterations = 50, seed = 1). The parameters in the classifiers of the training parameter will be in their default too. From the results above, you can see that with training parameter: classifiers = “J48graft” the result is the best with Correctly Classified Instances of 85.0746% and it is better than the default settings.
VII. DATAPREPROCESSING (A) Reducing input size
Before we do attribute selection, we should choose an attribute evaluator and a search method. We have selected the followings in Weka:
Table IV – Attribute Evaluator
Attribute Evaluator ClassifierSubsetEval (Classifier: meta.Decorate
with training parameter: classifiers = J48graft and the others in their default)
Search Method BestFirst (Direction: Forward)
Evaluation Mode 10-fold cross-validation (Folds = 10, Seed =1)
Attribute and Number of Folds (%)
[image:2.595.58.516.374.768.2]Results for different cut-off number of folds are summarized as follows:
Table V – Algorithm and Training parameter
Algorithm weka.classifiers.meta.Decorate
Training
parameter classifier = J48graft (Other parameters in default)
Rule Attribute Selection Result from Weka
Cut-off Number
of Folds Removed Attribute
CorrectlyClassified
Instances,Mean Absolute
Error
2 AAT_E COLI, 4. 0.48, 5. 0.5, 6.
0.56, 7. 0.24, 8. 0.35 74.3284%, 0.1647
3 1. AAT_E COLI, 5. 0.5, 6. 0.56,
7. 0.24, 8. 0.35 75.8209%, 0.1589
4 1. AAT_E COLI, 6. 0.56, 7. 0.24, 8. 0.35 75.5224%, 0.1683
do not have significance improvement. Other parameters are in their default values (artificialSize = 1.0, debug = False, desiredSize = 15, numIterations = 50, seed = 1). The parameters in the classifiers of the training parameter will be in their default too. From the results above, you can see that This algorithm has many training parameters, for simplicity and efficiency we only change some of the classifiers in the training parameter as changing of the classifiers in the training parameter as changing of values in other parameters with training parameter: classifiers = “J48graft” the result is the best with Correctly Classified Instances of 85.0746% and it is better than the default settings.
VI DATA PREPROCESSING [A] Reducing input size
[image:3.595.305.556.267.408.2] [image:3.595.43.560.433.820.2]Before we do attribute selection, we should choose an attribute evaluator and a search method. We have selected the followings in Weka:
Table VI – reducing input size
Attribute Evaluator ClassifierSubsetEval (Classifier: meta.Decorate with
training parameter: classifiers = J48graft and the others in their default)
Search method BestFirst (Direction: Forward)
Evaluation mode 10-fold cross-validation (Folds = 10, Seed =1)
ClassifierSubsetEval (Classifier: meta.Decorate with training parameter: classifiers = J48graft and the others in their default)
BestFirst (Direction: Forward
10-fold cross-validation (Folds = 10, Seed =1)
Table VII – Algorithm Performance Algorithm &
Evaluation
weka.classifiers.functions.SMO
Training parameter
Result from Weka
filterType Correctly
Classified Instances
Mean Absolute
Error Normalize
training data
85.9701% 0.1896
Standardize training data
72.5373% 0.1925
filterType Correctly
Classified Instances
Mean Absolute
Error
[B] Iteration for algorithm
“weka.classifiers.functions.SMO” Selecting algorithm training parameters:
This algorithm has many parameters. For simplicity, only the parameter filterType” are altered as changing of values in other parameters do not have significance improvement. Other parameters are in their default values (buildLogisticModels = False, c = 1.0, checksTurnedOff = False, debug = False, epsilon
= 1.OE-12, numFolds = -1, randomSeed = 1,
toleranceParameter = 0.001). From the results above, you can see that with training parameter: filterType = No normalization/standardization, the result is the best with Correctly Classified Instances of 86.5672% and it is better than the default settings.
Table VIII - Based on the attribute list from Weka: Attribute
Evaluator
ClassifierSubsetEval (Classifier:
functions.SMO with training parameters:
filterType = No normalization/standardization and the others in their default)
Search Method BestFirst (Direction: Forward)
Evaluation Mode
10-fold cross-validation (Folds = 10, Seed =1)
Attribute and Number of Folds (%)
1. AAT_E COLI – 10(100%), 2. 0.49 – 10(100%), 3. 0.29 – 10(100%), 4. 0.48 – 10(100%), 5. 0.5 – 0(0%), 6. 0.56 – 2(20%), 7. 0.24 – 10(100%), 8. 0.35 – 10(100%)
Table – IX Reducing input size
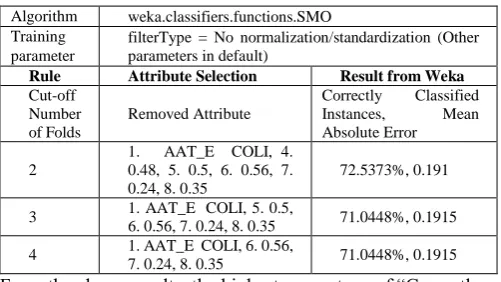
From the above results, the highest percentage of “Correctly Classified Instances” (72.5373%) and lowest result of “Mean Absolute Error” (0.191) is when there are only 2 attributes are being removed. Although from the above “Correctly Classified Instances” results for cut-off number of folds = 3, cut-off number of folds = 4 and ncut-off number of folds =5 are the same. Therefore I chose to remove 8 attributes as the left attributes are important to the model and it has a better performance.
Table – X Iteration for algorithm “weka. classifiers. functions.Logistic”
Algorithm
weka.classifiers.bayes.NaiveBayes Training
parameter Debug = False (Other parameters in default)
Rule Attribute Selection Result from Weka
Cut-off
Number of
Folds Removed Attribute
Correctly Classified
Instances, Mean
Absolute Error
2
1. AAT_E COLI, 4. 0.48, 5. 0.5, 6. 0.56, 7. 0.24, 8.
0.35 68.6567%, 0.0901
3
1. AAT_E COLI, 5. 0.5, 6. 0.56, 7. 0.24, 8. 0.35
67.7612%, 0.0934
4
1. AAT_E COLI, 6. 0.56, 7. 0.24, 8. 0.35
67.7612%, 0.0939
5
1. AAT_E COLI, 7. 0.24, 8. 0.35
63.5821%, 0.1062
Algorithm weka.classifiers.functions.SMO
Training parameter
filterType = No normalization/standardization (Other parameters in default)
Rule Attribute Selection Result from Weka
Cut-off Number of Folds
Removed Attribute
Correctly Classified
Instances, Mean
Absolute Error
2
1. AAT_E COLI, 4.
0.48, 5. 0.5, 6. 0.56, 7. 0.24, 8. 0.35
72.5373%, 0.191
3 1. AAT_E COLI, 5. 0.5,
6. 0.56, 7. 0.24, 8. 0.35 71.0448%, 0.1915
4 1. AAT_E COLI, 6. 0.56,
112
Published By:
Blue Eyes Intelligence Engineering & Sciences Publication
Retrieval Number: A3936119119/2019©BEIESP
This algorithm has many parameters. For simplicity, only the parameter “debug” is altered as changing of values in other parameters do not have significance improvement. Other parameters are in their default values (debug = False, maxIts = -1, ridge = 1.OE-8).
[image:4.595.308.543.47.263.2]From the results above, you can see that with training parameter: debug = False, the result is the best with Correctly Classified Instances of 85.6716% and it is same as and better than the default settings.
Table – XI Based on the attribute list from Weka Attribute
Evaluator
ClassifierSubsetEval (Classifier:
functions.Logistic with training parameters: debug = False and the others in their default )
Search Method BestFirst (Direction = Forward)
Evaluation Mode
10-fold cross-validation (Folds = 10, Seed =1)
Attribute and Number of Folds (%)
1. AAT_E COLI – 10(100%), 2. 0.49 – 10(100%), 3. 0.29 – 10(100%), 4. 0.48 – 10(100%), 5. 0.5 – 0(0%), 6. 0.56 – 2(20%), 7. 0.24 – 10(100%), 8. 0.35 – 10(100%)
Table – XII
It is noted that, when cut-off number of folds = 4, there are 2 attribute being removed and the “Correctly Classified Instances” has the highest percentage (76.7164%) That means the rest of the 5 input attributes are relevant to define the problem.
Table – XIII Iteration for algorithm “weka.classifiers.bayes.NaiveBayes”
This algorithm has many parameters. For simplicity, only the parameters “debug” are altered as changing of values in other parameters do not have significance mprovement. Other parameters are in their default values (debug = False, displayModelInOldFormat = False, useKernelEstimator = False, useSupervisedDiscretization = False). From the results above, you can see that with training parameter: debug = False, the result is the best with Correctly Classified Instances of 85.4731% and it is better than the default settings.
Table XIV Based on the attribute list from Weka Algorithm
& Evaluation
weka.classifiers.functions.Logistic
Training parameter
Result from Weka
debug
Correctly Classified Instances
Mean Absolute Error
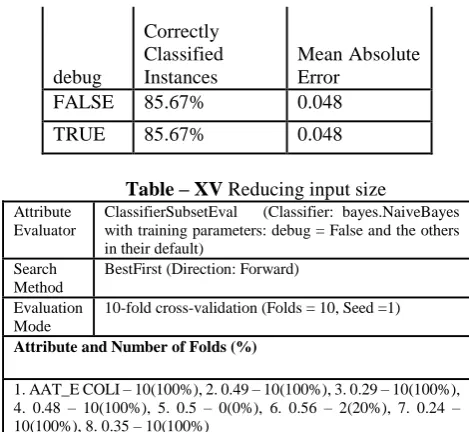
FALSE 85.67% 0.048
TRUE 85.67% 0.048
Table – XV Reducing input size Attribute
Evaluator
ClassifierSubsetEval (Classifier: bayes.NaiveBayes with training parameters: debug = False and the others in their default)
Search Method
BestFirst (Direction: Forward)
Evaluation Mode
10-fold cross-validation (Folds = 10, Seed =1)
Attribute and Number of Folds (%)
1. AAT_E COLI – 10(100%), 2. 0.49 – 10(100%), 3. 0.29 – 10(100%), 4. 0.48 – 10(100%), 5. 0.5 – 0(0%), 6. 0.56 – 2(20%), 7. 0.24 – 10(100%), 8. 0.35 – 10(100%)
From the above results, the highest percentage of “Correctly Classified Instances” (68.6567%) is when 2 attributes are being removed.
VIII RESULT ANALYSIS
[image:4.595.42.550.47.466.2]The best performing models for each of the algorithms have been determined in previous parts of this report. Their parameters and performance measure, percentages of “Correctly Classified Instances”, are summarized in the following table. It is noted that the algorithm “weka.classifiers.meta.Decorate”: with training parameters: “classifer = J48graft”, and Other parameters in default with all 8 input attributes (i.e. no removed attributes) has the highest percentage of instances being classified correctly (86.5672%) and it is considered to be the final best performing model; this is our recommended model. Researchers can use the recommended model to predict the protein localization sites of E Coli.
Table – XVI Result Analysis Algorithm weka.cl
assifier s.meta. Decora te
weka.classi fiers.functi ons.SMO
weka.cla ssifiers.f unctions. Logistic
weka.classifiers. bayes.NaiveBay es
Training paramete r
Classifer = J48graft
filterType
= No
normaliza tion/stand
ardization Debug
= False Other
parameter
s in
default settings
Other parameters in
default settings
Removed input Attribute
None None
1. Seque
nce Name, 2. Mcg, 3.Gvh, 4.Lip, 5.Chg, 6.Aac, 7.alm1, 8.alm2
None
Algorithm Attribute Selection
Training
parameter Removed Attribute
Rule 1. AAT_E COLI, 4. 0.48, 5. 0.5, 6. 0.56, 7. 0.24, 8. 0.35
Result from Weka
Cut-off Number of Folds
1. AAT_E COLI, 5. 0.5, 6. 0.56, 7. 0.24, 8. 0.35
Correctly Classified
Instances, Mean
Absolute Error
2 1. AAT_E COLI, 6. 0.56, 7.
0.24, 8. 0.35 76.7164%, 0.0775
3 1. AAT_E COLI, 6. 0.56, 7.
0.24, 8. 0.35 76.4179%, 0.0798
4 1. AAT_E COLI, 6. 0.56, 7. 0.24, 8. 0.35 76.1194%, 0.0802
Algorithm weka.classifiers.bayes.NaiveBayes
Training parameter
Result from Weka
Debug Correctly Classified
Instances Mean Absolute Error
False 85.4731% 0.0445
[image:4.595.313.558.503.839.2]hoto
Author-1 Photo
Author-2 Correctly Classifie d Instances
85.0746
% 86.5672%
85.671
6% 85.3731%
IX CONCLUSION
Here in this paper we implemented various data mining algorithm to predict the protein localization site of E Coli, therefore the input information for the model (the 8 input attributes: 1.sequence name, 2.mcg, 3.gvh, 4.lip, 5.chg, 6.aac, 7.alm1, 8.alm2.) and the model will be able to predict accurately the localization site of protein. Although the recommended model is unable to give a 100% prediction about the protein localization site, this is an effective and efficiency way to provide an initial prediction, as it combines both the Knowledge base and model’s predictions and it helps to save a lot of time and resources.
REFERENCES
1. Qiang Yang and Xindong Wu, (2006) "10 Challenging Problems In Data Mining Research", International Journal of Information
Technology & Decision makingvol. 05, No. 04, pp.
597-604 ,https://doi.org/10.1142/S0219622006002258.
2. Norouzi, Monire & Souri, Alireza & Zamini, Majid. (2016). A Data Mining Classification Approach for Behavioral Malware Detection. Journal of Computer Networks and Communications. 2016. 1-9.
3. (https://doi.org/10.5120/ijca2017915922) Jindal, Rajni & Taneja, Shweta.
(2017). A Novel Weighted Classification Approach using Linguistic Text Mining. International Journal of Computer Applications. 180. 9-15. 10.5120/ijca2017915922.
4. Coenen, F., Leng, P., Zhang, L.: Threshold Tuning for Improved Classification Association Rule Mining, pp. 216–225. Springer, Heidelberg (2005)
5. Han, J., Kamber, M.: Data Mining: Concept and Techniques, 2nd edn., pp. 285–311. Morgan Kaufmann Publishers, San Francisco (2006)
6. Ismaeel, A. G., & Mikhail, D. Y. (2016),”Effective data mining technique
for classification cancers via mutations in gene using neural network”, arXiv preprint arXiv:1608.02888.
7. Nilashi, M., Ibrahim, O., Ahmadi, H., &Shahmoradi, L. (2017), “A
knowledge-based system for breast cancer classification using fuzzy logic method”, Telematics and Informatics, 34(4), 133-144.
8. Mahapatra, R., Majhi, B., & Rout, M. (2012),”Reduced feature based efficient cancer classification using single layer neural network”, Procedia Technology, 6, 180-187.
9. Nguyen, T., Khosravi, A., Creighton, D., &Nahavandi, S. (2015), “Hidden
Markov models for cancer classification using gene expression profiles”, Information Sciences, 316, 293-307.
AUTHORSPROFILE
DrA.Rama, Senior Assistant Professor, Department of Computer Science and Engineering, Saveetha School of Engineering,, Chennai, India.
Dr.A.Gayathri, received the B.E degree in Electronics and Communication Engineering from Periyar Maniammai College of Technology for Women (Bharathidasan University, India) in 2001 and the M.Tech (CSE) degree in Computer Science and Engineering specialization from Bharath University, Chennai, India in 2005. She completed the Doctorate in the Department of Information and Communication Engineering at Anna University. She is currently working as Associate Professor in Saveetha School of Engineering (Department of CSE), SIMATS, Chennai, and Tamil Nadu. She is the member of CSI, IAENG and ACM.
Dr.S.Christy, is one of the valuable faculty members in Saveetha School of Engineering (Department of IT). She has well over 13 years of teaching experience She has also been awarded Silver Medal in M.Tech. Degree