Abstract:Diabetic Retinopathy is a consequence of prolonged unaddressed diabetes. It is currently diagnosed by the subjective clinical examination and manual grading of the fundus images by the ophthalmologists. This disease is progressive in nature. Hence early detection and treatment go a long way in helping the patients fight the dire consequences of the disease. Given the fact that number of ophthalmologists is very less as compared to the patients, a cost-effective, computer assisted, automated retina analysis system is highly desirable for the rural health care. This paper proposes an automatic Diabetic Retinopathy detection system based on the presence of bright lesions on the retina which is one of the symptoms of Diabetic Retinopathy. Initially the optic disc is removed from the fundus image as its brightness is similar to that of the bright lesions. Exudates are extracted and its various features are obtained. Later, feature based hierarchical classification is performed for detection of different stages of the disease. This method is based on the same logical steps as followed by the ophthalmologists and hence assures more accurate classification results. Two methodologies, Random Forest algorithm and Artificial Neural Network are explored and accuracy, sensitivity and specificity are evaluated at each stage of classification. The former outperformed the latter. The accuracy obtained using Random Forest are 100%, 85.71% and 87.5% and Artificial Neural network are 100%,78.5% and 66.67%for Stage 1, Stage 2 and Stage 3 respectively.
Index Terms: Artificial Neural Network, Exudates, Non Proliferative, Random Forest, Retinopathy.
I. INTRODUCTION
Diabetes is increasing at an alarming rate particularly in the working age group of 20 to 60 years [1], the reasons being increased mental stress with less physical activity, heredity, age and food habits. Over the years, uncontrolled diabetes affects the vital body parts like eyes, heart, kidneys, nervous system etc. Approximately 40% of the diabetic patients are affected by Diabetic Retinopathy (DR). About 10% of the patients face the risk of completely losing their vision [2]. It is estimated that by 2030, the number of people with diabetes will be around 366 million [3].
Prolonged diabetes leads to several abnormalities in the eye like Glaucoma, DR, Macula Edema etc. All these abnormalities are progressive in nature and can lead to loss of vision if untreated. Hence early detection and treatment are very essential in preventing this extreme consequence. Retinal abnormalities due to diabetes are diagnosed using Funduscopy which provides accurate and effective
Revised Manuscript Received on August 05, 2019.
Nandana Prabhu, Department of Electronics Engineering, Fr.
Conceicao Rodrigues College of Engineering, Mumbai, India.
Deepak Bhoir, Department of Electronics Engineering, Fr. Conceicao
Rodrigues College of Engineering, Mumbai, India.
Nita Shanbhag, Department of Ophthalmology, D Y Patil University &
School of Medicine, Navi Mumbai, India.
information of retinal health [4]. The ophthalmologists use their expertise to visually inspect the fundus images for detection of the disease. They look for symptoms of DR which include an increase in diameter of blood vessels, dark lesions due to microaneurysms and hemorrhages, bright lesions such as exudates and cotton wools. Fig. 1a shows the fundus image of a normal eye and Fig. 1b shows that with symptoms of DR. The manual inspection of fundus images is time-consuming, laborious and demands expertise. Hence an automatic tool for diagnosis is of great help. As the number of patients per ophthalmologist is very high [1], an automatic tool if developed will be of great help in assisting them to quickly diagnose more number of diabetic patients for DR. It can also aid as a tool for preliminary examination, thereby enhancing the performance of health care systems.
The anatomical structure of the retina of the normal eye as shown in Fig. 1(a) consists of Optic Disc (OD), blood vessels
(a) (b)
Fig 1Fundus image (a) Normal Fundus image (b) Fundus image with
DR [5]
(BVs) and fovea. OD is a very important part of the fundus image. It is a circular, bright yellowish spot. It is of approximately 1.5 mm to 2 mm diameter, occupying about one-seventh of the entire fundus image.
Blood vessels originate from the optic disc. The mean diameter of blood vessels is 100 µm which is about (1/40) th of the diameter of the retina.DR is classified into two types: Non-Proliferative Diabetic Retinopathy (NPDR) and Proliferative Diabetic Retinopathy (PDR). NPDR is the initial stage of diabetic retinopathy. It is also known as background retinopathy. In this case, the damaged blood vessels in the retina start leaking extra fluid and small amounts of blood into the eye. The basic pathology is in the loss of pericytes of vessel walls altering the pericyte to endothelial cell ratio. Weak wall leads to stasis embolization and leakage distal to it. This leakage manifests in the form of exudates, the centre of which is a leaking microaneurysm. The exudates are of various shapes and sizes. The number of exudates increases with the grade of NPDR.
Diabetic Retinopathy Screening using Machine
Learning for Hierarchical Classification
[image:1.595.323.519.379.482.2]Enhanced lipid levels are a contributory factor. The different stages of NPDR are mild, moderate and severe.
PDR, on the other hand, occurs when several blood vessels in the retina close, stopping adequate amount of flow of blood to the retinal tissue, resulting in growth of new blood vessels. These are abnormal and do not ensure the proper flow of blood to the retina thus blocking the vision. Persons with a prolonged history of diabetes have a greater risk of DR.
This paper proposes an automatic system for detection of DR. The automatic process featured here operates on the fundus image of the retina and consists of preprocessing, OD elimination, morphological operations, and thresholding. After these initial operations, definite features of DR are extracted from the fundus image and classification is performed. A hierarchical classification is used with three steps of operation. In the first step, the fundus image is checked whether it is of the normal retina or DR affected retina. In the next step, classification of the affected fundus images is done to determine whether the DR is mild and in the third step, moderate to severe NPDR or PDR.
The exudates are very small in size. It is very difficult to detect them particularly when they are close to the blood vessels. In the process of elimination of blood vessels, there are chances of the exudates getting eliminated. In some of the normal images, bright spots may be seen which do not actually correspond to exudates. Hence identifying the normal images is also a difficult task.
Moreover, the datasets are skewed thereby making the classification challenging.
II. RELATEDWORK
A number of techniques have been reported in the literature for the detection and classification of DR. Achieving an improved efficiency in the automatic grading of severity of DR has been an area of active research. The advancement in the field of medical image analysis combined with the tools of artificial intelligence has added refinement to the classification results over the past decade. The techniques used for classification vary from rule-based algorithms to deep learning methods.
Several unsupervised and supervised classification techniques have been explored for classification.
The preprocessing of images itself consists of various techniques depending on the purpose, which could be noise reduction, image contrast enhancement, correction of non-uniform illumination etc. In addition, image color conversion, image normalization, binarization etc. are used to improve the quality of the image thereby improving the accuracy of classification. Mean and median filtering is used for removal of noise. Nonuniform illumination causes a rise in brightness in some areas such as optic disc and less brightness in regions away from the optic disc. Illumination equalization technique is used for overcoming the defects due to non-uniform illumination. The adaptive histogram equalization makes the dark region with blood vessels and microaneurysms dominant. A variation to this technique is Contrast Limited Adaptive Histogram Equalization (CLAHE). Here, histogram equalization operates on sub-images called as tiles. Bilinear Interpolation is then used to eliminate the artificially induced boundaries [6, 7]. Other preprocessing methods are color normalization by performing
histogram stretching and clipping for standardization of color range.
Many researchers have proposed methods for individually extracting OD, blood vessels, exudates and microaneurysms. A completely automated system considering all the features has not been reported to the best of our knowledge.
Majority of researchers have used morphological techniques for detection of OD [8]. Intensity based line scanning analysis [9], least square classifier for detecting the OD region and connected component labeling and intensity information for determining the center of OD are also reported [10].On the other hand, Bharkad [11] has used green component extraction and adaptive histogram equalization for preprocessing followed by two-dimensional low pass FIR filter for blood vessel elimination. Position and centre of OD are obtained by performing thresholding in the region around pixel with the brightest intensity. Compactness test is done for assuring circularity. Then OD is segmented using image cropping around the OD, followed by morphological dilation and median filtering. Marin et al., have used iterative opening and closing operations followed by two-step thresholding to obtain the region of interest [12]. Prewitt edge detection followed by Circular Hough transform is used to obtain OD. The blood vessel is similar in intensity to dark lesions. The removal of the blood vessel is an important task as it can be used further for classification of DR. In case of classification of DR using exudates, blood vessels need to be detected and eliminated to avoid false positives. To detect blood vessels, morphological operations and various transforms are used. Patwari et al., detected blood vessels using morphological operations and binarization [13]. Badshaa et al., have detected the blood vessels using kirsch template for edge enhancement, morphological operations, thresholding and unwanted small objects removal using object classification [14].
Kavitha et al., applied Curvelet transform for blood vessel extraction as it can handle curve discontinuities using a small number of coefficients compared to Fourier and wavelet transforms [15]. Barkana et al., performed an analysis using Classifier fusion [16]. The statistical features such as mean and median in the four directions are used as inputs to the classifier. The three classifiers used are Support Vector Machines (SVM), Artificial Neural Network (ANN) and Fuzzy logic.
Once the blood vessel and OD are eliminated, the next step is the extraction of exudates, microaneurysms, and haemorrhages. Sopharak et al. used HSI color model and pixel-based classification whereas Franklin & Rajan used Lab color model and multilayer perceptron neural network for detection of exudates [6, 7]. To extract the exudates, Jaya et al, first performed morphological operations and applied Hough transform for removal of OD [20]. Color and texture features are used as representatives of exudates. Five Law texture features measure features by calculating average grey level, wave, spot, ripple, and edges. For better perception of color, opponent color space is considered. Finally, classification is done using Fuzzy Support vector machine based expert systems. Srivastava et al., detected the microaneurysms and hemorrhages in the presence of blood vessels using filters to differentiate them based the structural characteristics [21].
A variety of classification of DR is done using different databases. Some of the classifications are the presence or absence of DR [22-24].Some classifications are only on NPDR. Some are on three class classification such as Normal, NPDR and PDR. Other variations are individually using blood vessels, exudates, microaneurysms and haemorrhages. Some have used even the entire image.
Ning et al extracted the exudates and performed classification using SVM for classification into normal, NPDR and PDR [25]. Tjandrasa et al., also extracted exudates and performed classification of DR as moderate and Severe DR [26]. Sarni et al., proposed a decision support system for microaneurysms for DR screening [27]. The performance of classifiers such as KNN, RB SVM and polynomial SVM are determined. It is observed that the Radial Basis Function SVM outperformed the others. Antel et al. also extracted microaneurysms but performed classification using ensemble learning [28]. Morales et al., have performed classification using local binary patterns to distinguish between Normal, DR and Age-related Macular degeneration (AMD) [29]. DR also causes changes in the diameter of blood vessels. Hence it is also a feature used for classification of DR. Nikita et al., performed blood vessel segmentation using a Gaussian filter, extracted texture and structural features and performed classification using SVM and ANN [30].
Recently the number of researchers using deep learning for medical image analysis is rising. Pixels, sub-images and entire images are used as inputs to the network for performing classification of DR [31].
III. MATERIALS AND METHODS
This paper proposes an automatic system for the detection of DR. RGB image is initially pre-processed to extract the green component. Blood vessels and OD are then eliminated. The resultant image predominately consists of exudates. Features of these exudates are further extracted and fed to a classification algorithm. In the hierarchical classification, the DR features are extracted and the severity of DR is determined through several levels of classification where each level does a binary classification using Random Forest (RF) and Artificial Neural Network (ANN). Grade 0 is considered as normal, Grade1 as Mild, Grade 2 as moderate to severe, and Grade 3 as PDR. The digital images used for classification are taken from MESSIDOR dataset [5]. The
camera used is color video 3CCD camera on a Topcon TRC NW6 non-mydriatic retinograph. The field of view is 45◦. The images are of three sizes: 1440 x 960, 2240 x 1488 and 2304 x 1536 pixels with 8 bits per color plane having TIFF format. These are graded by an ophthalmologist based on presence of only exudates. The images are divided into different classes: normal, mild, moderate, severe and PDR. To identify each class, they have been given a Grade. Accordingly Grade0 corresponds to Normal, Grade 1 to Mild, Grade 2 to Mod to Severe and Grade 3 for PDR images.
A. reprocessing
In computational processing, preprocessing deals with the enhancement of the images. It is the foremost step in any image processing system. The fundus images are large in size. Moreover, different datasets have different number of images. To speed up computation and bring about uniformity, resizing is performed. In RGB images the microaneurysms and hemorrhages appear as dark red spots and exudates appear as bright spots. The blood vessels have a lower reflectance compared to the retinal background. In RGB images, the green component exhibits the best contrast between the foreground and background. Moreover, it is less sensitive to non-uniform illumination. Hence green channel is used for further processing [13]. Subtle, non- uniform illumination may not be noticeable by naked eyes. However, its effect is seen during feature extraction and classification. The adaptive histogram equalization is used to overcome this.
B. OD Detection
The OD localization is performed by using template matching with normalized cross-correlation [32]. Circle mask of 5 pixels is used to eliminate the noise along the borders of the image.
C. Removal of Blood vessels
This is a challenging task particularly when the exudates are very close to the blood vessels. Adaptive histogram equalization using CLAHE is initially performed. Then morphological operations of dilation followed by erosion are done. The histogram equalized image is subtracted from the resultant image. A binary image is obtained by using a threshold value. The corresponding region in the main image is filled with intensity values from neighboring pixels to reduce the variation of intensities around the blood vessel. D. Extraction of Exudates
E. Feature Extraction
A total of eight selected significant features are extracted. These features are extracted in accordance with the approach of Early Treatment of Diabetic Retinopathy Study (ETDRS). It is based on 4:2:1 rule, where 4, 2 and 1 correspond to the quadrants in which the symptoms exist. The image is divided into four quadrants through the detected center of OD. The count of exudates in each quadrant along with the total number of quadrants where the exudates exist are calculated and used as features. In addition, the total area occupied by the exudates, total perimeter, edge strength, and compactness are also determined.
F. Classification
Once the features are extracted, two classifiers, namely RF and ANN are used for classification. Random forest is an ensemble learning method which combines results from various learners. During the training phase, it grows multiple trees randomly. The results of each tree are combined using the voting method. The Forest uses the highest voted class for prediction. Binary classification is used to perform hierarchical classification.
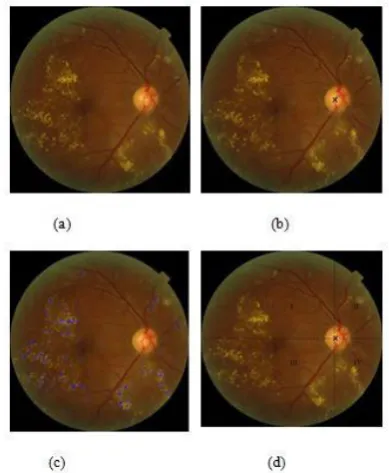
The artificial neural network is the second method used for classification. It consists of input layer, hidden layers and output layers with neurons interconnected through weights and transfer function. The classification is done based on values at the output layer. The outputs obtained for various stages are shown in Fig 2.
IV. RESULTS
[image:4.595.314.541.397.515.2]In this research work, the system used is 8 core CPU, with 60 GB SSD and Tesla K80 GPU. Matlab 2016b is used for
Fig. 2.Outputs obtained for various stages (a) Input image (b) Image with OD center marked (c) Image with exudates extracted (d) Image
with Quadrant marked.
image processing operations on fundus images and extraction of features.
In the hierarchical classification, the first classification is done to separate Normal and affected images which is indicated as (0_123) in Table1. Then second level of classification is performed as mild versus remaining grades of images which is indicated as (1_23). Finally, a third
classification is done between Mod/severe versus PDR which is (2_3). The performance of the system is evaluated using the performance metrics, accuracy, sensitivity and specificity. The RF classification is done using R tool. The classification is done after visualizing the importance of different variables at each stage. The ANN is built using the framework Karas package with the Tensor flow at the backend. This helps in speeding up the network. The variables used are visualized to know their importance, which affect the performance. The network is trained with different values of learning rate, the number of first stage neurons, number of hidden layers, batch size, epochs, drop out, optimizers and type of classifiers to arrive at the optimized configurations. Once training is completed based on training accuracy, validation loss and validation accuracy, testing is performed to get the best output. Proper selection of the above mentioned parameters is a vital task. It decides the performance of the system. It is observed that reducing the batch size, increasing the hidden layers and using a large number of epochs makes the network extremely slow. The results obtained using RF method for classification, are shown in Table 1. Table 2 shows hierarchical classification using ANN. As explained earlier, the RF method is simpler than the ANN method. The accuracy obtained using Random Forest are 100%, 85.71% and 87.5% and ANN are 100%, 78.5% and 66.67% for Stage 1, 2 and 3 respectively
TABLE I HIERARCHIALCLASSIFICATIONUSINGRANDOMFOREST METHOD
Stages Level of classif ication
Number of images
Acc1. Sen2 Spec3
1 0_123 167 100 100 100
2 1_23 69 85.71 88.89 83.33
3 2-3 26 87.5 100 85.71
1
Accuracy, 2 Sensitivity, 3 Specificity
TABLE II HIERARCHIALCLASSIFICATIONUSINGARTIFICIAL
NEURALNETWORK
Stages Level of classif ication
Number of images
Acc1. Sen2 Spec3
1 0_123 167 100 100 100
2 1_23 69 85.71 88.89 83.33
3 2-3 26 87.5 100 85.71
1 Accuracy, 2 Sensitivity, 3 Specificity
[image:4.595.55.250.423.660.2] [image:4.595.315.539.543.657.2][22] extracted all the lesions and classified the images into normal and abnormal with sensitivity of 80.21% and specificity 70.66%. Prasanna et al. [23], extracted the blood vessels as features and achieved sensitivity of 86%. Pratt et al., used CNN and performed the five class classification [31]. They achieved accuracy of 75%, specificity of 95% and sensitivity of 30%. Some researchers performed multiclass classification after extracting exudates.
V. CONCLUSION
Considering the drastic rise in cases of diabetes and non -availability of the expert ophthalmologists, there is a strong need for an automated tool for the detection of DR which can aid as an assistant to the ophthalmologist or act as a preliminary screening tool, thereby saving time and promoting the health care. In the proposed work, an automated system for determining the severity of DR is explored. In the preprocessing stage, the fundus image is resized and a circular mask is used to extract the retinal region which is region of interest. This reduces the computational cost. Green channel is extracted as it has better reflectance against the background. Median filtering and adaptive histogram equalization are used for noise removal and enhancement of the salient features. Template matching and normalized cross-correlation are used for OD localization. The extraction of exudates is a challenging task, particularly with the reflectance of blood vessels emerging from the OD. A separate iterative procedure is applied to handle this problem. Features of exudates are then extracted to suit the requirement of classification. The severity is graded as normal, mild, mod/severe and PDR. The random forest algorithm and ANN are used for classification. Choice of important features is a critical task in RF. Choosing the parameters of the network is a critical task in classification based on ANN. These parameters decide how the network performs. Too many hidden layers slow down the training. It is observed that the RF method performs better in classification. The proposed system has achieved an accuracy of 100%, 85.71% and 87.5% sensitivity of 100%, 88.89% and 100% and specificity of 100%, 83.33 % and 85.71% at level 0, 1 and 2 respectively.
Limitations of the proposed algorithm are some of OD region not being masked, critical choice of threshold while performing binarization during blood vessel extraction, artefacts in the image, artefacts near the blood vessel and misclassification of faint exudates. The method can further be improved with database having more samples with clear distinction between severe NPDR and PDR images. The proposed algorithms can be further fine-tuned to detect even finer exudates and eliminate blood vessels of higher intensity. To improve the performance of the system in terms of grading, we need to determine the classification for the dark lesions and use larger databases.
According to British Diabetic Association, if a system has sensitivity of 80 % and specificity 95% or above, it can be used for screening of DR [5, 6]. The results demonstrate the effectiveness of the system. The hierarchical classification helps for better demarcation in classification. It can be of great help to the community for screening of Diabetic patients for treatment.
REFERENCES
1. K. Vishwanath, D. D. Murray McGavin “Diabetic retinopathy: clinical findings and management,” Review Article, Community Eye Health, vol. 16, no. 46, 2003, pp.21-24.
2. B. Bowling, “Kanski's Clinical Ophthalmology-A systematic Approach,” 8th Edition, ELSEVIER
3. S. Wild, G. Roglic, A. Green, R. Sicree, H. King, “Global prevalence of diabetes: estimates for the year 2000 and projections for 2030,” Diabetes Care 2004; vol. 27, issue 5, May, 2004, pp. 1047-1053. [PMID: 15111519]
4. J. K. H. Goh, S. S. Sim, G. S. W. Tan, “Retinal Imaging Techniques
for Diabetic Retinopathy Screening,” J. Diabetes Sci. and Tech., vol.
10, no.2, 2016, pp. 282–294. DOI: 10.1177/1932296816629491 5. Decenciere, Etienne, X. Zhang, G. Cazuguel, L. Bruno, B. Cochener,
C. Trone, P. Gain, “Feedback on a publicly distributed image database: the MESSIDOR database”, Image Analysis and Stereology,
vol. 33, no 3, Aug 2014, pp: 231-234.Availblea
t http://dx.doi.org/10.5566/ias.1155.
6. S.W. Franklin, S. E. Rajan, “Diagnosis of Diabetic Retinopathy by employing image processing technique to detect exudates in retinal images”, IET Image Processing, vol. 8, issue. 10, 2014, pp. 601-609. doi : 10.1049/iet-ipr.2013.0565.
7. A. Sopharak, B. Uyyanonvara, S. Barman, T. H. Williamson, “Automatic detection of diabetic retinopathy exudates from non-dilated retinal images using mathematical morphology methods,” Comp. Med. Img. and Graphics, ELSEVIER 32 , 2008, pp. 720–727. doi:10.1016/j.compmedimag.2008.08.009
8. D. A. Godse, D. S. Bormane, “Automated Localization of Optic Disc in Retinal Images,” IJACSA, vol. 4, no. 2, 2013
9. R. Kamble, M. Kokare, G. Deshmukh, F. A. Hussin, F. Meriaudeau, Localization of optic disc and fovea in retinal images using intensity-based line scanning analysis,” J. Comp. in Bio. And Med., ELSEVIER 87, 2017, pp. 382-396.
htttp://dx.doi.org/10.1016/j.compbiomed.2017.04.016
10. R. Wang, L. Zheng, C. Xiong, C. Qiu, H. Li, X. Hou, B. Sheng, P. Li, Q. Wu, “Retinal optic disc localization using convergence tracking of blood vessels,” Multimedia Tools Applications, Springer Science + Business Media, New York 2016. DOI 10.1007/s11042-016-4146-z 11. S. Bharkad, “Automatic segmentation of optic disk in retinal images”,
Biomed. Sig Proc. Cont.. 2017, vol. 31, pp. 483–498. http://dx.doi.org/10.1016/j.bspc.2016.09.009
12. D. Marin, M. E. Gegundez-Aries, A. Suero, J. M. Bravo, “Obtaining optic disc center and pixel region by automatic Thresholding methods on morphologically processed fundus images”, ELSEVIER, Comp. Meth. And programs in Biomed. 118, 2015, pp. 173-185. http://dx.doi.org/10.1016/j.cmpb.2014.11.003
13. M. B. Patwari, Dr. R. R. Manza,Y. M. Rajput, M. Saswade, N. K. Deshpande, “Automatic Detection of Retinal Venous Beading and Tortuosity by using Image Processing Techniques,” IJCA , Feb. 2014. 14. S. Badshaa, A.W. Reza, K. G. Tan, “A new Blood Vessel Extraction technique Using Edge Enhancement and Object Classification,”
Springer –J. of Dig. Img, 2013, pp 1107-1115. DOI 10.1007/s10278-013-9585-8
15. M. Kavitha, S. Palani,” A new fast Curvelet Transform with a morphological operations based method for extraction of retinal blood vessels using Graphical User Interface,” Intl. J. of Sci. and Engg. Research, vo3, iss.6, June 2012.
16. B. D. Barkana, I. Saricicek, B. Yildirim, “Performance analysis of descriptive statistical features in retinal vessel segmentation via fuzzy
logic, ANN, SVM, and classifier fusion, ”ELSEVIER
Knowledge-Based Sys. 118, 2017, pp. 165–176. http://dx.doi.org/10.1016/j.knosys.2016.11.022
17. A. Salazar-Gonzalez, D. Kaba, Y. Li, and X. Liu, “Segmentation of the Blood Vessels and Optic Disk in Retinal Images,” IEEE J. of Biomed. And Health Informatics, vol. 18, no. 6, Nov. 2014, pp 1874-1886. Digital Object Identifier 10.1109/JBHI.2014.2302749
18. L. C. Rodrigues, M. Marengoni, “Segmentation of optic disc and blood vessels in retinal images using wavelets, mathematical morphology ,and Hessian-based multi-scale filtering, ” Biomed. Sig. Proc. and Control ELSEVIER 36, 2017, pp. 39–49.
19. J. H. Tan, U. R. Acharya, S. V. Bhandary, K. C. Chua, S. Sivaprasad, “Segmentation of optic disc, fovea and retinal vasculature using a single convolutional neural network,” J. of Comp. Sci. 20 , 2017, pp.70–79. http://dx.doi.org/10.1016/j.jocs.2017.02.006.
20. T. Jaya, J. Dheeba2, N. Albert Singh, “ Detection of Hard Exudates in Colour Fundus Images Using Fuzzy Support Vector Machine-Based Expert System,” Springer, J Digit Imaging, 28:761–768, 2015. DOI 10.1007/s10278-015-9793-5
21. R. Srivastava, J. Liu, T-Y Wong,“ Detecting Retinal Microaneurysms and Hemorrhages with Robustness to the Presence of Blood Vessels,” ,Article in Computer Methods and Programs in Biomed., Oct. 2016, DOI: 10.1016/j.cmpb.2016.10.017
22. C. Sinthanayothin, V. Kongbunkiat, S. Phoojaruenchanachai, A. Singalavanija, “Automated Screening System for Diabetic Retinopathy,” Proc. of the 3rd Intl Symposium on Image and Sig. Proc. and Analysis, 2003, pp915-920.
23. P.Prasanna, S. Jain, N. Bhagatt, A. Madabhushi, “Decision Support System for Detection of Diabetic Retinopathy Using Smartphones,” 7th Intl. Conf. on Pervasive Comp. Tech. for Healthcare and Workshops, 2013. DOI 10.4108/icst.pervasivehealth.2013.252093 24. Md. A.B Jahiruzzaman, M.A.Hossain, “Detection and Classification
of Diabetic Retinopathy Using K Means Clustering and Fuzzy logic” IEEE 2015, pp 534-538. DOI: 10.1109/ICCITechn.2015.7488129 25. D. Ning, L. Yafen, “Automated Identification of Diabetic Retinopathy
Stages Using Support vector Machine,” Proc. of 23rd Chinese Cont. Conf., July 26-28, Xi’an, China, 2013, pp. 3882-3886.
26. H. Tjandrasa, R. E. Putra, A. Y. Wijaya, I. Ashanti, “ Classification of Non-Proliferative Diabetic Retinopathy based on Hard Exudates Using Soft Margin SVM,” IEEE Intl. Conf. on Control Sys., Computing and Engg, 29 Nov. -1 Dec. 2013, Penang, Malaysia, pp. 376-380. 27. S. R. Sarni, J. Chisina, P. Vasile, S. James , “Automatic detection of
microaneurysms in fundus images for Diabetic Retinopathy screening,” Springer Neural Networks and Appl., June 2015, pp1149-1164. DOI 10.1007/s00521-015-1929-5
28. B. Antel, A. Hajdu, “ An ensemble –based system for microaneurysms detection and diabetic retinopathy grading,” Biomedical Engineering, IEEE Transactions on Biomedical Engineering, Vol. 59, no. 6, 2012. pp. 1720–1726.
29. S. Morales, K. Engan, V. Naranjo, and A. Colomer,” Retinal Disease Screening through Local Binary Patterns,” IEEE Journal Of Biomedical And Health Informatics, Vol. 21, No. 1, Jan. 2017, pp. 184-192. DOI: 10.1109/JBHI.2015.2490798
30. G. Nikita, C. Mehmet, H. R. Bryan, “Machine learning Identification of Diabetic Retinopathy”, IEEE Conf. Sig. Proc. in Med. and Biol. Symposium, USA, 2014.
31. H. Pratt, F. Coenen, D. M. Broadbentc, S. P Hardinga, Y. Zheng, “Convolutional Neural Networks for Diabetic Retinopathy,” Intl. Conf. On MIUA 2016, July 2016, Loughborough, UK, ELSEVIER, Science direct, Proc. Computer Science 90, 2016, pp. 200 – 205.doi: 10.1016/j.procs.2016.07.014
32. N. A. Prabhu, D.V. Bhoir, U. Rao, “Template matching technique for Optic Disc localization in Fundus Image”, IEEE fifth Intl Conf. on Computing for Sustainable Global Development, BVICAM, India, 1143-1147, Mar., 2018.
AUTHORSPROFILE
Nandana Prabhu received her Bachelor of
Engineering (Electronics and Communications) from Karnatak University, Karnataka, India. Master of Engineering in Electronics from Veermata Jijabai Technological Institute, Mumbai University, Mumbai, India and currently research scholar at Fr. Concaecio Rodrigues College of Engineering, Bandra, under Mumbai University, Maharashtra, Mumbai, India. Currently working as Associate Professor in Department of Information Technology at K J Somaiya College of Engineering, Vidyavihar, Mumbai, India she has a total of 25 years teaching experience. Her area of interest includes image processing, Geographical Information systems and Computer Networks. She has published 16 papers in International conferences and Journals.
Ms. Prabhu is a life member of professional societies like IETE and ISTE.
Deepak Bhoir received Ph.D. in Electronics
Engineering from V.J.T.I. in 2012 after completing his Bachelors and Master degree in Electronics Engineering from Bombay University in 1990 and 1998.
His field of specialization is Biomedical Instrumentation and VLSI. Currently he is Professor in Department of Electronics at Fr. Conceicao Rodrigues College of Engineering. He has vast teaching experience of 26 years and about 28 publications in the international journals and conferences.
Dr. Bhoir is a life member of professional societies like IEEE.
Nita Shanbhag did her MS in Ophthalmology from
![Fig 1 Fundus image (a) Normal Fundus image (b) Fundus image with DR [5]](https://thumb-us.123doks.com/thumbv2/123dok_us/8184634.255964/1.595.323.519.379.482/fig-fundus-image-normal-fundus-image-fundus-image.webp)