International Journal of Innovative Technology and Exploring Engineering (IJITEE) ISSN: 2278-3075,Volume-8, Issue-9S4, July 2019
Abstract: Sentiment analysis is an area of natural language processing (NLP) and machine learning where the text is to be categorized into predefined classes i.e. positive and negative. As the field of internet and social media, both are increasing day by day, the product of these two nowadays is having many more feedbacks from the customer than before. Text generated through social media, blogs, post, review on any product, etc. has become the bested suited cases for consumer sentiment, providing a best-suited idea for that particular product. Features are an important source for the classification task as more the features are optimized, the more accurate are results. Therefore, this research paper proposes a hybrid feature selection which is a combination of Particle swarm optimization (PSO) and cuckoo search. Due to the subjective nature of social media reviews, hybrid feature selection technique outperforms the traditional technique. The performance factors like f-measure, recall, precision, and accuracy tested on twitter dataset using Support Vector Machine (SVM) classifier and compared with convolution neural network. Experimental results of this paper on the basis of different parameters show that the proposed work outperforms the existing work.
Index Terms: Sentiment analysis, Data mining, Feature Optimization, Machine learning.
I. INTRODUCTION
The process of discovering different patterns from huge data is done with the help of data mining [1]. This process of data mining is the field of mathematics and computer science both whose prime goal is to mine the information from the larger data so that can produce patterns. Apart from discovering the knowledge it further involves various database and database management aspects, pre-processing of given data, improving the complexities, visualization and many more. The main difference between data mining and data analysis is that data mining help in extracting of hidden information from the huge dataset as pattern whereas data analysis is used for testing the models. The Six common classes involved in data mining are Clustering, Regression, Summarization, Anomaly detection, Association rule learning, Classification, and visualization. Sentiment analysis also comes under data mining where one has to clean the data and extract knowledge from the data. In Natural Language, there are two types of information that text holds: one is objective information and other is subjective information. Facts are the objective information that is predefined and easy to analyse whereas sentiment is subjective information that varies from person to person. The word ‘Sentiment’ can be recognized as thought, emotions,
Revised Manuscript Received on September 10, 2019.
Dipti Sharma, Department of Computer Science & Engineering, Chandigarh University, Mohali, India.
Munish Sabharwal, Department of Computer Science & Engineering, Chandigarh University, Mohali, India.
and attitude. The opinion is a word that is defined as a judgment or view about a particular thing in an opinion holder mind. Both opinion mining and sentiment analysis are interchangeable terms.
Sentiment Analysis is a field of Natural Language processing [2] which addresses the problem of extracting sentiment or opinion from a text. The sentiment classification is focused on deciding whether the social media review is positive or negative. For politics, finance, business, and marketing like fields deeper insights on sentiment analysis can prove to be very valuable. Previous researches have shown how sentiment and public opinion can affect stock markets, product sales, polls as well as public health. To determine the conveyed feelings sentiment analysis is act as automation of the given text analysis. Aspect levels, document, and sentence are three main levels of classification. Previous work in the field of sentiment analysis used machine learning algorithm for classification. In previous years the use of feature selection methods is also growing in order to enhance the accuracy classifier.
In this article, we used the Support vector machine algorithm to train the classifier model along with feature selection using hybrid optimization in order to enhance the accuracy and speed of the model. Firstly we perform data pre-processing in order to remove the noisy data, use Part of speech (POS) tagging in order to extract prior polarity features and n-grams. Afterward, the word polarity score is calculated using Pointwise Mutual Information (PMI). Then heuristic hybrid optimization method using PSO and cuckoo search is used for feature optimization which helps in enhancing the performance of the model. These optimized features are then fed into the SVM to train the model and predict the labels for sentiment classification. A model proposed here is used for binary classification of social media data into positive and negative sentiment classes. The experimental output validates that purposed approach provides better performance for the classification task.
II. LITERATURE REVIEW
In this section literature review has done for sentiment analysis. As large efforts are put by the researchers in the field of sentiment analysis during the last two decades, it results in several methods and models being proposed. These models based on two approaches: supervised learning [3] [4] [5] [6] [7] [8] and lexicon-based approach [9] [10] [11]. Lexicon is a collection of the predefined word where a polarity score is associated with each word [12].
Sentiment Analysis for Social Media using SVM
Classifier of Machine Learning
It is the easiest approach for sentiment classification. This approach makes use of lexicon and performs word matching which is used to categorize a sentence. The performance of this classification approach depends upon the size of lexicon. Large the size of the lexicon, better the accuracy. There are many lexicons available such as SentiWordNet, General Inquirer, MPQA lexicon and VADER lexicon, etc. Supervised methods used the machine learning algorithms for training and prediction such as SVM, Naïve Bayes, Neural Network and Random Forest, etc. along with various features like word n-grams, Part-of-speech (POS) tags and specific data regarding tweets such as capital words, emoticons, hashtags, and retweet, etc. Sharma, D. et al [13] presents a review on Sentiment analysis technique for social media data where they also concluded that SVM is the most frequently used algorithm for sentiment analysis.
Sentiment analysis is a multistep process where which includes Pre-processing, feature extraction, feature selection, sentiment classification using machine learning algorithms and performance evaluation. Feature selection step in sentiment analysis plays a significant role in order to achieve high performance of the sentiment classifier model. Various methods like Information gain, TF-IDF, Chi-square, information gain, etc. are the traditionally used feature selection methods. These methods produce sub-optimal feature set as sentiment analysis is an NP-Hard problem. So optimization techniques can be applied over these methods in order to get an optimal feature set which improves the accuracy as well as processing time of the classification model. Classification model also plays an important role in categorizing the review.
Kumar, A et. al. [14] presented a survey on swarm intelligence for feature optimization in sentiment analysis where they observed that swarm optimization favors the accuracy gain. They also make a comparative analysis of various swarm intelligence techniques. A. Agarwal et al. [15] Performed sentiment analysis on Twitter data. They presented POS based prior polarity features and use tree kernel for feature engineering. Their work outperforms the baseline techniques. Akhtar, M.S., et al. [2] presented various procedures for aspect-based sentiment analysis have been selected using various features. Various classifiers for feature selection have been carried out in this research paper. A technique like Particle swarm optimization has also been part of the paper. The sentimental analysis can be carried out in two steps i.e. aspect extraction and classification.
Jianqiang et al. [16] presented an unsupervised learning technique for word embedding in large twitter data. The word embedding has been utilized in combination with word sentiment polarity and n-gram, properties to create tweet feature set which is used to train CNN (Convolution neural network). The performance of the presented work in terms of F measured and accuracy has been compared with the n-gram technique. They used many datasets but the highest accuracy is 87.62%. Xia et al. (2017) [17] Presents a model for supervised learning which analyses the sentiments from huge data. This model helps in storing the results for future forecasting. In this paper classification performance range up to 81% and 81.7% using Naïve Bayes and logistics regression. Udochukwu et al. (2015) [18] presents methods called as a rule-based pipeline which help in recognition of
emotions from the text with the help of the OCC model. In this research paper, five classes of emotion have been used. The accuracy in this proposed work ranges up to 82.7%.
Li and Liu et al. [19] in this paper author have made further improvement in his existing work by processing and modification in the various mechanism of sentiments for extracting the information from the huge dataset. The evaluation of results is done on three classes of balanced and unbalanced. The best results are obtained processing non-opinion contents. With the help of which the result of accuracy ranges between 89.67% and 88.00%. In the case of balanced class cosine distance measure approach is used for getting maximum results. The result of accuracy ranges between 60.17 and 64.13%. Whereas in the case of unbalanced classes voting mechanism approach is used for getting maximum results. The result of the accuracy ranges between 49 and 53.76%. Luts et al. [20] presented the work in which the structure of web classification mining system is performed using SVM classifier. The self-learning, strong pattern classification and well generalization of SVM, the classification task correctly classifies the web text. The outcome of their work shows that this algorithm of classification is more effective and feasible. Wei Zhao et al. [21] utilized the k-means algorithm and genetic algorithm for features selection in order to fulfill the task of text classification. The experimental results have shown that the combination of the k-means algorithm and GA is significantly useful in the reduction of high dimensional feature set, and also improved efficiency and accuracy for text classification.
As we observed that a number of researchers have performed the sentiment analysis using different mechanism and on different types of the database but few works have to be performed using optimization methods for sentiment analysis. So in this proposed work, the hybrid method for feature selection sentiment analysis is used. The different classifier has also been used in sentiment analysis for the improvement of accuracy. But there is a scope to apply the SVM classifier along with hybrid optimization technique.
The studies by Munish, first [22], facilitated the researcher in the overall preparation of literature review and planning for the overall research and the second [23], assisted me in the analysis.
III. RESEARCH METHODOLOGY
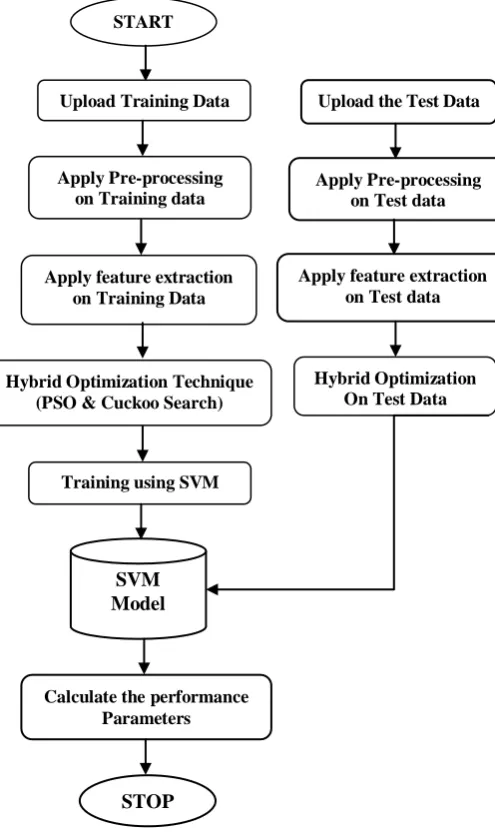
The methodology used for our proposed work is shown in the given Fig.1. This work is done for achieving the best result at the end through the following steps.
International Journal of Innovative Technology and Exploring Engineering (IJITEE) ISSN: 2278-3075,Volume-8, Issue-9S4, July 2019
[image:3.595.33.281.121.541.2]In the next step, the proposed model is trained with support vector machine and trained model is created. After that, the test data is matched with the trained structure of SVM and the classification results will be obtained in the form of
Fig. 1. Flowchart for proposed work
sentiment. At last the performance parameters like f-measure, recall, precision, and accuracy are computed.
A. Data Pre-processing
Data on social media as review composed of the poorly structured test, incomplete expression and noisy because of short forms, non-dictionary words, and irregular grammar. These impurities may affect the classification model performance. Before feature selection, various pre-processing steps are performed to minimize the noise from social media text [24]. The steps are:
- Tokenization: All the sentences firstly converted into a list of words.
- Stemming: A word itself a feature so we use stemming. This is the process of converting different forms of words into base form. Example: computing to compute.
- Stopwords removal: These are the words that commonly occur in the language like “a”, “an”, “the” and “the”. These are the words which usually do not convey any sentiment so
these insignificant tokens need to be removed. In this work, we used predefined python libraries.
B. Feature Representation
1) CountVectorizer: Feature extraction is the process of transforming the words into the feature vector. In this work, CountVectorizer [25] is used for data representation in the form of a sparse matrix. It converts the social media review to feature count matrix. CountVectorizer Matrix Calculation: suppose following different reviews(R):
“Nice Movie” “Worthful Movie” “Movie is meaningful”
For these sentences matrix of size 3*5 is generated as it contains 3 reviews and 5 features. The matrix for this is shown below in Table 1.
TABLE I. MATRIX USING COUNTVECTORIZER
Feature 1 Feature 2 Feature 3 Feature 4 Feature 5
R1 1 1 0 0 0
R2 0 1 1 0 0
R3 0 1 0 1 1
1 represents the feature presence and 0 represents the feature absence.
2) Part Of Speech (POS): Every word has a syntactic meaning in a sentence that tells how the word is used. This syntactic meaning is known as part of speech. POS tagging is required to select only those words which contain sentiments. Nouns and pronouns do not contain any sentiment whereas adjective contains sentiments. With the help of POS tagger, unnecessary words can be filtered out [26].
3) N-gram features: N is the number of consecutive words used as a feature. For N equal to 1 known as bigram, for 2 and 3 it is bigram and trigram. In this work, we used trigram.
4) Sentiment polarity score (SPO) of a word: PMI (Pointwise Mutual Information) is used for calculating the sentiment polarity score of a word. This is a method for calculating the mutual information between the class and the features. Sentiment polarity score of a sentence is equal to the sum of the polarity of each word in a sentence.The PMI between word w and class i is calculated using the level of co-occurrence among them. Mutual Information is given by equation 1 [27].
Where, is the word frequency with
negative context, is word frequency in dataset, m is the total number of words in negative context, n is the number of words in the dataset. is used to find PMI score with positive data. When score is greater than 0, it means word is positively correlated to class and negatively correlated if less than 0 [28].
START
Upload Training Data
Apply Pre-processing on Training data
Apply feature extraction on Training Data
Hybrid Optimization Technique (PSO & Cuckoo Search)
Training using SVM
SVM Model
Calculate the performance Parameters
STOP
Upload the Test Data
Apply Pre-processing on Test data
Apply feature extraction on Test data
[image:3.595.301.541.274.338.2]In order to determining polarity score of a word PMI is used as given in equation 2 [2].
(2)
1) Feature Selection: Feature selection is the process of dimensionality reduction which helps in reducing the processing burden. Using optimizations, Feature Selection enhance the accuracy of a classification and make classifications of sentiment fast and effective as optimization methods help to find optimal feature subset. Various optimization techniques are used these days. They help in finding out the best solution. In purposed work combination of two main techniques for optimization i.e., cuckoo search and particle swarm optimization (PSO) are used which provide better results than existing work.
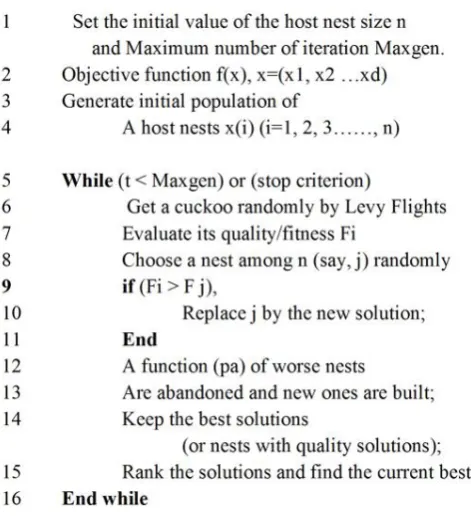
a) Cuckoo search: This is one of the most used optimization technique. Because it helps in providing better results in just minute change done in any parameter. So this search is widely accepted in many fields these days. CS was purposed by Yang and Deb [32] in 2010 in the engineering field to solve engineering design optimization problems. Cuckoo search is constructed over three ideal guidelines. Cuckoo search is constructed over three ideal guidelines. - One egg is laid by each cuckoo. The egg laid is dumped in
any random nest.
- For the next generation, the nest, this is having a high quality of eggs will be taken further for execution.
- The host nest which are accessible are fixed. The host bird help in discovering the laid egg with a probability pa(0,1).
[image:4.595.305.546.136.428.2]The pseudo code for cuckoo search [32] is in Fig. 2.
Fig. 2. Pseudo code for Cuckoo Search
b) Particle Swarm Optimization: One of the
population-based stochastic optimization technique developed by Dr. Eberhart and Dr. Kennedy [29] in 1995 was on PSO i.e. particle swarm optimization, which was
[image:4.595.53.289.443.701.2]motivated by having the social behavior of bird flocking or fish schooling [30]. PSO may have shared lots more features which are the same as other evolutionary computation techniques. Like other genetic algorithms, in PSO, no operator evolution like mutation and crossover is to be done.
Fig. 3. Pseudo code for PSO
In earlier years, PSO has been widely accepted in almost many research and application areas. It has been noted that PSO has shown many good results as compared with other existing techniques. The main reason for using PSO is that it has few parameters so it gets easy for adjusting those parameters. Slight variation in anything can work well for chasing the better result. PSO has been used in all most every research area these days. In PSO each particle flies according to its own experience and its neighbor experience. Each particle is a solution in a D dimensional space and has position p and velocity v. Particle move in a D space in order to search the best solution. The previous best position of a particle is known as pbest and best position of the whole population is known as gbest. Based on these two parameter particle changes his velocity and position which is carried out in equation (3) and (4) in order to search optimal solution.
International Journal of Innovative Technology and Exploring Engineering (IJITEE) ISSN: 2278-3075,Volume-8, Issue-9S4, July 2019
Where and are the velocity and position component at (i+1)th iteration respectively; w is inertia effect and C1 and C2 are learning factors; PB means particles personnel best position; GB means particles’ global best position; rand is the variable that is uniformly distributed in 0 to 1 range. In eq. 3 represent previous direction; is the tendency to move personal
best; i) is the tendency to move global
best. These in combine help to move particle to best position. The pseudo code for PSO [31] is in Fig. 3.
2) SVM: In the proposed work, SVM is used for classification purpose. SVM [33] are initialized the first time to solve the problems of binary classification and the main task of SVM is to draw hyperplane that maximizes the distance between two classes [34]. SVM has the capability to manage the linear, simple, classification tasks and complex tasks. Additionally, it is capable also for managing separable and non-separable issues in linear and nonlinear cases. The main purpose is to map the original data points from an input space to the high dimensional input vector such as X. The mapping is performed by the use of kernel functions which is based on the statistical learning method and minimized the issues of quadratic programming. It has heuristic algorithms along with the different kernel functions [35].
IV. EXPERIMENT
The discussed results for our proposed work are given below.
A. Dataset
For this experiment, we used the twitter dataset. This is a secondary data set contains positive and negative aspects.
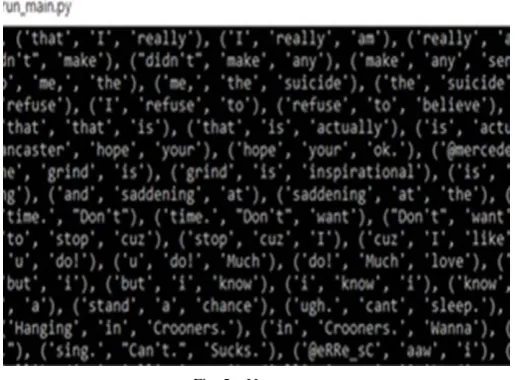
B. POS Tagging
[image:5.595.307.544.63.242.2]Fig. 4, shows the part of speech tagging that is one the process related to feature extraction. Before any process, the main first step is preprocessing of the text which deals in tokenization of the data for reducing the duplicity of the data and extracts the useful information to achieve the part of speech tagging. POS is the method of the pattern up a word in the given text as consistent to a specific part of speech based on the relationship with head-to-head and linked words in an expression, sentence, or section. Part of speech tagging deals in the context of computational morphology, using procedures which associate separate terms and concealed parts of communication, in unity with a set of evocative tags.
Fig. 4. Part of speech tagging
C. N-gram
[image:5.595.305.563.483.673.2]Fig. 5 shows the N-gram mining which is a contiguous arrangement of n items after a given example of text or communication. The items can be in the form of phonemes, words or base couples according to the request. The n-grams characteristically are calm from a text or communication corpus. When the substances are words, n-grams can also be well known by shingles. An n-gram prototype is a probabilistic model for forecasting the next item in a sequence in the method of (n − 1) order. N-gram representations are now extensively used in probability, communication and computational morphology, computational biology, biological analysis, and data density. Two benefits of n-gram models are simplicity and scalability in which a model can deal with more valuable data which can be stored in the large memory space.
Fig. 5. N-gram
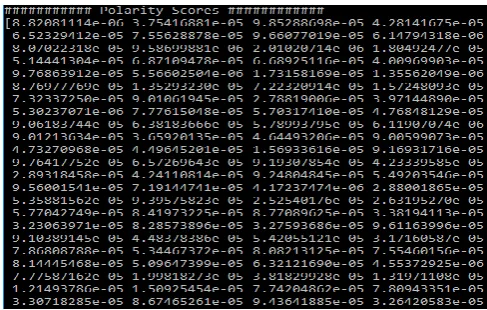
D. Sentiment Polarity Score
The sentiment total is a more exact numerical image of the sentiment polarity. These are the probabilities of the similarity indexes matched based on the extracted N-grams from the normalization scenario.
Fig. 6. Polarity Scores
Fig.7 represents the classified sentiments in terms of positive and negative aspects. The system is trained and classified using support vector machines and on the basis of the extraction of the feature set and normalization the test, tweets are classified as negative and positive tweets.
Fig. 7. Negative and Positive sentiments
E. Experimental Results
[image:6.595.49.293.102.257.2]Fig. 8 shows the final result of different parameters, in terms of F-measure which deals with the combination of precision and recall rate evaluation and makes the one term. The F-measure must be high for the appropriate detection of the sentiments which measures the test's accuracy and is the weighted harmonic mean of the test for precision and recall. Also, the recall and precision rate are high which deals with the closest to the true value and the retrieval rate. These both must be high for high sensitivity and specificity which increases the true negative and true positive rate. If the true positive rate is high then the accuracy rate for the detection of the automatic classification of the sentiments is also high.
Fig. 8. Results
V. COMPARATIVE ANALYSIS
In this section comparison between the output of the purposed method and the output of other manuscript is performed. The manuscript chosen for comparison is Jianqiang, Z., Xiaolin, G., & Xuejun, Z. (2018) [15]. From table 2 it is noticed that the presented approach is able to achieve high performance than the base approach in terms of high precision rate, high recall rate, high accuracy, and high F-measure. So it can be noticed that the proposed approach is well suited for high recognition of the sentimental analysis.
TABLE II. PERFORMANCE COMPARISON
Parameters CNN SVM & Hybrid
optimization
Precision (%) 87.60 98.34
Recall (%) 87.45 94.83
F-Measures (%) 87.50 96.55
Accuracy (%) 87.62 91.91
On the basis of the different parameter, our proposed technique of hybrid optimization between PSO and cuckoo search has shown better results as compared with CNN. The table of comparison and graphs for that parameter are listed under which depicts our proposed work is more efficient and have better results.
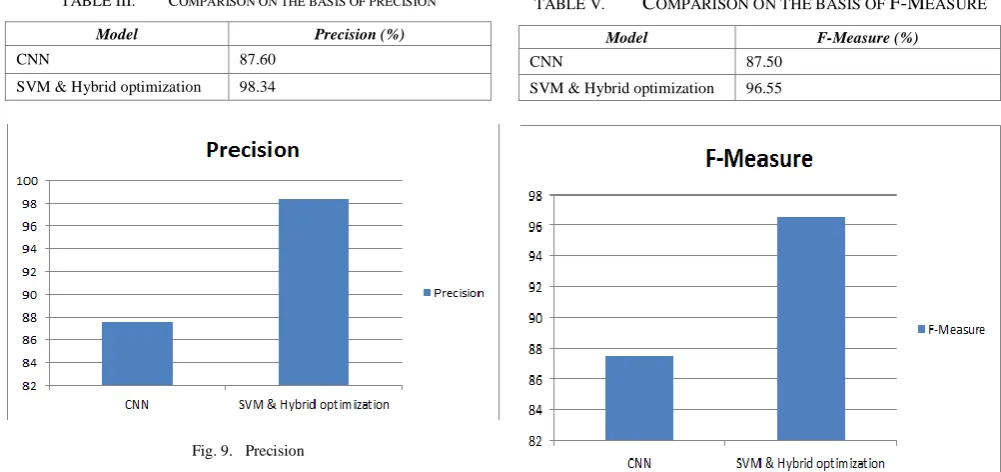
A. Precision
Precision represents the exactness of the model. It is the ratio of the correctly positive predicted sentence to the total positive predicted sentences.
International Journal of Innovative Technology and Exploring Engineering (IJITEE) ISSN: 2278-3075,Volume-8, Issue-9S4, July 2019
TABLE III. COMPARISON ON THE BASIS OF PRECISION
Model Precision (%)
CNN 87.60
[image:7.595.47.548.54.290.2]SVM & Hybrid optimization 98.34
Fig. 9. Precision
B. Recall
It specifies the classifier’s completeness. It is the ratio of the correctly positive predicted sentence to the total number of actual positive sentences.
On the basis of recall comparison between CNN and hybrid optimization done which is listed Table 4 and Fig. 10.
TABLE IV. COMPARISON ON THE BASIS OF RECALL
Model Recall (%)
CNN 87.45
SVM & Hybrid optimization 94.83
Fig. 10.Recall
C. F-Measure
It is the mean of recall and precision. F-measure can be calculated as
On the basis of F-Measure comparison between CNN and hybrid optimization done which is listed Table 5 and Fig. 11.
TABLE V. COMPARISON ON THE BASIS OF F-MEASURE
Model F-Measure (%)
CNN 87.50
SVM & Hybrid optimization 96.55
Fig. 11.F-Measure
D. Accuracy
It is a common performance parameter for evaluation and it calculated as ration of correctly predicted sentences to the total number of sentences present in the dataset.
[image:7.595.303.548.490.690.2]On the basis of accuracy comparison between CNN and hybrid optimization done which is listed Table 6 and Fig. 12.
TABLE VI. COMPARISON ON THE BASIS OF ACCURACY
Model Accuracy (%)
CNN 87.62
SVM & Hybrid optimization 91.91
VI. CONCLUSION
In the proposed work, support vector machine is utilized for sentiment classification of social media data. This approach concatenates hybrid optimization based on PSO and cuckoo search for feature selection and n- gram with sentiment score. The twitter dataset is utilized for the experiment. In this work results are measured in terms of accuracy, recall, precision and f-measure which are 91.91%, 94.83%, 98.34% and 96.55% respectively and these are better than the existing technique based on deep convolution neural network. Finally, it is concluded that feature selection using hybrid optimization technique has good performance in sentiment analysis.
ACKNOWLEDGMENT
This is my sincere gratitude to Dr. Munish Sabharwal, Associate Dean & Professor, Department of Computer Science & Engineering, Chandigarh University, India for providing me guidance and motivating me to learn. I am truly thankful to him for guiding me through the entire paper.
REFERENCES
1. G. Kesavaraj and S. Sukumaran, "A study on classification techniques
in data mining," in 2013 Fourth International Conference on
Computing, Communications and Networking Technologies
(ICCCNT), Tiruchengode, pp. 1-7, 2013.
2. M. S. Akhtar, D. Gupta, A. Ekbal, and P. Bhattacharyya, "Feature selection and ensemble construction: A two-step method for aspect based sentiment analysis," Knowl.-Based Syst., vol. 125, pp. 116-135, 2017.
3. H. Saif, Y. He, and H. Alani, "Semantic Sentiment Analysis of
Twitter," in The Semantic Web - ISWC 2012, pp. 508-524, 2012.
4. S. Kiritchenko, X. Zhu, and S. M. Mohammad, "Sentiment Analysis of
Short Informal Texts," J. Artif. Intell. Res., vol. 50, pp. 723-762, Aug. 2014.
5. N. F. F. da Silva, E. R. Hruschka, and E. R. Hruschka, "Tweet sentiment analysis with classifier ensembles," Decis. Support Syst., vol. 66, pp. 170-179, Oct. 2014.
6. M. Hagen, M. Potthast, M. Büchner, and B. Stein, "Twitter Sentiment
Detection via Ensemble Classification Using Averaged Confidence Scores," in ECIR, 2015.
7. Z. Jianqiang and C. Xueliang, "Combining Semantic and Prior
Polarity for Boosting Twitter Sentiment Analysis," in 2015 IEEE International Conference on Smart City/SocialCom/SustainCom (SmartCity), pp. 832-837, 2015.
8. Z. Jianqiang, "Combing Semantic and Prior Polarity Features for Boosting Twitter Sentiment Analysis Using Ensemble Learning," in 2016 IEEE First International Conference on Data Science in Cyberspace (DSC), pp. 709-714, 2016.
9. M. Thelwall, K. Buckley, and G. Paltoglou, "Sentiment Strength
Detection for the Social Web 1," 2012.
10. G. Paltoglou and M. Thelwall, "Twitter, MySpace, Digg:
Unsupervised Sentiment Analysis in Social Media," ACM Trans. Intell. Syst. Technol., vol. 3, no. 4, pp. 1-19, Sep. 2012.
11. A. Montejo?Ráez, E. Martínez?Cámara, M. T. Martín?Valdivia, and
L. A. Ureña?López, "A knowledge-based approach for polarity classification in Twitter," J. Assoc. Inf. Sci. Technol., vol. 65, no. 2, pp. 414-425, 2014.
12. S. Baccianella, A. Esuli, and F. Sebastiani, "SENTIWORDNET 3.0:
An Enhanced Lexical Resource for Sentiment Analysis and Opinion Mining," p. 5.
13. D. Sharma, M. Sabharwal, V. Goyal, and M. Vij, "Sentiment Analysis
Techniques for Social Media Data: A Review," has presented in First
International Conference on Sustainable Technologies for
Computational Intelligence, on 30th March 2019 given at Sri Balaji College of Engineering and Technology, Jaipur, Rajasthan, India Jaipur.
14. A. Kumar, R. Khorwal, and S. Chaudhary, "A Survey on Sentiment
Analysis using Swarm Intelligence," Indian J. Sci. Technol., vol. 9, no. 39, Oct. 2016.
15. A. Agarwal, B. Xie, I. Vovsha, O. Rambow, and R. Passonneau,
"Sentiment Analysis of Twitter Data," in Proceedings of the Workshop on Languages in Social Media, Stroudsburg, PA, USA, pp. 30-38, 2011.
16. Z. Jianqiang, G. Xiaolin, and Z. Xuejun, "Deep Convolution Neural
Networks for Twitter Sentiment Analysis," IEEE Access, vol. 6, pp. 23253-23260, 2018.
17. R. Xia, J. Jiang, and H. He, "Distantly Supervised Lifelong Learning
for Large-Scale Social Media Sentiment Analysis," IEEE Trans. Affect. Comput., vol. 8, no. 4, pp. 480-491, Oct. 2017.
18. O. Udochukwu and Y. He, "A Rule-Based Approach to Implicit
Emotion Detection in Text," in Natural Language Processing and Information Systems, vol. 9103, C. Biemann, S. Handschuh, A. Freitas, F. Meziane, and E. Métais, Eds. Cham: Springer International Publishing, pp. 197-203, 2015.
19. G. Li and F. Liu, "Sentiment analysis based on clustering: a framework in improving accuracy and recognizing neutral opinions," Appl. Intell., vol. 40, no. 3, pp. 441-452, Apr. 2014.
20. J. Luts, F. Ojeda, R. Van de Plas, B. De Moor, S. Van Huffel, and J. A.
K. Suykens, "A tutorial on support vector machine-based methods for classification problems in chemometrics," Anal. Chim. Acta, vol. 665, no. 2, pp. 129-145, Apr. 2010.
21. W. Zhao, Y. Wang, and D. Li, "A new feature selection algorithm in
text categorization," in 2010 International Symposium on Computer, Communication, Control and Automation (3CA), vol. 1, pp. 146-149, 2010.
22. Munish Sabharwal, "Contemporary Research: Intricacies and Aiding
Software Tools Based on Expected Characteristics" in AIMA Journal of Management & Research, vol. 10, pp. 1-16, 2016.
23. Presented Paper "The use of soft computing technique of Decision Tree in selection of appropriate statistical test for Hypothesis Testing" in the "International Conference on Soft Computing: Theories and Applications (SoCTA 2016)" organized by Amity University, Jaipur, India on December 28-30, 2016, Proceedings in AISC series of Springer Indexed in SCOPUS (Elsevier).
24. H. M. Zin, N. Mustapha, M. A. A. Murad, and N. M. Sharef, "The effects of pre-processing strategies in sentiment analysis of online movie reviews," presented at the THE 2ND INTERNATIONAL CONFERENCE ON APPLIED SCIENCE AND TECHNOLOGY 2017 (ICAST'17), Kedah, Malaysia, p. 020089, 2017.
25. A. Tripathy, A. Agrawal, and S. K. Rath, "Classification of
Sentimental Reviews Using Machine Learning Techniques," in Procedia Computer Science, vol. 57, pp. 821-829, 2015.
26. X. Fang and J. Zhan, "Sentiment analysis using product review data," J. Big Data, vol. 2, no. 1, p. 5, Jun. 2015.
27. W. Medhat, A. Hassan, and H. Korashy, "Sentiment analysis
algorithms and applications: A survey," Ain Shams Eng. J., vol. 5, no. 4, pp. 1093-1113, Dec. 2014.
28. Z. Jianqiang and G. Xiaolin, "Comparison Research on Text
Pre-processing Methods on Twitter Sentiment Analysis," IEEE Access, vol. 5, pp. 2870-2879, 2017.
29. J. Kennedy and R. Eberhart, "Particle swarm optimization," in Proceedings of ICNN'95 - International Conference on Neural Networks, Perth, WA, Australia, vol. 4, pp. 1942-1948, 1995. 30. T. Zeugmann et al., "Particle Swarm Optimization," in Encyclopedia
of Machine Learning, C. Sammut and G. I. Webb, Eds. Boston, MA: Springer US, pp. 760-766, 2011.
31. I. Koohi and V. Z. Groza, "Optimizing Particle Swarm Optimization
algorithm," in 2014 IEEE 27th Canadian Conference on Electrical and Computer Engineering (CCECE), Toronto, ON, Canada, pp. 1-5, 2014.
32. X. S. Yang and S. Deb, "Engineering optimisation by cuckoo search," Int. J. Math. Model. Numer. Optim., vol. 1, no. 4, p. 330.
33. C. O. Alm, D. Roth, and R. Sproat, "Emotions from Text: Machine
Learning for Text-based Emotion Prediction," in HLT/EMNLP, 2005.
34. J.-S. Chou, M.-Y. Cheng, Y.-W. Wu, and A.-D. Pham, "Optimizing
parameters of support vector machine using fast messy genetic algorithm for dispute classification," Expert Syst. Appl., vol. 41, no. 8, pp. 3955-3964, Jun. 2014.
International Journal of Innovative Technology and Exploring Engineering (IJITEE) ISSN: 2278-3075,Volume-8, Issue-9S4, July 2019
AUTHORS PROFILE
Dipti Sharma received her bachelor Engineering Degree in Computer Science Engineering from Himachal Pradesh Technical University, Hamirpur, H.P., India in 2015. She is currently a M.E. student in Chandigarh University since 2017. Her research interest is in Machine Learning.