promoting access to White Rose research papers
Universities of Leeds, Sheffield and York
http://eprints.whiterose.ac.uk/
This is an author produced version of a paper published in Journal of Hydrology.
White Rose Research Online URL for this paper:
http://eprints.whiterose.ac.uk/7932/ (includes link to associated Figures file)
Published paper
Holden, J. (2009) Flow through macropores of different size classes in blanket peat. Journal of Hydrology, 364 (3-4). pp. 342-348.
Flow through macropores of different size classes in blanket peat
Joseph Holden
School of Geography, University of Leeds, Leeds, LS2 9JT, UK. [email protected]
Abstract
Keywords
Peat, Macropores, Runoff, Infiltration, Tension infiltrometer, Effective porosity
1. Introduction
Peat covers 3 % of the world’s landmass but is much more important in terms of its role in delivering water and sequestering carbon (Holden, 2005b). Research on blanket peats has shown that runoff production tends to be very flashy and dominated by quickflow response with very little baseflow (Burt, 1995; Holden and Burt, 2003a; Holden and Burt, 2003b; Price, 1992). Flow production is controlled by the saturated state of the peat mass and the low hydraulic conductivity of the lower peat layers such that near-surface and saturation-excess overland flow dominate (Evans et al., 1999; Holden and Burt, 2003b; Holden, et al. 2007).
Baird (1997) studied a fen peat with a tension infiltrometer finding that macropore flow contributed between 51 and 78 % of the flow at the peat surface.
Little research has been done on the comparative roles of macropores of different sizes in conducting water through peats. Porous media physics would suggest that it is likely that the larger pores play a significant role in transporting water through peats rather than the smaller pores but field and laboratory determinations have been rare. Carey et al. (2007) employed tension infiltrometer measurements and image analysis on subarctic organic soils to assess the role of different pore sizes in peat water transmission. They found that total effective porosity was 1.1 x 10⁻⁴ which accounted for only 0.01% of the total soil volume with macropores (defined as those pores larger than 1 mm in diameter) accounting for approximately 65% of the water flux at
content at depth in the profile was greater than near the surface, suggesting a short-circuiting of water flow through them. Some evidence came from ‘wet fingers’ that were observed in the field (Holden and Ward, 1997). Further evidence came from Holden (1998) who examined air-dried milled peat from the surface of a drained bog. From core samples, outflow was similar to the spray rate and little water accumulated in the peat. Bypassing flow paths appeared to form readily.
Macroporosity is important for transport characteristicsof solutes (Ours et al., 1997; Reeve et al., 2001) and indirectly influences peatland gas exchange (Siegel et al., 1995). Since most of the runoff in blanket peatlands is generated within the upper peat, these layers will also be important in terms of solute production. Runoff
emerging from blanket peat catchments suffers from several water quality problems, including high concentrations of dissolved organic carbon which is associated with discolouration. In the UK, which hosts 15 % of the world’s blanket peat deposit, the headwater blanket peats are sources for large quantities of solutional discolouring organics, which are an expensive and growing problem for water supply companies (Mitchell and McDonald, 1992; Mitchell and McDonald, 1995; Mitchell, 1990; Worrall et al., 2003; Worrall et al., 2006). Understanding flow through differently sized peat pores would enable us to improve our transport models, and our
Blanket peat is formed from the residue of vegetation that grows on it. For this reason its structure is likely to be partly affected by the surface vegetation. The structure of plant roots and litter produced by living vegetation will also interact with the upper peat layer to impact its structure and the potential for bypassing flow. Furthermore, bare peats often suffer from desiccation in dry spells and frost-heave in cold spells (Gilman and Newson, 1980; Tallis, 1973). Thus, unprotected peats may have a different structure in the upper layers due to these physical processes. It would be expected that the vegetation cover type would have some control over the proportion of flow moving through different pore size classes. Additionally Bradley and Van Den Berg (2005) examined infiltration in a flood-plain wetland peat formed largely from reeds and found large changes in water flow through large and small pores with depth. As peat properties can change rapidly with depth it is also expected that depth will control the proportion of flow moving through different pore size classes in blanket peat.
This paper aims to examine the role of a range of pore sizes in the infiltration and percolation process in blanket peat and to assess whether the flow in the different pore size classes is affected by vegetation cover type and distance from the peat surface. Unpublished data collected during the course of experiments performed by Holden et al. (2001) will be examined for the first time in this paper. It is hypothesised that i) flow through small pores (<0.25 mm in diameter) plays only a small role in
Some authors have classified pores into macropores, mesopores and micropores, where the latter corresponds with the small pores associated with the soil matrix (Luxmoore, 1981). Definitions of the size of such features vary. In this paper four pore size classes with the ranges <0.25 mm, 0.25-0.50, >0.50-1.00 mm and >1.00 mm are investigated. In order to avoid confusion these pore sizes classes are not given descriptive terms here.
2. Study site
The experiments were performed at the Moor House National Nature Reserve, North Pennines, England (54o 41’ N, 2o 23’ W). This is one of the largest areas of blanket bog in the UK and as a UNESCO Biosphere Reserve is recognised for its worldwide importance. Lower Carboniferous sequences of interbedded limestone, sandstone and shale provide a base for a glacial till (Johnson and Dunham, 1963). The overlying glacial till has resulted in poor drainage which has led to the development of a one to four metre thick deposit of blanket peat on around 70 % of the reserve. Peat formation began in the late Boreal as bog communities began to replace birch forest, macro-remains of which are commonly found at the base of the peat (Johnson and Dunham, 1963). The vegetation is dominated by Eriophorum sp. (cotton grass), Calluna vulgaris (ling heather) and Sphagnum sp. (moss). There are also some areas of bare
complete by 1.5 m depth (H9). Further details on the peat at the study site are provided in Johnson and Dunham (1963) and Holden et al (2001). Dry bulk
densities range from 0.15 g cm-3 at the surface to 0.18 g cm-3 at 20 cm depth gradually increasing to 0.27 g cm-3 at 50 cm depth. Total porosity of the blanket peat at the site is typically within the range of 90 to 97 % which corresponds well with total porosity for blanket peats reported elsewhere (Bozkurt et al., 2001).
3. Methods
A tension disk infiltrometer similar to that designed by Ankeny et al. (1988) was used in the study during summer 1999. A 100 m x 100 m area was used for sampling and contained the four most common surface types found at the field site (Calluna, Eriophorum, Sphagnum and bare peat). Infiltration measurements were taken at eight
using the method outlined by Reynolds and Elrick (1991). A problem with data collection is related to the assumption that the hydraulic conductivity of the soil prior to the test is substantially below that which prevails during the test when the soil saturates and this may not hold true in peat, particularly if the water table is high. However, Holden et al. (2001) showed that within the context of the large range of values of hydraulic conductivity within blanket peat, the errors produced during this study would be minor. They also showed that the concerns surrounding Wooding’s (1968) assumption of isotropy would also result in minimal errors for these tests.
The procedure presented by Watson and Luxmoore (1986) and Wilson and Luxmoore
(1988) was used to calculate effective porosity volumes whereby effective porosity, θ, associated with each size class was calculated from Poiseuille’s equation by:
θ = (8 μKm) / (ρ g r2)
where μ is the viscosity of water, ρ is the density of water, g is the acceleration of
gravity and r is the minimum radius for the size class. Hence, the effective porosity value is a minimum estimated value. The pore flow, Km, was calculated as the difference between conductivities at a given pressure head and the next higher pressure head (Azevedo et al., 1998). The water temperature was measured for each
tension infiltrometer experiment allowing improved determinations of μ and ρ.
4. Results
4.1 Infiltration rates
Infiltration rate was significantly controlled by vegetation cover, soil depth and water tension (p < 0.001). Infiltration was significantly greater at 0 cm than at any of the other tensions in the plots. There was a large decrease in infiltration rates from 0 to -3 cm tension showing that under saturated flow conditions, flow in pores > 1 mm in diameter is a significant pathway for water movement. Figure 1 presents mean measured infiltration rates at 0, -3, -6, -12 cm water tension for the peat plots under each vegetation cover type and for the four tested soil depths. Infiltration rates declined rapidly with soil depth indicative of a sharp reduction in hydraulic
conductivity. The steepest decline in infiltration rates appears to occur over the top 5 cm of the peat. This was found to be more pronounced for the larger tensions applied, suggesting that flow in pores > 1 mm declines much more rapidly with depth than flow in smaller pores.
Vegetation cover type significantly controlled infiltration rate from the tension infiltrometer and Figure 1 suggests that Sphagnum and bare peat have different
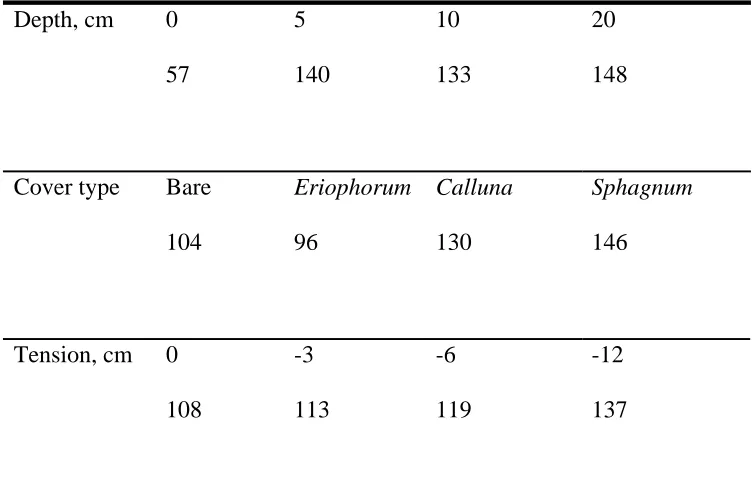
The coefficient of variation (CV) was calculated for infiltration rates for each category of depth, tension and vegetation cover type as shown in Table 1. CV was much smaller at the surface (57 %) than deeper within the peat. Infiltration rates appear more variable below a Sphagnum or Calluna cover than below an Eriophorum or bare peat.
4.2 Flux by pore size class
Figure 2 plots the proportion of flow moving within pores of different size classes for each treatment. There is generally approximately the same proportion of flow moving between pores of between 0.25 and 0.5 mm in diameter as there is moving between pores of between 0.5 and 1 mm in diameter. The total flow in pores > 1 mm in
diameter is greater than the total flow between any of the other pore classes examined. The depth with the largest proportion of flow occurring in pores > 0.25 mm was 5 cm for bare, Eriophorum and Calluna peats. For Sphagnum-covered peats the proportion of flow in pores > 0.25 mm increased with depth over the 4 depth categories studied.
It is possible from Figure 2 to examine the proportion of flow occurring in pores < 0.25 mm in diameter as this is the residual flow (i.e. up to 100 %) not accounted for by flow through the pores shown by the bars on the chart. Flow in pores < 0.25 mm in diameter accounts for less than 50 % of the flow on average in all but one case (bare peat at 10 cm depth) and the proportion of flow is typically between 20 and 30 %.
0.001). Flow contributions in pores > 1 mm are greater at 5 cm depth than for other layers, except below a Sphagnum cover. In general Sphagnum-covered peats are associated with a greater role for macropores in the infiltration process. In non-Sphagnum covered peat the depth control is evident, with a maximum proportion of
flux for pores > 1 mm occurring at 5 cm and a minimum at 20 cm depth. Surface flux contributions for pores > 1mm in the blanket peat were between 21 % (minimum) and 68 % (maximum) irrespective of vegetation cover.
4.3 Effective porosity
Effective fractional porosity data were highly variable, and positively skewed, ranging from 6804 cm3 m-3 to 0.002 cm3 m-3 and a skewness of 4.74. A logarithmic
transformation was therefore applied before conducting ANOVA so that the variability between the categories is more constant. This enabled the main
Effective porosity decreased rapidly with depth (Figure 4) and increased with
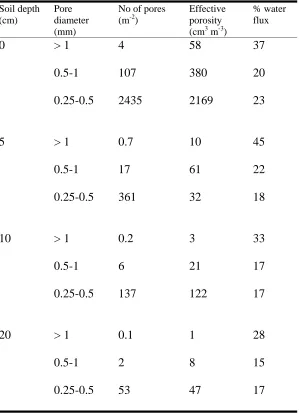
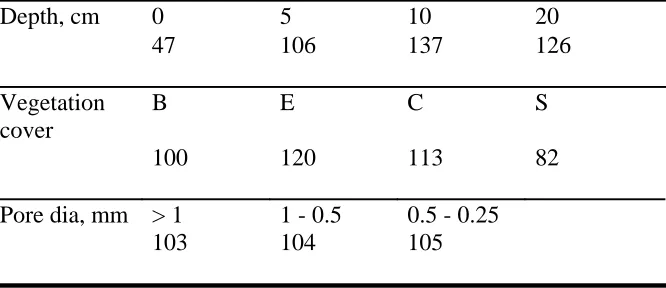
decreasing pore size class (Table 3). Most runoff appears to be generated through only a small proportion of the peat. Table 3 shows that at the peat surface approximately 80 % of the flow was generated through only 0.26 % of the peat volume. Table 4 shows that CVs are greater at depth and below an Eriophorum cover (120 %) than other cover types. Sphagnum peats have the lowest CVs with a mean of 82 %. There appears to be little difference in CVs of effective porosity between pore size classes suggesting that variability is the same within different pore size classes in the peats tested.
5. Discussion
The results above show that pores < 0.25 mm in diameter play only a minor role in infiltration and percolation in the upper 20 cm of blanket peat. Of the percolating water measured over the upper 20 cm of the peat mass, only 22 % moved through pores smaller than 0.25 mm in diameter. Given that most runoff in blanket peat is produced by the upper 20 cm (Holden and Burt, 2003a) this is an important finding. At the peat surface 80 % of the flow occurred through 0.260 % of the peat volume. While flow rates were an order of magnitude lower at 5 cm depth, 85 % of the flow at this depth occurred through 0.010 % of the soil volume. 67 % of the flow occurred through 0.014 % of the soil volume at 10 cm depth, while at 20 cm depth 60 % of the flow at this depth occurred through just 0.003 % of the soil volume. However, flow rates at 20 cm depth were two orders of magnitude lower than at the peat surface.
soil volume). These results are also in line with values obtained for forested soils by Wilson and Luxmoore (1988) and Watson and Luxmoore (1986). For peatlands, the only other reported results with which to compare these findings come from the subarctic work of Carey et al. (2007). Where comparable data between the two studies are available the results are similar. For example, comparison of Table 3 in this study with Table IV in Carey et al. (2007) shows similar results for the number of pores m-2 and effective porosity for pore class sizes between 0.25 and 0.50 mm in diameter (or 0.277 to 0.448 mm as it is in Carey et al., 2007) and pore classes between 0.50 and 1.00 mm in diameter at the peat surface. The similarity in peat macropore properties (proportion of flow in pores > 1mm) between the subarctic site and the blanket peat of northern England was also pointed out by Carey et al. (2007) when they compared their results to the blanket peat work of Holden et al. (2001).
may also play a role in the pore assemblage. However, the density of earthworms on peat soils is very low, ranging from one worm per 100 m2 on Eriophorum dominated areas to 13 worms per 100 m2 on Calluna-dominated areas (Svendsen, 1957). Peachey (1963) found enchytraeid worms in moorland soils contributed by far the greatest biomass. Worm ingestion and egestion of peat may result in decreased pore size and
continuity. However, these worms (Oligochaeta) are typically 50 μm in diameter and are therefore not likely to be important in terms of the pore classes tested in this paper. Enchytraeidae tend to be more dominant under Eriophorum and Calluna covers, less abundant beneath Sphagnum and much less dense in bare peat (Springett, 1970.). Nevertheless, there may still be c. 20 000 enchytraeidae per m-2 in bare peat. It is more likely that the differences between bare peat and vegetated peat were a function of a combination of enhanced desiccation of the near-surface of bare peat combined with erosion into deeper, older more humified peat, meaning that at depths of 10 or 20 cm the peat is older and more decomposed that at the same depths under uneroded, vegetated conditions.
peat. This suggests that many pores > 0.25 mm diameter in the upper 20 cm of the peat are not likely to extend vertically into the peat by more than a few cm.
6. Conclusions
This paper examined the role of a range of pore sizes in the infiltration and
percolation process in blanket peat assessed whether the flow in the different pore size classes was affected by vegetation cover type and distance from the peat surface. The paper tested three hypotheses which suggested that flow through small pores (<0.25 mm in diameter) would play only a small role in infiltration and percolation in the upper 20 cm of blanket peat, that the vegetation cover type controls the proportion of water that flows through different macropore size classes and that effective porosity will be effected by vegetation cover type. These hypotheses were all accepted. Flow through small pores <0.25 mm in diameter played only a small role in infiltration and percolation in the upper 20 cm of blanket peat accounting for just 22 % of the
in flow and effective porosity was found to be similar between different pore size classes suggesting that pore hydraulic properties were just as variable within larger pores > 1mm as they are in smaller pores < 0.25 mm in diameter.
Given the dominance of flow through pores > 0.25 mm in diameter in blanket peats more work is required on understanding the biogeochemistry and the
hydromorphology of these pores in order to improve our understanding of runoff production and solutional denudation in peatland catchments.
Acknowledgements
References
Allaire, S.E., Gupta, S.C., Nieber, J. and Moncrief, J.F., 2002a. Role of macropore continuity and tortuosity on solute transport in soils: 1. Effects of initial and boundary conditions. Journal of Contaminant Hydrology, 58(3-4): 299-321. Allaire, S.E., Gupta, S.C., Nieber, J. and Moncrief, J.F., 2002b. Role of macropore
continuity and tortuosity on solute transport in soils: 2. Interactions with model assumptions for macropore description. Journal of Contaminant Hydrology, 58(3-4): 283-298.
Ankeny, M.D., Kaspar, T.C. and Horton, R., 1988. Design for an Automated Tension Infiltrometer. Soil Science Society of America Journal, 52(3): 893-896.
Azevedo, A.S., Kanwar, R.S. and Horton, R., 1998. Effect of cultivation on hydraulic properties of an Iowa soil using tension infiltrometers. Soil Science, 163(1): 22-29.
Baird, A.J., 1997. Field estimation of macropore functioning and surface hydraulic conductivity in a fen peat. Hydrological Processes, 11(3): 287-295.
Blodau, C. and Moore, T.R., 2002. Macroporosity affects water movement and pore water sampling in peat soils. Soil Science, 167: 98-109.
Bozkurt, S., Lucisano, M., Moreno, L. and Neretnieks, I., 2001. Peat as a potential analogue for the long-term evolution in landfills. Earth-Science Reviews, 53(1-2): 95-147.
Bradley, C. and Van Den Berg, J.A., 2005. Infiltration mechanisms in a herbaceous peat: reults of a controlled infiltration experiment. Hydrological Sciences Journal, 50: 713-725.
Burt, T.P., 1995. The role of wetlands in runoff generation form headwater catchments. In: J.M.R. Hughes and A.L. Heathwaite (Editors), Hydrology and Hydrochemistry of British Wetlands. John Wiley and Sons Ltd, Chichester, pp. 21-38.
Carey, S.K., Quinton, W.L. and Goeller, N.T., 2007. Field and laboratory estimates of pore size properties and hydraulic characteriscs for subarctic organic soils. Hydrological Processes, 21: 2560-2571.
Chanson, D.B. and Siegel, D.I., 1986. Hydraulic conductivity and related physical properties of peat, Lost River peatland, northern Minnesota. Soil Science, 142: 91-99.
Evans, M. and Warburton, J., 2005. Sediment budget for an eroding peat-moorland catchment in northern England. Earth Surface Processes and Landforms, 30(5): 557-577.
Evans, M.G., Burt, T.P., Holden, J. and Adamson, J.K., 1999. Runoff generation and water table fluctuations in blanket peat: evidence from UK data spanning the dry summer of 1995. Journal of Hydrology, 221(3-4): 141-160.
Gilman, K. and Newson, M.D., 1980. Soil pipes and pipeflow; a hydrological study in upland Wales. British Geomorphological Research Group Research Monograph No. 1. Geo Books, Norwich.
Holden, J., 2005a. Controls of soil pipe frequency in upland blanket peat. Journal of Geophysical Research, 110: F01002, doi:10.1029/2004JF000143.
Holden, J., 2005b. Peatland hydrology and carbon cycling: why small-scale process matters. Philosophical Transactions of the Royal Society A, 363: 2891-2913. Holden, J., 2005c. Piping and woody plants in peatlands: cause or effect? . Water
Holden, J., 2006. Sediment and particulate carbon removal by pipe erosion increase over time in blanket peatlands as a consequence of land drainage. Journal of Geophysical Research-Earth Surface, 111(F2).
Holden, J. and Burt, T.P., 2002. Piping and pipeflow in a deep peat catchment. Catena, 48(3): 163-199.
Holden, J. and Burt, T.P., 2003a. Hydrological studies on blanket peat: the significance of the acrotelm-catotelm model. Journal of Ecology, 91(1): 86-102.
Holden, J. and Burt, T.P., 2003b. Runoff production in blanket peat covered catchments. Water Resources Research, 39(7): 1191, doi:10.1029/2003WR002067.
Holden, J., Burt, T.P. and Cox, N.J., 2001. Macroporosity and infiltration in blanket peat: the implications of tension disc infiltrometer measurements. Hydrological Processes, 15: 289-303.
Holden, J., Shotbolt, L., Bonn, A., Burt, T. P., Chapman, P. J., Dougill, A. J., Fraser, E. D. G., Hubacek, K., Irvine, B., Kirkby, M. J., Reed, M. S., Prell, C., Stagl, S., Stringer, L. C., Turner, A., Worrall, F., 2007. Environmental change in moorland landscapes. Earth-Science Reviews, 82: 75-100.
Holden, N.M., 1998. By-pass of water through laboratory columns of milled peat. International Peat Journal, 8: 13-22.
Holden, N.M. and Ward, S.M., 1996. The use of time domain reflectrometry in laboratory experiments to investigate rates of infiltration into milled stockpiles., American Society of Agricultural Engineers annual international meeting, 'Managing today's technology', Phoenix Civic Plaxa, pp. Paper 962005.
Holden, N.M. and Ward, S.M., 1997. A field investigation into the rewetting of milled peat in stockpiles. International Peat Journal, 7: 33-40.
Ingram, H.A.P., Rycroft, D.W. and Williams, D.J.A., 1974. Anomalous transmission of water through certain peats. Journal of Hydrology, 22: 213-218.
Johnson, G.A.L. and Dunham, K.C., 1963. The geology of Moor House. Monographs of nature conservancy, 2. Nature conservancy, London.
Jones, J.A.A., 2004. Implications of natural soil piping for basin management in upland Britain. Land Degradation & Development, 15(3): 325-349.
Luxmoore, R.J., 1981. Micro-, meso- and macroporosity of soil. Soil Science Society of America Journal, 45: 671-672.
Mitchell, G. and McDonald, A.T., 1992. Discoloration of Water by Peat Following Induced Drought and Rainfall Simulation. Water Research, 26(3): 321-326. Mitchell, G. and McDonald, A.T., 1995. Catchment Characterization as a Tool for
Upland Water-Quality Management. Journal of Environmental Management, 44(1): 83-95.
Mitchell, G.N., 1990. Natural Discoloration of Fresh-Water - Chemical-Composition and Environmental Genesis. Progress in Physical Geography, 14(3): 317-334. Ours, D.P., Siegel, D.I. and Glaser, P.H., 1997. Chemical dilation and the dual
porosity of humified peat. Journal of Hydrology, 196: 348-360.
Peachey, J.E., 1963. Studies on Enchytraeidae (Oligochaeta) of moorland soil. Pedobiologia, 2: 81-95.
Price, J.S., 1992. Blanket Bog in Newfoundland 2. Hydrological Processes. Journal of Hydrology, 135(1-4): 103-119.
Reynolds, W.D. and Elrick, D.E., 1991. Determination of hydraulic conductivity using a tension infiltrometer. Soil Science Society of America Journal, 55(3): 633-639.
Siegel, D.I., Reeve, A.S., Glaser, P.H. and Romanowicz, E.A., 1995. Climate driven flushing of pore water in peatlands. Nature, 374: 531-533.
Springett, J.A., 1970. The distribution and life histories of some moorland Enchytraeidae (Oligochaeta).
Svendsen, J.A., 1957. The distribution of Lumricadae in an area of Pennine moorland (Moor House National Nature Reserve). Journal of Animal Ecology, 26: 411-421.
Tallis, J.H., 1973. Studies on Southern Pennine Peats 5. Direct observations on peat erosion and peat hydrology at Featherbed Moss, Derbyshire. Journal of Ecology, 61(1): 1-22.
Von Post, L., 1922. Sveriges Geologiska Undersoknings torvinventering och nogra av dess hittils vunna resultat (SGU peat inventory and some preliminary results). , . Svenska Mosskulturforeningens Tidskrift, Jonkoping, Sweden, 36: 1-37. Watson, K.W. and Luxmoore, R.J., 1986. Estimating macroporosity in a forest
watershed by use of a tension infiltrometer. Soil Science Society of America Journal, 50(3): 578-582.
Wilson, G.V. and Luxmoore, R.J., 1988. Infiltration, macroporosity, and mesoporosity distributions on two forested watersheds. Soil Science Society of America Journal, 52: 329-335.
Wooding, R.A., 1968. Steady infiltration from a shallow circular pond. Water Resources Research, 4: 1259-1273.
Worrall, F., Burt, T. and Shedden, R., 2003. Long term records of riverine carbon flux. Biogeochemistry, 64(2): 165-178.
Figure captions
Figure 1. Mean infiltration rate for blanket peat under the tension infiltrometer by depth and vegetation cover category for water tensions of a) 0 cm, b) -3 cm, c) -6 cm, d) -12 cm. Letters refer to surface cover type; B = bare, E = Eriophorum, C = Calluna, S = Sphagnum.
Figure 2. Contribution to flow by pore size classification for each vegetation cover and depth treatment. Standard error bars are shown.
Figure 3. Mean flow contribution, %, to saturated hydraulic conductivity for pores > 1 mm in diameter for each measurement depth by vegetation cover type. Letters refer to vegetation cover type; B = bare, E = Eriophorum, C = Calluna, S = Sphagnum.
Table 1. Coefficient of variation, %, for infiltration rate with depth, cover type and water tension categories.
Depth, cm 0 5 10 20
57 140 133 148
Cover type Bare Eriophorum Calluna Sphagnum
104 96 130 146
Tension, cm 0 -3 -6 -12
Table 2. Analysis of variance of effective porosity by depth, vegetation cover and pore size categories. a) For the whole dataset; b) for pores between 0.25-0.5 mm in diameter; c) for pores > 0.5 and < 1.0 mm in diameter; and d) for pores > 1.0 mm in diameter.
a)
Source d.f. F Prob > F
Depth 3 205.3 0.000
Vegetation cover 3 6.91 0.000 Pore size class 2 220.0 0.000
b)
Source d.f. F Prob > F
Depth 3 66.64 0.000
Vegetation cover 3 1.85 0.141
c)
Source d.f. F Prob > F
Depth 3 66.46 0.000
Vegetation cover 3 2.28 0.083
d)
Source d.f. F Prob > F
Depth 3 66.85 0.000
Table 3. Geometric mean of pore parameters estimated from the tension infiltrometer data and Poiseuille’s equation.
Soil depth (cm)
Pore diameter (mm)
No of pores (m-2)
Effective porosity (cm3 m-3)
% water flux
0 > 1 4 58 37
0.5-1 107 380 20
0.25-0.5 2435 2169 23
5 > 1 0.7 10 45
0.5-1 17 61 22
0.25-0.5 361 32 18
10 > 1 0.2 3 33
0.5-1 6 21 17
0.25-0.5 137 122 17
20 > 1 0.1 1 28
0.5-1 2 8 15
Table 4. Coefficients of variation for effective porosity by depth, vegetation cover and pore size class category.
Depth, cm 0 5 10 20
47 106 137 126
Vegetation cover
B E C S
100 120 113 82
Pore dia, mm > 1 1 - 0.5 0.5 - 0.25