DIRECTORATE-GENERAL COMPETITION IV; A--3
A STUDY OF THE EVOLUTION
OF CONCENTRATION
COMMISSION OF THE EUROPEAN COMMUNITIES DIRECTORATE-GENERAL COMPETITION
IV/ A-3
09/74-E
/. I.S
/A STUDY OF THE EVOLUTION
OF CONCENTRATION
IN THE FOOD INDUSTRY
IN THE
NETHERLAND~
Y3tf.[·~s T
o)(6·0)
DUTCH FOOD INDUSTRY
BY
Dr. H.W. de Jong,
Professor of Economics
Nijenrode, Instituut voor Bedrijfskunde, Breukelen,
The Netherlands
in collaboration with
Drs.
w.
KarssenDrs.
c.
KlopperDrs. R. de Lange
Drs. A. H. Smolders
CONTENTS
Part 1 : General Report
Part 2: Concentration in the fish-canning industry
Part
3:
Concentration in the vegetables and fruit processing industryPart
4:
Concentration in the meat processing industryPart
5:
Concentration in the dairy industryPart
6:
Concentration in the sugar industryPart
7:
Concentration in the flour and bakery industriesReport on Concentration in the Dutch Food Industry
1.
IntroductionThis report has as its primary aim to give an idea of the development
of concentration in the Dutch food industry in general during the
period
1964-1971;
the food industry is for the purpose of thiscoordinated Common Market investigation, to be defined as including
all industrial sectors producing food products, with the exception
of drinks and tobacco.
Trading activities in food products have been systematically
eliminated, while the geographical area of manufacturing is restricted
to the Netherlands.
Agricultural production -comprising the raising of food products on the
soil by farmers, fruit and vegetables growers, etc.- or fisheries are
strictly excluded. Attention is thus confined to the manufacturing
and processing food industry.
This is nevertheless a large branch of industry in the Netherlands.
As the figures of table 1 indicate, the number of firms with more than
10 employees was more than 1500 in 1964, and notwithstanding a decline,
there remained over 1200 firms in 1971 with some 125,000 employees
and a total sales value of more than Fls. 20,000 million (S 5,710 million
2. Methods of Research
The research was carried out on the basis of the data provided by the
General Industrial Statistics of the Central Bureau of Statistics,
the Hague. All firms with more than 10 employees have been taken as
the base material; however the relevant calculations for the
concentration- and variation-coefficientswere made on the basis of the
following criteria for the separate variables:
- for employees, the companies with more than 100 employees were taken
for domestic sales, the cut-off point was Fls. 10 million.
for export sales, the cut-off point was Fls.
5
million.for investments, the firms investing annually in excess of Fls. 2
million (before
1966)
and Fls.3
million (between1966
and1971)
were taken into account.
These demarcation lines provided groups of the largest firms, on
which the quantitative concentration studies were performed.
for the calculation of concentration-indices relating to the
wage-bill some problems appeared. There were differences in the reporting
card systems and it was not always clear whether the wage-bill referred
to firms or plants.
Moreover, the C.B.S. survey covered only companies with more than 500
employees and, most important, no wage-bill figures were available
for the food industry as a whole (this is one of the exceptions pertaining
to Dutch sectoral statistics in this field). As a result of these
deficiences it turned out to be impossible to calculate the concentration
ratios, Herfindahl-, Gini- and Entropy-indices for the wage-bill variable,
and, consequently, only Linda-indices are computed. Also, for companies
with less than 500 employees for which the exact data were not available
some wage-bill figures were estimated by means of applying averages
found from known companies; this ·procedure does not seem to give rise to
more than minor deviations.
The companies included by the criteria mentioned were analysed separately.
For each variable, the fourty or so largest companies were taken apart and
concentration ratios - where possible - were calculated fov the
4, 8,
12, 20, 30 and 40 largest firms. The other companies, falling under the criteriamentioned, were divided into size-classes; the number of classes was chosen
in accordance with the variable at hand. The total number of companies under
the criteria is mentioned in the first column of each table, following the
year stated. The variation coefficients, Herfindahl and Entropy-indices were
calculated by taking into account all the firms in the food sector.
The procedure followed was to establish a linear extrapolation for the
values of the firms belonging to the group outside the criteria enumerated
-3-For control purposes, it was evaluated for the concentration indices
relating to a particular variable, which part of the sum of firms
enumerated by the General Industrial Statistics was covered by the
firms under the criteria; also, in respect of the calculated Linda
indices, which part of the G.r.s. was covered by the
40
or50
largest companies. The results of these tests are to be found in table 2,3, 4
and
5,
giving the percentages per annum and on average for the wholeperiod.
Finally, a list of mergers in the Dutch food industry covering the years
1964-1971
has been prepared (page8)
and a short comment is added.More detailed remarks will be provided in the sub-sector reports.
3.
~he Resultsa. The coefficients of dispersion
For the variable employees, both the variation-coefficient and the
Gini-coefficient have a tendency to increase, reflecting an increasing
disparity in the size relationships of the largest companies. The number
of firms with more than
100
employees declined by some72
units, or about one-sixth to one-seventh of the original total. This points toincreasing absolute concentration, which went hand in hand with an
increasing relative concentration.
A similar development is to be seen for the variables domestic sales
and exports, though the tendencies mentioned were stronger for exports.
For both variables, the two coefficients rose 13% or more throughout
the years, with a marked jump during the final years. Dispersion
coefficients relating to investments show a decline for the variation
coefficient and a rise for the Gini-coefficient.
b. The concentration ratios provide us with a similar picture: for the
variable employees, the
C4
ratio increased by3.5
percentage points,the following ratios
(c8,
C12) adding only 1 percentage point to thetotal rise, and the group of the firms making up the difference between
C20 and C30 adding 2 percentage points. Finally, the bottom class of
10
firms did not raise the concentration ratio. These tendencies arealso apparent in the concentration ratios of domestic sales and export
sales, again on an increased scale. Whereas the top
4
companies in theby
3.5
percentage points, the increase for the variable domestic saleswas
5
percentage points and for the variable exports no less than 11.5percentage points.
For the next size groups of firms (i.e. the 20 to 40 largest firms) the
rises were more modest, but nevertheless for the latter two variables
(domestic sales and exports) double the amounts of the variable employees.
We thus retain the following conclusions:
1. Concentration in the food industry increased generally for the 40 or
so largest firms.
2. The general increase in concentration was however mot evenly spread;
in fact, the largest firms among this group of the 40 or so largest
firms pushed up the concentration ratios more than proportionately
for all these variables, but not including investments. As to
invest-ments, concentration did not change for the share of the four largest
companies and only to a small extent for the eight largest. The group
of the twelve and higher largest investing firms did however increase
its share by some
7
to 11 percentage points throughout the years.3.
The rise in concentration ratios accelerated during the last threeyears under review
(1969-1971).
In
1969
there was a decline as compared with previous years, but thelevel of concentration in subsequent years was generally lifted over
the level attained in
1967/68.
The causes of the rise in concentration in general and its more than
propoDtional rise among the top group and during the later years appear
to be:
- a constant stream of mergers among food companies, swelling in
1969,
1970 and 1971. The later years have seen some important mergers
in-fluencing the outcome. Among these were the dairy mergers of 1969-1970,
constituting the cooperative milk producers organisations, which have
been counted as mergers, because they led to organisations coordinating
and integrating the market behavior of the producers. For a more
detailed account of the development of the dairy sector, see the
accompanying report. Besides, the meat processing activities of two
-5-by means of centralisation in the hands of Coveco (see the report on
the meat canning industry).
A
third field where important mergers occurredwas the poultry slaughtering industry.
-- Apart from mergers, the largest food companies have grown relatively
fast by means of internal expansion. The main producers increased their
exports much faster than their domestic sales, confirming a tendency
also found in other sector studies, namely that the main companies have
derived a large benefit from the opening of the European Common Market.
The export figures of table 10 show that whereas Dutch food exportsto E.E.C. countries rose by nearly 200%, exports to other countries in the
world increased only by
56%.
The strongest growth of food exports tookplace to W.-Germany and Italy.
As
to the level of concentration, this has remained modest,notwith-stahding the rise, at least so far as concentration of employees and
domestic sales in the hands of the largest firms is concerned. Thus, the
largest
4
firms had between 15 and 20% of employees and domestic sales,and the largest 20 firms did not account for more than
35
to 42%.The level of export concentration is however higher. The
4
largest firmsaccounted in the later years for 25 to 30% of exports, and the 20
largest firms had between
55
and60%.
Investment concentTation showed divergent tendencies.
Both the absolute concentration ratios and the relative spread indices
exhibited variations throughout the years, though the concentration ratios
showed on balance some increases.
The investment concentration level was throughout the years higher than
concentration in employment and domestic sales, though lower than in
exports. This illustrates the fact that the largest companies have
invested (and exported) relatively more than the smaller ones.
c. The general picture given above, is confirmed by the Herfindahl and
Entropy-indices. There was a general rise during the period (with the
exception of the investment variable), but the levels attained even during
the later years remained modest. Thus, the Dutch food industry, in general
consisting of very me~y competing firms, shows a structure of modest
concentration, a rather pronounced disparity between firm sizes, a decline
in the number of the largest companies, and an ongoing concentration,
The top companies effected many smaller take-overs, plus some larger
regroupings at the end of the sixties and early seventies. Alongside
mergers, domestic market growth and export expansion took place, the latter
developments obviously stimulated by inflationary movements in prices.
Rationalisation of output accounted for a stable level of employment
(see table 1).
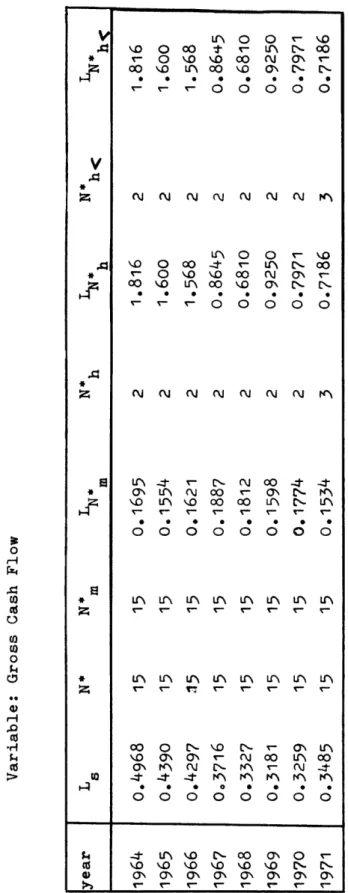
do The Linda-indices (tables 11 to 14) are in accordance with the findings:
1. the averages for the Linda-indices (Ls) for all variables are modest
(between 0.2 and 0.3) throughout the period.
2. the L-index for the top two firms is generally higher than 1, except for
the year 1970 and for exports during the whole period. The curious fact
however, is that there was a persistent decline in most of the ~
-indices throughout the years 1964-'69/'70; in the last two years
the indices bounced back slightly, as a result of the big mergers
mentioned before. Taken in conjunction with the c4-index, the
impli-cation seems to be that the two largest firms receded in importance
vis-a-vis numbers three and four.
3.
L-indices for domestic sales exhibited declines after 1966 and 1969. But because of the dairy concentrations, the L-maximum was reached by3 firms instead of two, showing that the largest size discrepancy
occurred between this group of 3 firms and the rest.
4. in general the level of L-indices for exports is lower than for the
other variables. This indicates a more equalized structure of the
exporting firms in the largest group.
5. a final noteworthy point is the sharp decline of the L-indices for
investments in 1970-1971. Apparently, the top firms invested during
these years less than their usual shares, probably because of the big
mergers. It may provide an illustration of the often noted phenomenon
that investment in new assets and investments in take-overs are to some
extent rivalrous.
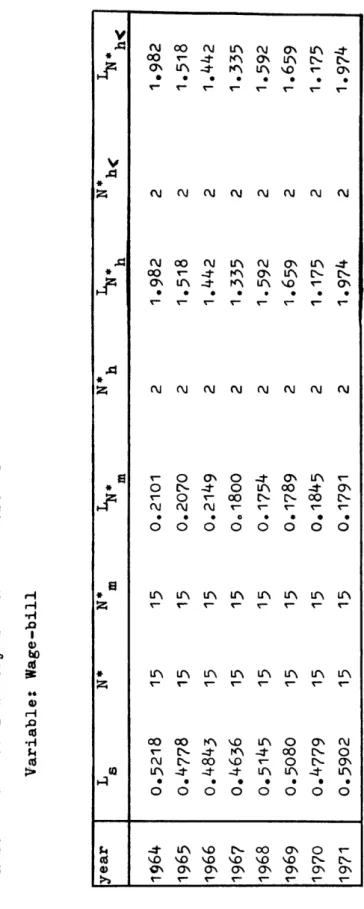
d. Consideration of the tables for the financial indices (tables 15, 16 and
17) adds a few interesting findings and conclusions.
The L-indices for net profits suggest an increasing parity between the
firms belonging to the group of 15 leading firms. This follows from the
decline in the Ls-index between 1965 and 1971, which was fairly pronounced
and from the decline in the LN -index since 196
&
On the other hand the-7-~h-index declined.
For the own-means or owner's equity variable,the levels of the Ls-indices
were low in comparison with those for the net profits.
For the LNh's the same applies, but for the ~h's the differences are
proportionately much less. This means that the differences between LNh and
LN
-indices for the variable own means are much smaller than those for mthe variable net profits, while, moreover, the relative differences seem
to be reduced as the years progress. From these tendencies we draw the
following conclusions (which are supported by a review of the basic
material):
-The profitability per unit of own means for the largest company of the
15
companies considered is considerably higher than for the rest ofthe group.
-Also, the profitability of the four or five leading food firms is
relatively higher than that for the rest of the group.
Throughout the years these differences are accentuated and, moreover,
the profitability of the group as a whole has a tendency to remain
on the same level (with here and there some increases). This is a
deviation from the general industrial trend during the sixties, which
showed a decline in net profitability.
The explanation of these phenomena can probably be given in terms of
the market dominance of the largest firms, which are the leading firms
in each of their sectors of the food industry. In these sectors - which
for the purposes of this report are taken together, but which should in
reality be considered as separate markets - the leading firms have strong
market positions because of:
a. a large market share,
b. one or several strong trademarks, so that their products occupy a
prominent position in distribution channels,
c. cartel agreements, or sales associations which coordinate sales.
Due to these facts, the leading firms make better prices and profits for
their products than the other ones, and this raises their profitability.
If, finally the findings for the real and financial indices are compared,
profit-maxi-mizing behaviour instead of a sales-·maxiprofit-maxi-mizing behaviour.
For, whereas the concentration-indic:es for sales and employees of the
largest companies showed a decline between
1964
and1969/'70,
theirprofitability remained intact.
In the final years
1970
and1971
they made good the relative recessionof sales by means of mergers and take-overs; they were no doubt enabled
Table
6
Concentration coefficients variable: employees numoer ..:J~oeiarcl.ent; other coRcentratl.oR year Concentratiom ratio coefficients firmsdispersion
v
Table
7
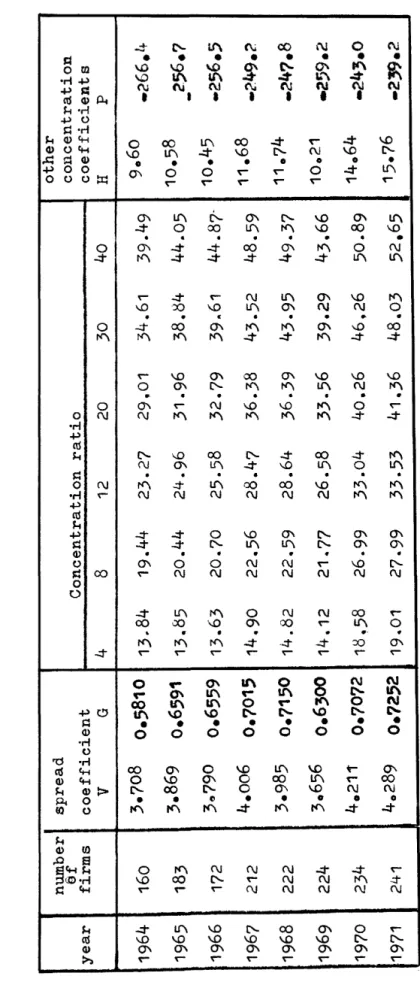
Concentration coefficients variable: domestic sales number spread other Of Concentration ratio coucentration year firms coefficient coefficientsv
G4
8
12
20
30
40
H p1964
160
3.?08
0.5810
13
.. 84
19.44
23.27
29,01
34.61
39.49
9o60
-266.1+1965
183
3.869
o.6591
13.85
20.44
24.96
31.96
38.84
44.05
10.58
256.?
Concentration coefficients Variable : investments Table
9
Other concen-number spread Concentration ratio 'tration coeffi-of coefficient cients year firmsv
G 4 812
20
30
4o•
H1964
42
4.407
o.4932
17.41
24.17
29.40
37.49
44~8050.90
13o30
1965
41
5o128
Oe5525
19.46
26.76
33.17
42-68
51.05
57.32
18.09
1966
41
4o201
o.5080
16.20
23-63
29.50
38.34
46.47
53.03
12o69
1967
39*
3e976
0.5192
15.16
23.29
29.92
40.00
48.70
54.07
11.51
1968
37*
4o508
0.5727
16.54
27.13
34.11
44.13
54.13
59-35
14.84
1969
36•
4.718
Oe5217
18.48
25.75
32.17
41.89
50.27
54.23
16.53
1970
37*
2.897
o.4o56
11.67
19.31
24,21
32.29
39.38
43.05
7.34
1971
47
4.293
o.61)0
18.06
28.14
36.oo
46.72
55-04
60
.. 77
15o41
*) The C-ratio in this column is for the years in which there were available data for less than40
firms, calculated on the basis of the number of firms mentioned in the first column. p-2G0.4
-248~4-257•5
•2.55·9
-245.~ ·251.2•270•2
•237.8
'
Table
10
Processed food exports (see note)value x
1,000,000 u.s.
DollarsBelgium Other
&
year world
E.E.C.
Luxemburg France Germany Italy Countries1964
926.7
500 .. 7
95 .. 6
118 .. 4
220 .. 7
66.o
426 .. 0
1965
1,042.1
611.1 127.4
114.8
285.4
83.5
431.0
1966
1,077. 2
631.5 117.5
108.5
304.5
101.0
445.7
1967
1, 173.8
677.3 122.1
113.1
339.1
103.0
496.5
1968
1,376. 9
855.0 134.1
175-9
428,7
116.3
521.9
1969
1,534. 7
998.8 150.2
219.7
510.8
118.1
535.9
1970
1,881.9 1,272.8 185.0
214.4
694.7
178.7
609.1
1971
2,127.5 1,451.6 195.0
236.6
803.8
216.2
675-9
Source : Statistics of foreign trade 0 E C D
Table 11 Food industry Linda coefficients
Variable : Employees
year Ls
N*
N1n
~·
mN"h
~*h
N1J.(
~!(
1964
0.2192
44
44
0.0754
2
1.622
2
1-622
1965
0.2213
42
42
0.0781
2
1.258
2
1 .. 258
1966
0.2171
41
41
0.0854
2
1 .. 138
2
1 .. 138
1967
0 .. 2206
38
38
0.0963
2
1.026
2
1 .. 026
Variable : domestic sales
~ear Ls
N*
N1n
~·m
N~~~
1964
o ..2330
43
43
0.0745
2
1,565
1965
0.1956
50
50
0 .. 0629
2
1.505
1966
0.1948
48
48
0.0674
2
1.525
1967
0.2010
4o
40
0 .. 0814
2
1.079
1968
0 .. 1932
42
42
0.0763
2
1,102
1969
0.2105
40
40
0.0883
2
1.167
1970
0.1951
44
44
0.0945
3
0 .. 6501
1971
0.1999
45
45
0.0943
20.8412
N*h(
~*h<
2
1.565
2
1,505
2
1.525
2
1 .. 079
2
1.102
2
1,167
3
0.6501
Table 13
Food iadustry Linda coefficients
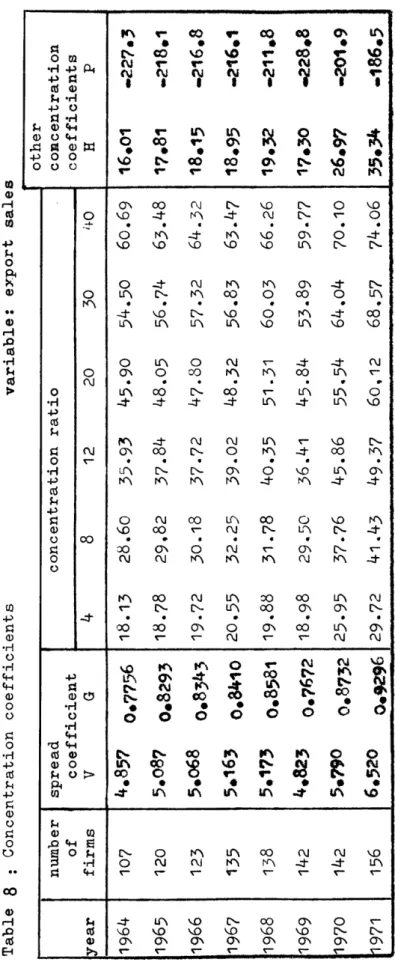
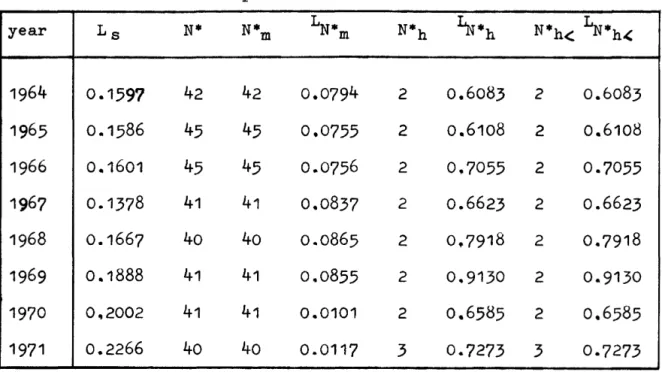
Variable : export sales
year
Ls
N*
N*
mLN*m
N*h
~·h
N*h<
~*h.(
1964
0.1597
42
42
0.0794
2
0.6083
20.6083
1965
0.1586
45
45
0.0755
2
0.6108
2
0.6108
1966
0.1601
45
45
0.0?56
2
0.?055
2
0.7055
1967
0.1378
41
41
0.083?
20.6623
2
0.6623
1968
0.1667
40
40
0 .. 0865
2
0,7918
2
0.7918
1969
0.1888
41
41
0.0855
2
0.9130
2
0.9130
1970
0,2002
41
41
0.0101
2
0.6585
2
0.6585
Variable : investments
year
LN*
N*
~·
N*
~·
N*h<~*h<
6 m m h
h
1964
0.2102
41
41
0-0766
2
0.7938
20.7938
1965
0,2326
40
40
0.0828
3
1.009
3
1 ,.009
1966
o ..
1970
40
4o
0~07252
0.8969
2
0.8969
1967
0.1648
38
38
0.0711
2
0.7618
2
0.7618
1968
0.1836
37
37
0.0743
2
1.048
2
1 .. 048
1969
0.2431
36
36
0,.0861
2
1.166
2
1,.166
1970
0 .. 1459
37
37
0.0723
2
0.5587
2
0 .. 5587
1964
1965
1966
1968
LIST OF MERGERS
Meneba NMU Zwanenburg-Organon Homburg Zwanenburg-Organon Homburg Scholten NMU Albert K Z 0
Meneba
csu
NMU Coveco
K Z 0
Meneba Duyvis
Frico C M C
I T T
I T T
Frico NMU
N C Z
Meneba Heyn
Scholten Honig Cons. Foods Corp.
De Sleutels vh. Koster & Co. Leiden
NV Melkinrichting en flessenmelkfabriek Holland
NV Sterovita melkproducten
NV Uithoornse Bacon en conservenfabriek NV V erapharm
NV van Rooyen Gerrit Bussink
NV Twentse Vlees Ex:port Mi j.
Ant on Hunink California soepen
Fino fabriek
Noury van der Lande NV van Dijk
(Lei den) (Amsterdam) (Amsterdam) (Uithoorn) (Meppel) (Almelo) (Wijhe) (Deventer) (Deventer) (Elburg) NV Kon. Stoomvleeswarenfabriek B. Linthorst en Zn.(Wilp)
Honig (Koog a/d Zaan)
V Z R M I
G. de Meester
Van Vollenhoven's Fabr. Comestibles NV
V.d. Meer & Schoep
consolidation of six sugar cooperatives
NV Dordrechtse Melkinrichting
NV Hollandse Vleescombinatie Groot & Booy
Kon. Zout Ketjen
Sitos NV
Zwervers's Ver. Maatsch. NV Karperton Kaasfabriek
NMU
NV Melkcentrale Amersfoort
NV Roomboterfabriek de Vooruitgang
Groko Cons. en blikfabriek Eubisfa (Rotterdam) (Emmen) (Rotterdam) (Rotterdam) (Dordrecht) (Alkmaar) (Amsterdam) (Rijswijk) (Vlaardingen) (Alkmaar) (Amsterdam) (Amersfoort) (Woudenberg)
Trifax NV (Weesp)
NV Veenendaalse Melkinrichting en zuivelfabriek (Veenendaal)
G 0 C Z (Zutphen)
NV Vermaats Bakkerijen (Haarlem)
Jacob Duyvis (Zaandam)
1970
1971
K Z 0
KZO and AKU together form Imp. Tobacco Ltd.
Meneba Veconi
Wessanen's
s.u.
Zuid Ned. Melkinr.
Cebeco
S.H.V. Nibecom
Domo takes over
Meneba
British United Biscuits Ltd. Camp ina I.T.T.
c.M.c.
Unilever Unilevers.H.v.
General Foods Scholten Honig
Nutricia Frico
Meneba
Duyvis
A.K.z.o. Golden Wonder
Brood Banket Beschuitfabriek Dijkers NV
Ver. Coop. Zuivelfabriek Andi Jan van Heeswijk
Coop. Groenvoederdrogerij
(Zaandam)
(Arnhem)
(Almelo)
(Doetinchem) (Veghel)
Coop. Zuivelver. Zd. Ned. Zuivelbond GA (CZNZ) Coop. Centr.Melkproductenfabriek de Meyerij GA
Coop. Centr.Melkproductenfabriek Bergeijk GA Coop. Zuivelexportver. "Brabant" GA
Kok-Ede NV
P. de Gruyter & Zn.
NV Ex:port sl. De Haas
5 factories of Lyempf
Fano Friet Mayo NV
Drents-Groninger Zuivelbond
NV Lubro
V onk' s Bakk. NV d' Blauwe Molen NV
Fritura Sibema Nobo (Ede) ('sHertogenbosch) (Winterswijk) (Leeuwarden) (Drachten) (Smilde) (As sen) (Utrecht) (Leeuwarden) (Rotterdam)
Coop.Melkverwerkingver."Land van Heusden en Altena"
Zwanenberg's Fabrieken NV Croklaan
Difa Maple Leaf Ave be
Speyer, V.d. Vijver en Zwanenburg
c. c. F.
Amersfoortse Broodfabriek NV
(Oss)
(Wormerveer)
(Dordrecht)
(Etten Leur)
Comments on the list of mergers 1964-1971
1. The main sectors where mergers took place were:
- the meat processing industry
- the dairy industry
- the flour and bakery sectors and the cooperative sugar industry
2. The main companies involved in merger operations were:
- Meneba, (flour and bakeries), taking over both horizontal competitors
like De Sleutels (1964), and effecting vertical integrations, leading
up to a dominant position in bread baking in particular areas (Sitos,
1968, Western Holland).
Scholten-Honig, a varied food concern, which has grown rapidly to a
prominent place by means of take-overs. In the fall of 1973 the firm
was engaged in a battle with the Cooperative Sugar Union over the control
of the only private sugar manufacturer in The Netherlands*. In 1973
Scholten-Honig gained control of the flour and bakery interests of the
Dutch consumer cooperative, which got into financial troubles.
- Many take-overs in the meat sector were effected by Homburg, Unilever,
Nibecom and A. Heyn, the retail chain. Most of these mergers were
horizontal operations, with some diversification intentions. The A. Heyn
take-over of de Meester in·1966 was a vertical backward integration.
- Dairy mergers were probably the most numerous, and were effected mainly
among cooperatives. Most of these mergers and take-overs were on a
regional basis, covering several provinces. The structure of the dairy
industry is rather complicated, with many mutual interests and
cross-participations.
3. Foreign take-overs were restricted both in numbers and size. The main
foreign companies involved were Imperial Tobacco (Gr. Britain), I.T.T. and
General Foods (u.s.A.). These companies penetrated the miscellaneous food
sectors, such as canning, potato chips, biscuits and chewing gums.
In the middle of November 1973, the c.s.u. made known its withdrawal
Report on concentration in the Dutch Fish-canning Industry
!.General Survey
The Dutch fish-canning inrlustry experienced a ~eneral revival after
the second world war, mainly because of food scarcities in the
tropical developing countries. However, since the earlv sixties
the trend was reversed, as a resnl t of several factors.
The industry produced to a lar~e extent cheap mass products, which
are mainly sold in Africa. Producing conntries like Japan and S•Africa
were more and more able to undercut the Dutch industry, while at
the same1 African consumers demanded a qualitatively better product.
So a reorientation became imperative, which several firms could not
mana~e to undertake and they consequently failed.
On the supply side there likewise arose difficulties. The most
important input has been traditionally herring and mackerel. In the
sixties an excess of fishing activities took place in the North Sea
and the North Atlantic, so that suppli~s hecame scarcer and more
distant fishing grounds ha.fi to be explored. Since the middle
sixties supplies of herring declined from over 50,000 tons p.a. to
between 20,000 and 30,000 tons, whereas mackerel supplies fell to
some 10-15,000 tons ( compared to about 25,000 tons in the early
sixtieR). Prices therefore rose appreciably, and though there was
some increase of snpplies of herring at the end of sixties and
early seventies, the industry saw itseJf confronted with a profonnd
reorientation. This was a~gr.avated by the rise in tinplate prices
and the continuing increase in wages and social charges. The cost
increases and the heavy intfftational competition necessitated a
withdrawal from the mass market and a shift towards quality products.
As table 1 indicates, the number of firms fell since 1967 t.o a low of
17 in 1970. During these years a number of the most important firms,
in terms of their ranking in 1964 and 1965, shifted to much lower
places or were forced to terminate their operations altogether.
For example, ftras n1~hered two, three, four,and five in 1~64
(con-cerning employees) had the following positions in 1971: eleven, six,
three and dissapeared. Firm number four, which improved its position
to number three, nevertheless experienced a decline of about
one-quarter in the total of its personnal. Only the top fish-canning firm
On the other hand, the renewed expansion durin~ the later years
I
( 1970 and 1971 ) led to an influx of new companies, among wich
were several lar~er ones. This expansion is also apparent from
domestic sales and export sales, wich reached an absolute low in
resp. 1968/1969 and 1968. The renewed growth since these years
reflects the shifts of sales from the African market to that of
the EoE.r,.-countries. ftahle 2)o The whole of the increase of the
Dutch fish-canning exports between 1965 and 1971 ( $ 3.7 million )
was rlue to E.E.C. sales, wich rose
$
4o0 million. Whereas in 1960,70
%
of canned herrings were sold in African countries anrl only9 ~ in Europe, the shares were totally reverserl in 1967: 22
%
inAfrica and 64
%
in Europe.The structure of the industry has been traditionally one of small
firms, undertakin~ practically no research and selling their products
via established channels of distribution without individual efforts in
sales promotion and advertising. The Dutch ~finistry of A~riculture
and Fisheries has tried repeatedly to stimulate an improvement of
of the branch structure. Jn ]957 funds were marle available to improve
research in order to enhance the quality of the products. Also,
it was tried to improve supplies by means of premiums for adequate
preparation on board of ships. A further step was the financing of
a lar~e melting machine in order to influence the stock position,
but this proved illusory because of the recedintr catchings. A tariff
reduction from 12
%
to 0 or-i
%
was achieved on a quota made avai lab 1 ehy the E.E.C. for herring imported from Scandinavia and destined for
Dutch consumption.
The large shifts which have occurred in the industry are also apparent
from table 3, which trives the supplies of fish to the canning industry
in earlier and later years. It wll be seen that herring supplies
got the heaviest blow, whereas mackerel could retain its position.
On the other hand, conditions for the processing of sea foods, mainly
mussels packed in glass jars,have improved. The firms producing the
mussels in the province of Zeeland and some speciality producers have
tried to,promote brand knowled~e and loyalty with some success.
( " Zeelands Roem" for mussels and " Vico " for haddock liver
p'tl,
are examples). The Zeeland firms are now threatened by the closin~
of the sea arms, so that long-term prospects for the cultivation of
-3-The general tendency by the consuming public to increase its demand
for high qualitv, imported fish products has led to more salmon and
tuna sales, where international brands such as Delmonte, Royal Mail
Imperial, libby's and Princes are well established. There is also
a wide variety of labels and retail prices in the sardine group,
while more expeasive canned seafoods like crab, lobster and shrimps
( imported from the
u.s.A.,
Hongkong and China ) are also doing well.2.Concentration Tendencies
Quantitative studies have been performed with the aid of the variables
employees, domestic sales and exports. Financial data were not
suffi-ciently available for this small-scale industry which is dominated
by small firl'ls ( the largest firm had in 1971 on]v 212 employees and
some Fls 18 million sales ). In fact there are only a handful of firms
with more than 50 employees. Discussions have therefore taken place
onring the past several years whether horizontal mergers and vertical
integration wonld not be something worthwhile.
Both product and packaging research and market research could then
be improved and the position of the Dutch firms could be strengthe·ned
in comparison with for example the larger W-German companies. Stability
in raw material supplies could be achieved by means of long-term
delivery contracts, so that prices and quantities could be fixed
be-tween the supplying and processing sectors.
But not much has come from these proposals. There is only one large
company involved in the fish-canning industry: S.H.V., the Dutch
con~lomerate wich owa one of the larger companies in the trade; this
firm, wich also owns IJvries from Umuirlen, is in t.he deep-freeze sector
of the trade. Unilever of course, is one of the most important
fish-producing firms in Europe. It owns the large Deutsche
Hochsee-fischerei at Rremen, integrated from fish catching to the 270
special fish retailers and R5 fish restaurants in W-Germany. Its
prodncinp.:: business in the Netherlands is much smaller.
Concentration inrlices in table 4, show a marked weakening of
concen-tration in the last two years, after increases during the period up
to 1970, at least for employee& and domestic sales. For exports the
trend was more level, with an exeption as to the last year, The
Herfindahl and Entropy-indices in particular denote the large
Th1.s sudd~n de~l i.n.e in concentrati.on i.R in line ,_~ri th the preYiouR
sketch of thP dev~lopmAnt in the in~u~try: ~A the ol~ estahli~~P~
firm~ faAtly ~ecli.ned i'1 importance ( ~nd even were f"roed to
liquidate ) and some relatively large new ones stepped into t~e
quickly expanding deep-freeze sector of the industry,
con-centration decreased both absolutely and relativelyo Th,e last
tendency ( which was rPther strong ) is to be Aeen from the
Gini- and Variationcoeff:i.cientso
With res!'lf!Ct to the the L-in.dices, we not~ an olie-o-oo1isti.o p-ro,,p
of 6_1? firma, with a.!'! I'l'TJ· betweAn 0.;>5 a-n.~
o.c:;o
f"or nomeRtic' h
Ralqs and exports, and one"belnw
n.?5
for om~1.o!~0Ro T~e i~duRtryhas ther~fore Ataye~ cnm~etitivA, eve~ thou~h the major comnan~es
( N'h ) 1.ncreased their dom5.nanoe with rPsnect to nomestic sales
and ex~orts, es~eciaJJ.y in
1969, 1Q70
~nd 1Q?1. We also note thediscrenancy between the levels of L-indioes of sal~s and employees,
1-.rh:ich may concord with the ex~lanation given :i.n the :precedi. ng
paragrap'b.
Investment data were too spotty tn calculate meaningful ratio's
ano indices. Whatever indications are available s~ern to shov,
however,that the large•t firm in the in~1stry invested heavily
with time intervals of fonr to five years, ano that its averaP"e
5 nvestment record was full~r commensurate with its first place
among other variables. On the other hand, the investments of the
smaller companies were dis~roportionately weako They seem to
have been overwhelmed by the nroblems com:i.ng to the f0re du:r.i.n~
Table: 1 The Fish-canning Industry"
1964 1965 1966 1967 1968 1969 1970 1971
Number of firms 20 23 24 24 20 1~ 17 32
Employees x 1,000 1.1 1.0 1.1 1.0 0.8 0.9 1.2 1.2
Domestic sales 18.P 21.9 25.:1 27.0 21.3 21.4 49.0 59.0
X 1,000,000 Fls
Export se.Jes 22.7 23.7 23.2 25.0 24.7 31.3 36.0 63.0
X 1,000,000 Fls
" Concerning data of firms with more than 10 employees
Table: 3
Sea-fish
of wlticb herrintr
mackerel
Fresh water fish
Mussels
Supplies of fish to the canning industry
( •etric tons)
1963 1964 1969 1970 1971
15,224 15,n41 8,787 6,018 7,235
10,921 10,545 4,001 3,224 3,087
3,227 4,803 3,260 1,723 3,323
81 113 142 109 24
6,991 8,730 13,056 10,686 9,253
Table: 4
v
1964 1.333 1965 1.345 1966 1,477 1967 1,591 1968 1,512 1969 1.801 1970 1-.131 1971 1.387 ConcP.ntration coefficients ~ish-canning Industry variable: Domestic sales Concentration ratio's G 4 8 12 15 H 0,4909 64.02 78.31 83.60 85.76 138.9 0.6210 60.27 84.02 91.78 95.52 122.1 0.6566 66.01 85.77 92.89 95.73 132.5 0.6716 69.26 86.67 92.96 95.13 147.1 0.6473 70.89 88.73 94.37 95.77 164.3 0,7364 77.n7 ~5.33 ~~.53 ~~.73 223.4 0.0147 41.63 52.45 54.08 68.47 134.0 0.5742 46.78 68.31 82.54 88.79 91.4-103.8 -106.3 -103.6 -100.9
Table: 5
v
1964 0.638 1965o.
915 1966 0.902 1967 1.060 1968 0.827 1969 0.964 1970 0.789 1971 lo069 Concentration coefficients Fish-canning Industry variable: Employees Concentration ratio,
8T able;?
L
s
1Q64
Oo6324
1965
o.4861
1966
o.4594
1967
Oo5276
1968
o.6o4o
1969
0.7636
1970
Oo87R3
19?1
0.4732
Linda-coefficients of the Fish-canning Industry
v ariable: domestic sales
N'
N'
r.N,
N'
LN' N'h( LN'm h
m h h(
12
6
0.5036
2Oo7794
2
0.7?94
12
7
0.3326
2
Oo6538
2
0.6538
12
9
0.3704
2Oo6489
2
o.6489
12
9
o.4501
2
Oo?653
20.?653
12
60.4627
2Oo8553
2.
o.8553
12
7
0.5713
3
1.0260
3
1.0260
12
7
0.5436
21.3000
~ 1~}000I.J
s
1964
0.2907
1965
0.2779
1966
Oo3032
1967
0.3443
1968
Oo3485
1969
Oo3768
1970
o.448?
1971
0.4297
Linda-coefficients of the Fish-canning Industry
variable: employees
N'
N.LLN'
N'
LN' N'h< LN'm h
m h h<
12
12
Oo1942
2
Oo5f;??
2
0.5577
12
12
0.1894
2 0~5l.i-3~ 20.5433
12
12
Oo2179
2
o.6o94
2o.6o94
12
12
Oo2510
2
o.62o6
2
o.62o6
12
12
Oo1968
2
Oo?296
2
0.7296
12
12
Oo2381
3
0.6121
3
o.6121
12
12
Oo2567
3
0.7561
3
0.?561
Table: 9
L
s
'1964
o.4435
1965
0.3898
1966
o.4119
1967
Oo3h04
1968
Oe3284
1969
0.3660
1970
Oo5729
1971
0.3473
Linda-coefficients of the Fish-canning Industry
variable: export sales
N' N' LN' N' LN' N' LN'
m h h
m h h
12
5
Oo3212
2
o.6571
2
o.6571
12
6Oo3034
20.5625
20.5625
12
8
Oo3198
2o.68o6
2o.68o6
12
12
0.2830
2
0.7424
2
0.7424
12
10
0.2485
20.5375
20.5375
12
9
0.2672
2
o.6383
2
0.6383
12
7
0.3625
21.0510
2lo0510
Report on Concentration in the Fruit- and Vegetables Processing Industry.
1. General Survey
At the beginning of the seventies the Dutch fruit and vegetables
processing industry consisted of some
90
firms with about110
establishments, having each more than
10
employees. Slightly less isthe number of smaller firms, wich had a share of only
5
%
in totaloutput of the industry. As Table 1 indicates, these numbers have
re-mained relatively stable; only the year
1968 / 69
saw a decline.Production and sales of both processed vegetables and fruits have
increased since
1963 / 64,
but the general increase masks varyingtendencies in the twe main sectors and the methods of processing
were as follows :
Table
1
A:Ve~etables Fruit
1963 1967 1969
1963 1967 1969
Supplies
322.5 325.3 336.1
supplies106
104
130
(million kgs) (million kgs)
of wich (in
%) :
of wich (in%)
sterilized
51
50
54
fruit pulp15
7
3
frozen
14
13
17
fruit juice16
13
13
sauerkraut
13
14
12
canned fruit/jars18
14
13
dried
13
10
8
apple sauce38
45
53
salted
7
10
6
sirup4
4
3
other
2
3
3
frozen5
10
12
other
4
7
3
Expansion was greater in fruit processing than in vegetable processing,
but both sectors showed a quantitative rise. For vegetables, only the
sterilization method and deep freezing increased their shares; in fruit processing all methods declined in importance, except
deep-freezing and apple sauce production. The last sector mentioned is by far the most important, and exhibits similar tendencies as sterilized vegetables, because it is a substitute product. Both types of products
are sold in cans and
I
or glass jars. The share of tinplate andglass-jars in total packaging costs was
71
%
in1964/ 65,
and again71
%
in
1968/69.
But cans are losing terrain: in the earlier year, cansaccounted for
60
%
of packaging costs, in the latter year49
%.
So glass jars doubled their share. The consumer values the sight of his
-2-demand care of the product. The same applies to deep-frozen articles,
where colour and freshness are preserved and consumers have spent
relatively more for these types of products. These two methods of production have their peculiarities : for canned vegetables coats of production,
stacking and transport are relatively low; for glass packaged articles
visibility is good, while some articles (leaf green vegetables such as spinach) lend themselves to deep-freezing methods.
Processing methods are adapted to consumer wishes. Peas and beans are canned, but canned spinach has nearly disappeared, and consumers pay the
higher price for the deep-frozen products wich account for more than 60
%
of frozen vegetables sales. Consumers are satisfied with the traditional
sauerkraut, so that alternative methods of preparing cabbages have no
success.
Growth in the fruit and vegetable processing industry has been fast, but the different sectors have shown successively different rates of
increase. Between 1950 and 1970 the output of sterilized products in-creased more than threefold, but most of this growth took place during
the fifties. Deep-frozen products have grown fast during the sixties though there was some hesitation in the middle sixties. Nevertheless,
the industry as a whole grew by 90
%
between 1963I
64 and 1970I
71 (table 1 ), of wich the vegetables sector had the lion's share.Neither are the structural characteristics uniform. The canning sector
is dominated by small-scale firms, but the deep-freeze sector counts only a few large firms in Europe. The capital intensity is very high:
the capital sales ratio is only slightly over 1 •
The canning sector has practically no brand-loyal customers (Hero products
are an exception in Holland), whereas the deep-freeze products are
heavily advertised, and promoted.
Production costs of canned fruits and vegetables are about equal to those
of deep-frozen articles at the gate of the factory. But the differences afterward are decisive. The stocking in cold storage systeas, the
transport at low temperatures to depots and again to retailers, the retailer'sinstallations and the broad range of products put a high premium on efficient transport and storage, wich promotes vertical
integration. Vertical integration in its turn raises barriers to entry and limits the number of firms. If however the market expands in future
years to much higher levels of per capita consumption, (say 10- 20 kg
in stead of the present
3- 5
kgs) more rooa may be created for additionalfirms.
In the canning sector growth will be less but may nevertheless be posi-tive. Between 1960 and the early seventies per capita consumption rose
to food chains mainly on the basis of delivery contracts : the sale
is made and the canner stores the goods untill he gets a call; the
pro-duction process is not capital intensive, and more and more, the sale
is pushed by the large retailers under their own marks. But new products
continue to make their entry also in this sector. Mushrooms are an
example. This is now the main export product. And new marketing techniques
have appeared. The auctionsare losing out against contract raising,
wich steadies supplies and prices for the processors. On the sales side
the greater demand for convenience goods also gives canners more chances
to continue their growth, if a suitable product is supplied.
Exports and imports have done very well in the fruit and vegetables
processing industry (tab~s 2 and
3).
For vegetables the lines ofexpansion in exports and imports run nearly parallel. Fruit processing
shows a declining import balance since 1966, as the Dutch processors have
improved their market positions in the E E C • Table 3 indicates the
extent : a nearly fourfold increase in E E C sales between 1965 and 1971.
In particular,trade with W.Germany has intensified.
2. Concentration
Growth in the canning industry, competition from deep-frozen products
and from imports and continuing rationalisation have limited the
price-increases for canned fruits and vegetables. Table 1 shows that prices
have risen only 19% during the ten year period 1961 - 1971. This is
a general indication : canned and deep-frozen vegetables prices have hardly
risen since 1964. Because fresh vegetables and foods in general rose
in price during this period, consumption of canned and deep-frozen products
was stimulated (see graph 1). Export prices rose somewhat more, which may
partly reflect an increase in quality, necessary because of the fierce
competition with Belgian and French suppliers for the largest market in
Europe :
w.
Germany (90%
of foreign sales go to other E E C countries, ofwhich the Federal Republic is by far the largest eustoaer).
Some firms did not succeed in keeping abreast of the price and quality
competition or could not sufficiently rationalize their operations. They
have either stopped producing (Tieleman
&
Bros.,Leiden (1953) BeverwijkseConservenfabriek(1965), Hoogenstraten(1969) and some others), or
merged with other companies, often large international firms. For a list
of mergers see Appendix A. Companies like Consolidated Foods, I.T.T.,
Heinz, Unilever, A K Z
o,
and Nutricia are now represented in the Dutchcanning and deep-freeze market. Table 4 gives the largest international
companies in the trade in recent years •
Table 2. Foreign trade in Fruit and Vegetables (processed) value x
1
000
000
fls1964
1965
1966
1967
1968
1969
1970
1971
Vegetables exports81.6
92.1
107.3
121.2
140.3
184.8
221.0
243.4
imports29.5
41.6
50.2
51.7
60.3
75.6
87.2
87.2
balance52.1
50.5
57.2
69.5
8o.o
109.2
133.8
156.2
Fruit exports63.1
66.3
76.4
96.7
111.6
123.5
139.7
171.6
imports76.7
89.5
108.1
121.8
124.0
141.4
159.0
172.5
balance-13.6
-23o2-31.7
-25.1-12.4
-17.9
-19.3
-0.9
Total exports144.7
158.4
183.7
217.9
251.9
308.3
360.8
415.0
imports106.2
131.1
158.2
173.5
184.3
217.0
246.3
259.7
balance38.5
27.3
25.5
44.4
67.6
91.3
114.5
155.3
SourceGraph 1
Coaeumerprice-iRdioea
140
sauerkraut
130
120
1.10
~----
sterilized
100 -
_--..."
"-... _ _ frozen...
..._--1966
Table
4.
Main CompaniesCompany
&
Processor inCountry of origin F
&
V industry1. Unilever
the Netherlands
2.HERO Lenzburg
Switzerland
3.
Nutriciathe Netherlands
De Betuwe Tiel
L.Aardenburg,
Hoogeveen
I G L 0 Utrecht
Hero Conserven
Breda
Preservenbedrijf
Breda
Main Products
jams,sirup,juices,
fruit pulp
deep-freeze production,
ready meals, juices
sales office of
L. Aardenburg
canning,dried soups,juices
jams,drinks,sauces
dried products,frozen,
snacks
Spijer,van der canning,juices,concentrates
Vijver
&
Zwanenburg deep-freeze,pickles,jams,Employees
600
1250
1100
350
Etten-Leur gherkins 750
4.
Consolidated Foods van ~agenberg- canning, jams, juices, gherkinsCorporation U S A
5. ITT Food products US A
6. A K Z 0
the Netherlands
7. H.J .Heinz US A
8.
Ets.Blanchaud FranceFesten
Conserven-febrieken,Heusden
Groko deepfreeze,ready meals
Welco Conserven
Ass en
H.J. Heinz
canning,dried products,
deep-freeze,sauces
canning, juices
Sleutels Conserven canning,meals,sauces,
L.E.Nieuwenhuizen gherkins,lemonades
Leiden (50
%)
9.
Riscona Conserven Riscona, Warffum& Co. W. Germany
canning
540
350
300
?
150
-4-during the sixties. A typical picture of events has been as follows :
Dutch companies of national importance carried out mergers amongst
them-selves, and the group was afterwards taken over by some international
combine. Examples are :
- van Wagenberg Festen Canning Company at Heusden in Brabant which t.QQk
control of Coenen Canning~ the largest mushroom processor in 1969;
later Consolidated Food of Chicago became the 100
%
owner.- Wilco Canning of Aasen was taken over by Duyvis in 1965; in 1969 the
group was merged into the A K Z 0 consumer products division •
- De Betuwe, Tiel, the large Dutch jam producer, Lucas Aardenburg at
Hoogeveen and I G L 0, Utrecht have been taken over by Unilever.
- Spijer and van der Vijver merged and later combined with Zwanenburg,
wich had merged earlier with Vink. The total combination was taken over
by Nutricia in 1972.
The penetration of large, diversified international firms was therefore
a rather general phenomenon, and, though the total number of companies
according to table 1, seems not to have declined, the picture is different
once the various product markets are considered separately. Table 5
summarises the main developments in product markets
Table 5 Concentration in the main product-markets
Number of processing companies share of markets
Postwar
1. Vegetables canning 3 5 of which
20 large
2. Fruit canning
3. Jams
40
4.
Deep-freeze6
5.
MushroomsPresent
20 of which
10 large
15
4
20
held by:
10 large :
Bo
%
10/12 large : 90
%
5
large :75/80
%
3 large : 90
%
mainly small firms•)Source : Estimates from Central Bureau of Horticultural Auctions.
•) two companies belong to international groups : Coenen's Conserven, a
subsidiary of Consolidated Foods, and Nieuwenhuizen, in wich Blanchaud
of Chace, France has a
50
%
interest.Comments on Tables 6 to 13
As many products in the fruit and vegetables processing industry are
substitutes (though processed by various methods) and separate data on the
product markets per company are not available, the concentration measures
to fourty largest companies have been considered for the calculation
of concentration ratios. For the other indices, the values of the smaller companies were approximated by means of linear interpolation. No
financial data were available because of the structure of the industry and in particular because of the influence of the international firms. The main findings are :
1. For sales (both domestic and exports) the level of concentration is
highest, but there is a tendency to decrease throughout the years.
This is especially pronounced for the four largest companies; the
smaller companies within the group of fourty largest do not add to
deconcentration or only to a small extent. It follows that the structure of the group of the largest firms has become more equalized, as is
also apparent from the V and G indices. The mergers carried out by
the "majors" are not foreign to this development.
2. For employees, the decline in concentration on the level of the largest
companies is much less, and beyond the eight-largest firms does not appear at all. This denotes a similar equalization of the structural
composition of the largest companies, and some slight improvement of the position of the group of 40 largest as a whole in comparison
with the other firms. Likewise, the V and G indices have remained constant, whereas Herfindahl and Entropy indices showed declining
concentration to 1968 and then rose again to about their previous
levels.
3.
Comparison of the concentration levels between domestic and exportsales on the one hand and employees on the other may lead to the conclusion that the larger firms are more mechanized, so that their
output and sales per employee are higher than for the medium sized
companies and small firms. Likewise, the greater degree of vertical integration in the larger companies might sustain such an idea. But
this is certainly not the whole (or even the most iaportant)reason for the differences, as the level of investment concentration of the larger companies is equal to, or lower than that of employee or
sales concentration. Another explanation of this difference may therefore be more in accordance with the facts : that the larger
companies have been ~ess successful in penetrating new sub-markets,
where expansion is high and investments per unit of output and sales.
are relatively large. That is why their market shares have declined during the period. In order to counter the increasing competition they have taken over other relatively large firms. In this way their
investments (in wich the sums paid for the companies taken over