Functionally Suboptimal Virus-Specific CD8 T Cell Responses
Vesselin T. Tomov,a* Lisa C. Osborne,b,c* Douglas V. Dolfi,b,cGregory F. Sonnenberg,a,cLaurel A. Monticelli,b,cKathleen Mansfield,b,c Herbert W. Virgin,dDavid Artis,b,cE. John Wherryb,c
Department of Medicine, Division of Gastroenterology, University of Pennsylvania Perelman School of Medicine, Philadelphia, Pennsylvania, USAa
; Department of Microbiology, University of Pennsylvania Perelman School of Medicine, Philadelphia, Pennsylvania, USAb
; Institute for Immunology, University of Pennsylvania Perelman School of Medicine, Philadelphia, Pennsylvania, USAc
; Departments of Pathology and Immunology and Molecular Microbiology, Washington University School of Medicine, St. Louis, Missouri, USAd
Norovirus (NV) gastroenteritis is a major contributor to global morbidity and mortality, yet little is known about immune mechanisms leading to NV control. Previous studies using the murine norovirus (MNV) model have established a key role for T cells in MNV clearance. Despite these advances, important questions remain regarding the magnitude, location, and dynamics of the MNV-specific T cell response. To address these questions, we identified MNV-specific major histocompatibility complex (MHC) class I immunodominant epitopes using an overlapping peptide screen. One of these epitopes (amino acids 519 to 527 of
open reading frame 2 [ORF2519-527]) was highly conserved among all NV genogroups. Using MHC class I peptide tetramers, we
tracked MNV-specific CD8 T cells in lymphoid and mucosal sites during infection with two MNV strains with distinct biological behaviors, the acutely cleared strain CW3 and the persistent strain CR6. Here, we show that enteric MNV infection elicited ro-bust T cell responses primarily in the intestinal mucosa and that MNV-specific CD8 T cells dynamically regulated the expression of surface molecules associated with activation, differentiation, and homing. Furthermore, compared to MNV-CW3 infection, chronic infection with MNV-CR6 resulted in fewer and less-functional CD8 T cells, and this difference was evident as early as
day 8 postinfection. Finally, MNV-specific CD8 T cells were capable of reducing the viral load in persistently infectedRag1ⴚ/ⴚ
mice, suggesting that these cells are a crucial component of NV immunity. Collectively, these data provide fundamental new in-sights into the adaptive immune response to two closely related NV strains with distinct biological behaviors and bring us closer to understanding the correlates of protective antiviral immunity in the intestine.
G
astroenteritis is a major cause of morbidity and mortalityglobally, especially in developing countries (1). Annually, an
estimated 1 billion cases of acute diarrhea occur in children under
the age of 5, causing up to 2.5 million deaths (2). A significant
proportion of these cases are caused by viral pathogens, particu-larly rotaviruses and noroviruses (NV). With the advent of a ro-tavirus vaccine, NV now account for the majority of nonbacterial
gastrointestinal (GI) epidemics worldwide (3–5). In the United
States alone, NV cause an estimated 23 million cases of acute gas-troenteritis, leading to 50,000 hospitalizations and 300 deaths
an-nually (6). In the United Kingdom, NV were the most common
pathogen (36%) in stool specimens from patients with GI infec-tions, while in India and Peru, these viruses were detected in 31% and 15%, respectively, of pediatric patients hospitalized with
gas-troenteritis (7–9). Norovirus outbreaks commonly occur under
crowded conditions, such as in schools, hospitals, nursing homes,
cruise ships, and restaurants (10, 11). The symptoms typically
resolve within 48 to 72 h and are limited to abdominal pain, nau-sea, vomiting, and diarrhea, although life-threatening dehydra-tion can be fatal among infants or malnourished or elderly pa-tients. Despite the significant global burden of NV illness, currently there is no effective vaccine.
Noroviruses are 23-nanometer, nonenveloped, positive-strand RNA viruses whose 7- to 8-kbp genomes encode three or four open reading frames (ORFs). ORF1 encodes a nonstructural polyprotein that is processed posttranslationally by the viral pro-tease; ORF2 encodes the capsid protein, the major structural com-ponent, which also mediates viral entry into target cells; ORF3 encodes a small basic protein that is associated with virions and is
required for capsid assembly (12); and ORF4, which is highly
con-served, was recently shown to play a role in murine norovirus
pathogenesis (13). Despite the relatively brief duration of
symp-tomatic NV illness, it is becoming increasingly clear that viral shedding can continue for weeks to months in immunocompetent
individuals (14–18) and even for years in immunosuppressed
pa-tients (19–22). The immunologic and virologic basis for NV
per-sistence, however, remains unknown.
Until recently, studies of immune responses to NV infection were hampered by the lack of cell culture systems or small-animal models. Field work and studies in human volunteers using live virus or nonreplicating virus-like particles (VLP) have docu-mented IgG and IgA responses, although their role in the control of infection remains controversial. Early studies seemed to sup-port the existence of short-term but not long-term immunity to
NV infection (23) and even suggested a positive correlation
be-tween robust humoral responses and the development of clinical
symptoms (24–27). In contrast, field studies in developing
coun-tries have shown protection from disease in children with high
Received10 December 2012Accepted5 April 2013 Published ahead of print17 April 2013
Address correspondence to E. John Wherry, [email protected] or David Artis, [email protected].
* V.T.T. and L.C.O. contributed equally to this work.
Copyright © 2013, American Society for Microbiology. All Rights Reserved. doi:10.1128/JVI.03389-12
on November 7, 2019 by guest
http://jvi.asm.org/
anti-NV titers (28, 29), and more-recent data in humans and chimpanzees infected with NV have demonstrated antibody-me-diated neutralization and protection after rechallenge with the
same strain (30,31).
Three lines of evidence may help explain the conflicting results regarding the role of humoral immunity in NV clearance. First, noroviruses bind to histo-blood group antigens (HBGAs) ex-pressed on host cell surfaces, with different NV strains exhibiting different HBGA binding affinities. Thus, HBGAs constitute
genet-ically determined host susceptibility factors (32–37). This finding
likely accounts for the observation that certain volunteers, previ-ously assumed to clear infection rapidly, remain asymptomatic despite an absence of antibody responses. Second, similar to other RNA viruses, NV are highly diverse and evolve rapidly, and genetic
shifts have been associated with severe outbreaks (10). In line with
these observations, repeat NV infections are common throughout adult life despite seroprevalence against NV approaching 100% by
age 9 or 10 (38–40) and, to date, no study has demonstrated
cross-protective humoral immunity against challenge with heterolo-gous norovirus strains. Third, it is clear that, in addition to hu-moral immunity, both CD4 and CD8 T cell responses are involved in NV control, although the relative contributions of B and T cells
to the adaptive immune response remain unclear (41–43). For
example, in a recent vaccine trial using inactive VLPs, the antibody responses were highly variable and, even when robust, did not consistently provide protection against rechallenge with the same strain, suggesting that humoral responses may not be sufficient to
confer immunity to repeat NV infection (44). Furthermore,
chronic symptomatic NV infections in immunocompromised pa-tients with decreased lymphocyte counts and normal immuno-globulin levels have been reported, consistent with a critical role
for T cells in NV control (18,20,45).
A major development in the field of norovirus research has been the discovery of murine noroviruses (MNV), a new geno-group of natural enteric mouse pathogens capable of growth in
tissue culture (46). This new model for NV infection has allowed
the use of animal studies to dissect viral pathogenesis and immu-nity. To date, the MNV system has established a key role for innate immunity in MNV control by showing that infection is lethal in mice deficient in type I and II interferon (IFN) signaling or
STAT1, whileMda5⫺/⫺mice have higher viral loads but survive
(47,48). In addition, mouse studies have shown that adaptive
immune responses are also critical for MNV control. Thus,
Rag1⫺/⫺mice fail to clear MNV-CW3, while immunocompetent
mice clear this same strain within 7 days. In addition, selective depletion of CD4 T cells, CD8 T cells, or B cells from wild-type mice impairs MNV clearance and leads to higher viral titers in the
intestine and mesenteric lymph nodes (MLN) (49,50).
Further-more, adoptive transfer of splenocytes from MNV immune wild-type mice was sufficient to clear the same strain from chronically
infectedRag1⫺/⫺recipients (49). Collectively, these studies
estab-lish that B and T cells are important for MNV clearance, although the relative contributions of virus-specific memory and effector subsets of the adaptive immune response remain incompletely understood.
An added advantage to the MNV system is the availability of multiple MNV strains with distinct biological behaviors. Specifi-cally, with regard to persistence, both acute (MNV-CW3) and
chronic (MNV-CR6) strains have been described (51,52). While
MNV-CW3 is cleared within 7 to 10 days from the intestine of
immunocompetent mice, the CR6 strain persists for at least
sev-eral weeks (51). We took advantage of this natural diversity of
MNV strains to test the hypothesis that acute and chronic MNV infections are associated with quantitative and/or qualitative dif-ferences in the virus-specific CD8 T cell response. To this end, we identified an immunodominant and highly conserved major histocompatibility complex (MHC) class I-restricted epitope
in the viral capsid (referred to hereafter as P1519[a 9-residue
sequence beginning at position 519 of the P1 subunit of cap-sid]) and used MHC class I peptide tetramers to define and
track P1519-specific CD8 T cells during CW3 and CR6
infec-tion. We show here that oral infection with MNV resulted in robust T cell responses in the intestine and that MNV-specific CD8 T cells dynamically regulated the expression of a number of surface markers associated with activation, differentiation, and homing. Furthermore, both the magnitude and function-ality of the CD8 T cell response elicited by MNV-CR6 were reduced compared to the response to MNV-CW3. Finally, we show that MNV-specific CD8 T cells were capable of decreasing
the tissue burdens of MNV in chronically infected Rag1⫺/⫺
mice. These studies will provide new avenues for understand-ing acute and persistent mucosal infections and could guide the future development of effective NV vaccines.
MATERIALS AND METHODS
Viral stocks and plaque assay. Plasmids containing virion strains MNV-1.CW3 (GenBank accession numberEF014462) and MNV-1.CR6 (GenBank accession number EU004676) were used to generate viral stocks as previously described (52). Briefly, all cell lines were maintained at 37°C and 5% CO2in RPMI 1640 (Corning-Cellgro, Corning, NY) con-taining 10% fetal bovine serum, 2 mML-glutamine, 100 IU/ml penicillin, and 100g/ml streptomycin (RPMI-CTCM). Concentrated viral stocks were produced by transfecting 293T cells (ATCC, Manassas, VA) using FuGENE-HD reagent (Promega, Madison, WI) according to the manu-facturer’s protocol (with a FuGENE/DNA ratio of 5:2). After 48 h, trans-fected 293T cells were lysed by freezing and thawing, cellular debris was removed by centrifugation (10 min at 3,000⫻gand 4°C), and the super-natant was transferred onto RAW 264.7 cells (ATCC, Manassas, VA) that had been plated at 2⫻106cells/well in 6-well plates 24 h earlier. After 48 h, RAW 264.7 cells were freeze-thawed and the supernatant was purified from the cellular debris as described above.
Mice and infections.Wild-type C57BL/6 andRag1⫺/⫺female mice,
age 6 to 8 weeks, were obtained from Jackson Laboratory, Bar Harbor, ME. Mice from Jackson Laboratory are MNV free, and this was indepen-dently confirmed by plaque assay, serology, and quantitative PCR (qPCR). Mice were maintained in our facility in designated cages, and their bedding, food, and water were changed separately from other cages in order to maintain naive controls MNV free. Intravenous (i.v.) and oral (p.o.) infections were carried out by tail vein injection and oral gavage, respectively, using a maximum volume of 300l per mouse containing a specified viral infectious dose. All mice were used in accordance with Institutional Animal Care and Use Committee guidelines for the Univer-sity of Pennsylvania.
Tissue processing and lymphocyte isolation for flow cytometry.
Spleens, mesenteric lymph nodes, and Peyer’s patches were harvested in 2 ml of cold (4°C) sterile cell culture medium and homogenized through 70-m cell strainers. In the case of spleens, red blood cells were lysed with ammonium-chloride-potassium (ACK) lysing buffer (Life Technologies, Grand Island, NY) for 2 min and washed in cell culture medium. Small intestines were dissected free of fat and Peyer’s patches, cut open longitu-dinally, washed clean of fecal material in phosphate-buffered saline (PBS), and placed in 10 ml of cold cell culture medium. To remove epithelial cells, intestines were incubated in stripping buffer (PBS containing 5 mM
on November 7, 2019 by guest
http://jvi.asm.org/
EDTA, 1 mM dithiothreitol, 5% fetal bovine serum, 100 IU/ml penicillin, and 100g/ml streptomycin) and shaken at 160 rpm for 10 min at 37°C. After the supernatant was discarded, intestines were incubated again in stripping buffer and shaken at 160 rpm for 20 min at 37°C. The superna-tant, containing intestinal epithelial cells (IEL), was passed through a 70-m cell strainer, washed in cell culture medium, resuspended in cell culture medium containing 40% Percol, and subjected to centrifugation at 600⫻gat room temperature for 20 min (without break). Following centrifugation, the supernatant was carefully removed and the cell pellets were washed in cell culture medium. After IEL stripping, lamina propria lymphocytes (LPL) were isolated by incubating intestines in cell culture medium containing 0.5 mg/ml collagenase-dispase (Roche Diagnostics, Indianapolis, IN) and 20g/ml DNase I (Sigma-Aldrich, St. Louis, MO) for 20 min at 37°C with shaking at 160 rpm. LPL were passed through a 70-m cell strainer, washed, and centrifuged in 40% Percol as described above.
In vitrostimulation and flow cytometry.Equal numbers of cells (106) were plated in duplicate in separate flat-bottom 96-well plates in RPMI-CTCM. One plate was used for surface staining with tetramer and the antibodies indicated below; the second plate was used for stimulation assays followed by intracellular staining (ICS). For ICS, GolgiStop and GolgiPlug (BD Biosciences, San Diego, CA) and 0.4g/ml of peptide or phorbol myristate acetate (PMA)-ionomycin (5 ng/ml and 500 ng/ml, respectively) were added and plates were incubated at 37°C and 5% CO2 for 5 h. Cells were fixed and permeabilized using the Cytofix/Cytoperm kit (BD Biosciences, San Diego, CA) according to the manufacturer’s proto-col. MHC class I peptide tetramers were prepared as previously described (53). The following antibodies were used for ICS and surface stains. From eBioscience, San Diego, CA, CD4-eFluor 605 antibody (clone GK1.5), CD44-eFluor 780 antibody (clone IM7), and CD49d-fluorescein isothio-cyanate (FITC) antibody (clone R1-2). From Biolegend, San Diego, CA, Ly6c-Alexa Fluor 700 antibody (clone RB6-8C5), CD11a-phycoerythrin (PE) antibody (clone 101008), CD103-Pacific blue antibody (clone 2E7), PD-1–PE–Cy7 antibody (clone RMP1-30), and tumor necrosis factor al-pha (TNF-␣)-Pacific blue antibody (clone MP6-XT22). From Abcam, Cambridge, MA, CD8-PE-Texas red antibody (clone 53-6.7). From BD Pharmingen, San Diego, CA, gamma interferon (IFN-␥)-Alexa Fluor 700 antibody (clone XMG1.2). From R&D Systems, Minneapolis, MN, MIP-1␣–allophycocyanin (APC) antibody (clone 39624). From Invitrogen, Carlsbad, CA, granzyme B (GZM-B)–PE antibody (clone GB11). Cells were analyzed on an LSR II flow cytometer (BD Immunocytometry Sys-tems, San Jose, CA). Data analysis was performed using FlowJo (version 7.6.4) software (TreeStar, San Carlos, CA). Dead cells were removed by gating on a LIVE/DEAD aqua kit (Invitrogen, Carlsbad, CA) versus for-ward scatter (FSC-H).
Peptide library screen.A library consisting of 292 18-amino-acid-long peptides, overlapping by 9 amino acids and spanning the MNV-CR6 proteome, was synthesized by GenScript (Piscataway, NJ). All peptides were initially resuspended in dimethyl sulfoxide (DMSO) at a concentra-tion of 40 mg/ml. The library was screened 64 peptides at a time. For a given screen, the 64 peptides were distributed into 12 pools with 16 pep-tides per pool according to the matrix shown inFigure 2B(so that each of the 64 peptides was represented in 3 different overlapping pools). Peptide pools were used forin vitrostimulation of splenocytes, followed by ICS and flow cytometry as described above.
Viral quantification.Viral titers were determined by plaque assay as follows. RAW 264.7 cells were plated at a density of 2⫻106cells per well in 6-well plates. Twenty-four hours later, the medium was removed and replaced with 0.5 ml per well of serially diluted virus-containing superna-tant. The plates were placed on a rocker at room temperature for 1 h. The virus-containing medium was then removed and replaced with 2 ml/well of overlay medium (RPMI 1640 containing 10 mg/ml methylcellulose, 5% fetal bovine serum, 2 mML-glutamine, 100 IU/ml penicillin, and 100 g/ml streptomycin), and the plates were incubated for 48 to 72 h. Plaques were visualized and counted after removing the overlay medium,
washing the cells with PBS, fixing with 20% ethanol containing 0.1% crystal violet for 1 h at room temperature on a rocker, and washing with water.
For qPCR assays, fecal pellets or tissue samples were weighed, frozen, and stored at⫺80°C. Tissues were homogenized using steel beads and a TissueLyser II (Qiagen, Valencia, CA). RNA was extracted using the RNeasy kit (Qiagen, Valencia, CA) according to the manufacturer’s in-structions. cDNA was prepared from RNA samples using a high-capacity cDNA reverse transcription kit (Applied Biosystems, Carlsbad, CA) ac-cording to the manufacturer’s instructions, with the following amplifica-tion settings: 10 min at 25°C, 120 min at 37°C, and 5 min at 85°C for one cycle. For TaqMan qPCR, the forward and reverse primers used were CA CGCCACCGATCTGTTGTG and GCGCTGCGCCATCACTC, respec-tively. The MNV probe was CGCTTTGGAACAATG. qPCRs were carried out using TaqMan universal PCR master mix (Applied Biosystems, Carls-bad, CA) in 10-l reaction mixture volumes according to the manufac-turer’s instructions, with the following amplification settings: 15 s at 95°C and 1 min at 60°C for 40 cycles. All samples were assessed in triplicate, and the results were standardized to total RNA per sample.
Lymphocyte adoptive transfer.CD8 T cells from the spleen were pu-rified by negative selection using magnetically activated cell sorting beads (Invitrogen, Carlsbad, CA) according to the manufacturer’s instructions. Tetramer sorts were performed on an Aria II instrument (BD Immuno-cytometry Systems, San Jose, CA) by gating on live, CD8⫹, CD44HI, tetramer⫹cells, and a purity check confirmed successful sorting (⬎95% purity). Cells were maintained strictly at 4°C for the entire sorting proce-dure. Sorted cells were transferred intravenously into recipient mice.
Phylogenetic analysis.Ninety NV sequences representing all known genogroups were obtained from GenBank. The evolutionary history was inferred using the neighbor-joining method (54). The evolutionary dis-tances were computed using the Kimura 2-parameter method (55). All positions containing gaps and missing data were eliminated. There were a total of 228 positions in the final data set. Evolutionary analyses were conducted in MEGA5 (56).
MHC class I peptide binding prediction.The Immune Epitope Data-base (IEDB) Analysis Resource (http://tools.immuneepitope.org/main/) (57) was used to predict the binding affinities of peptides for mouse and human MHC class I molecules. This method uses a number of known prediction algorithms to estimate 50% inhibitory concentrations (IC50s) in nM, with IC50of⬍50 nM considered high affinity. When multiple prediction methods are used, the results are collapsed into a single per-centile ranking. Logos representing consensus epitope motifs were gener-ated using WebLogo (http://weblogo.berkeley.edu/logo.cgi) (58).
RESULTS
Oral MNV infection induces T cell responses at mucosal sites.
Previous work has shown that CD4 and CD8 T cells are required
for MNV clearance (49); however, the magnitude and timing of
the cellular immune response to the virus is unknown. To begin to address this issue, we used p.o. inoculation to infect mice with MNV-CR6, a strain that establishes persistent infection in
wild-type mice (52). On day 8 postinfection, lamina propria
lympho-cytes (LPL) of the small intestine were stimulated with
PMA-iono-mycin in vitro and cytokine production was assessed by flow
cytometry. As shown by the results inFigure 1A, compared to
naive controls, MNV infection induced populations of IFN-␥
-producing CD4 and CD8 T cells in the LP. We also examined T cell responses in other gut-associated lymphoid tissues, including mesenteric lymph nodes (MLN) and Peyer’s patches (PP), as well as systemic responses in the spleen. In contrast to the LP, T cell
activation in all nonmucosal sites was significantly weaker (Fig. 1B
andC; also data not shown). Thus, at day 8 following oral
infec-tion with MNV-CR6, IFN-␥-positive CD4 and CD8 T cells were
detected mainly in the intestinal mucosa.
on November 7, 2019 by guest
http://jvi.asm.org/
Identification of an immunodominant MNV-specific CD8 T
cell epitope.The above-described results are consistent with an
important role for mucosal T cell responses in natural MNV in-fection. To better define this adaptive immune response, we con-ducted a screen to identify virus-specific CD8 T cells. We used a peptide library consisting of 292 18-amino-acid-long peptides, overlapping by 9 amino acids and spanning ORF1 to -4 of MNV-CR6. These peptides were used to screen for MHC class I-re-stricted epitopes, based on their ability to elicit cytokine
produc-tion (IFN-␥and TNF-␣) by antigen-specific CD8 T cells.
The data shown inFigure 1indicate that mucosal infection
with MNV results in T cell activation primarily in the intestine. However, for the purposes of a large-scale peptide screen, isolating large numbers of viable LPL was technically infeasible. It has pre-viously been reported that, although it is a natural enteric patho-gen, MNV is capable of initiating infection by intracerebral,
intra-nasal, and intraperitoneal routes (47). We hypothesized that
MNV-CR6 might also be capable of establishing infection via i.v. inoculation and that this might lead to a systemic immune re-sponse, allowing us to isolate and assay large numbers of T cells from the spleen. To test this possibility, we infected mice i.v. with
MNV-CR6 and used flow cytometry to detect IFN-␥production
by T lymphocytes from the spleen (SPL) afterin vitrostimulation
with PMA-ionomycin. As shown by the results inFigure 2A, CD8
T cell activation could be detected in the spleens of infected mice on day 8 following i.v. infection. Although the magnitude of the splenic lymphocyte response was small, it was consistent and re-producible over multiple experiments (data not shown). Thus, i.v. infection with the mucosal pathogen MNV-CR6 results in acti-vated T lymphocytes in the spleen, allowing the use of splenocytes for epitope identification.
To identify MHC class I epitopes, we divided our peptide li-brary into a 3-dimensional (3-D) matrix of 12 overlapping peptide
pools (Fig. 2B; also see Materials and Methods). Following i.v.
infection with MNV-CR6, splenocytes were isolated and stimu-lated with peptide pools, and the production of cytokines was assessed by flow cytometry. An example of a 12-pool screen is
shown inFigure 2C. The peptide candidates identified were
fur-ther analyzed using the IEDB and were assigned a percentile rank
based on their predicted IC50binding of Kbor Dbmolecules (57).
Of the 28 peptides initially identified, 11 received a percentile score
of⬍1 and were further tested. As shown by the results inFigure 2D,
one of the 11 candidate peptides that were individually tested, ORF2514-531(amino acids 514 to 531 of ORF2), resulted in robust
CD8 T cell responses as measured by IFN-␥and TNF-␣production.
Several other subdominant MHC class I epitopes were also identified
(Fig. 2D).
Characterization of the minimal immunodominant epitope
in peptide ORF2514-531. The 18-amino-acid-long peptide
(ORF2514-531) identified in our screen (Fig. 2D) was derived from
the C terminus of the P1 subunit of capsid. Based on IEDB anal-ysis, a 9-residue sequence beginning at position 519 within this
peptide was predicted to be an immunodominant H-2Kbepitope
(referred to herein as epitope P1519) (Fig. 3A). An examination of
multiple known MNV strains showed that P1519is highly
con-served, with variation only at position 7 (corresponding to
posi-tion 525 in ORF2) between tyrosine (Y) or phenylalanine (F) (Fig.
4andTable 1). We compared the two versions of epitope P1519to
the consensus motif for H-2Kb (Fig. 3B). An aliphatic residue
(Leu) in the C-terminal position 9 and an aromatic residue (Phe
or Tyr) at position 7 likely act as the anchors, although H-2Kb
anchor residues are classically separated by two amino acids (Fig.
3B) (59,60). Given the noncanonical arrangement of P1519, we
wanted to confirm that this 9-amino-acid peptide was capable of stimulating CD8 T cell responses and determine whether the dif-ferential usage of an aromatic residue at position 7 (F versus Y) affected T cell activation. Therefore, two strains of MNV were
used that differ at position ORF2525, strain MNV-CR6 (ORF2525F)
and strain MNV-CW3 (ORF2525Y). Eight days following i.v.
infec-tion with MNV-CR6 or MNV-CW3, splenocytes were isolated
and stimulatedin vitrowith the original 18-amino-acid-long
pep-tide or either of two 9-amino-acid derivatives (P1519For P1519Y)
(Fig. 3C). Stimulation with any of the three peptides induced
cy-tokine production, although more-robust responses were noted when the epitope sequence matched the infecting strain of virus. Furthermore, in the case of CR6 infection, stimulation with the 18-mer resulted in a level of stimulation comparable to that of the
predicted 9-amino-acid epitope, consistent with P1519 being
the minimal MHC I binding sequence within ORF1514-531. Based
on these data, two separate MHC class I tetramers (Kb-P1519Fand
FIG 1Oral MNV infection induces T cell responses at mucosal sites. Mice were infected p.o. with 104PFU of MNV-CR6 or mock infected with culture medium. At day 8 p.i., lymphocytes from the intestinal lamina propria (LPL) (A), mesenteric lymph nodes (MLN) (B), and spleen (C) were isolated and stimulatedin vitro
with PMA-ionomycin in the presence of GolgiStop. IFN-␥production was assessed by flow cytometry after gating on live CD4 and CD8 lymphocytes. Data are representative of 3 to 5 mice, and each experiment was repeated at least twice.
on November 7, 2019 by guest
http://jvi.asm.org/
[image:4.585.114.476.65.218.2]FIG 2Identification of MNV-elicited immunodominant CD8 T cell epitopes. (A) Mice were infected i.v. (IV) with 104PFU of MNV-CR6 or mock infected with culture medium. At day 8 p.i., lymphocytes from the spleen were isolated and stimulatedin vitrowith PMA-ionomycin in the presence of GolgiStop and GolgiPlug. IFN-␥production was assessed by flow cytometry after gating on live CD8 lymphocytes. (B) A peptide library consisting of 292 18-amino-acid-long peptides, overlapping by 9 amino acids and spanning ORF1 to -4 of MNV-CR6, was used to screen for MHC class I-restricted epitopes. Sixty-four peptides were screened per experiment. Peptides were grouped into 12 overlapping pools, each containing 16 peptides as shown. This resulted in a 3-D matrix where each peptide was represented in 3 separate pools. In the example shown, peptide 41 represents the intersection of pools 3, 5, and 11. (C) Mice were infected i.v. with 104PFU of MNV-CR6 or mock infected with culture medium. Splenocytes were isolated at day 8 to 14 postinfection and stimulatedin vitrowith peptide pools 1 to 12 in the presence of GolgiStop and GolgiPlug. Cytokine production by CD4 and CD8 T cells was analyzed by flow cytometry. In the representative experiment whose results are shown (gated on live CD8 lymphocytes), responses above the baseline were elicited by pools 3, 5, and 11, corresponding to peptide 41 as shown in panel B. (D) Eleven candidate peptides were identified in the screen and were tested individually. The starting amino acid (AA) position and ORF for each 18-amino-acid peptide are shown. Data are representative of 3 to 5 mice and at least 2 independent experiments. Horizontal lines show the means. *, significant difference from unstimulated control by unpairedttest atP⬍0.05.
on November 7, 2019 by guest
http://jvi.asm.org/
[image:5.585.136.447.62.615.2]Kb-P1519Y) were synthesized using 9-mers derived from MNV-CR6 and MNV-CW3.
Epitope P1519is highly conserved among all norovirus
geno-groups.We next examined whether a sequence homologous to
epitope P1519might be present in noroviruses that infect other
species, including humans. Based on capsid sequence analysis, noroviruses have been divided into 5 genogroups, with human strains occupying groups I and II and murine viruses in group V
(61,62). Genogroups I and II, in turn, are subdivided into 14 and
17 subtypes, respectively. We picked NV strains representing all genogroups and subtypes and constructed a phylogenetic tree to
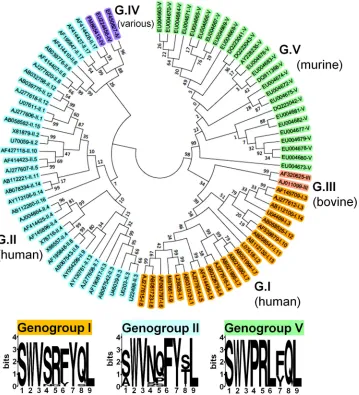
examine diversity in ORF2, which contains P1519(Fig. 4).
Consis-tent with previous phylogenetic studies, our analysis
demon-strated that noroviruses are a highly heterogeneous family (61).
Strikingly, an alignment of the P1 sequence of all species from our phylogenetic analysis revealed the presence of a sequence
homol-ogous to epitope P1519in all five genogroups, including human
noroviruses (Fig. 4andTable 1). Within GI and GII, four of the
nine residues, including the putative anchor residues, were com-pletely conserved among all human norovirus strains examined (positions 2, 3, 7, and 9), and an even higher degree of
conserva-tion was observed within individual human genogroups (Table 1).
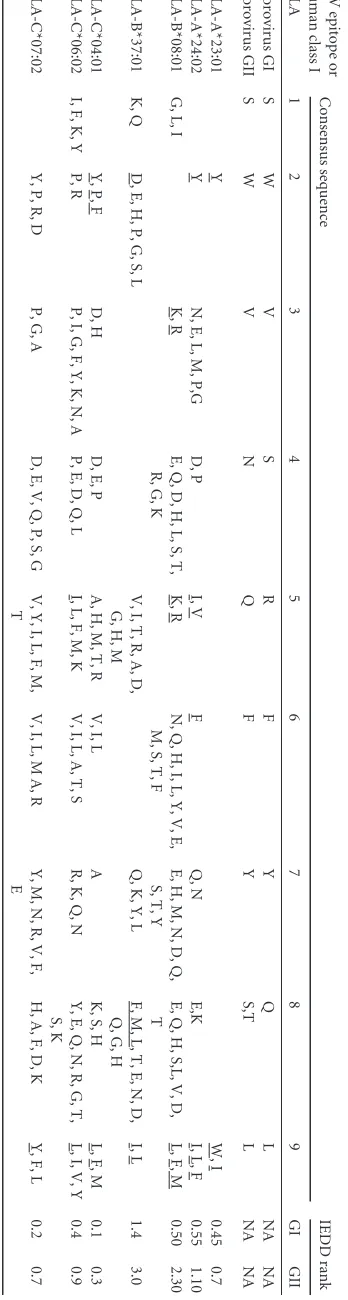
We used the IEDB Analysis Resource to predict the affinities of
common human HLAs for the P1519epitopes from genogroups I
and II.Table 2summarizes the results of this query for HLAs that
received a percentile rank score of⬍1.5, as well as showing the
consensus binding motifs for each of these molecules. Most HLAs
shown inTable 2have a Leu (or other aliphatic amino acid) in the
C-terminal anchor position. A Tyr at position 2 often serves as the
second anchor point; however, in epitope P1519, this position is
occupied by Trp, another aromatic residue. Collectively, these
computational and phylogenetic analyses suggest that the P1519
epitope is conserved across multiple NV genogroups. Combined with the immunogenicity of this epitope in the murine model, these findings provide a potential target for future vaccination strategies aimed at eliciting a strong cellular immune response. FIG 3Characterization of the minimal immunodominant epitope in peptide ORF2514-531. (A) Within the 18-amino-acid peptide identified in the epitope screen, a 9-residue sequence, P1519, is predicted to constitute an MHC class I epitope. P1519differs by a single residue among MNV strains. The binding affinities of P1519Fand P1519Yfor H-2Kband H-2Dbwere calculated using the Immune Epitope Database (IEDB) analysis resource tool (http://tools.immuneepitope.org
/analyze/html/mhc_binding.html). *, IEDB Percentile Rank: in this analysis, a number of available MHC class I binding prediction methods are used to calculate the binding affinity of a peptide to a given MHC molecule. The output is given in units of IC50nM, where lower numbers indicate higher binding affinity. When multiple prediction methods are used for a given peptide-MHC pair, the results are collapsed into a single consensus percentile ranking. (B) Comparison of the P1519Fand P1519Ysequences to the consensus binding motif for H-2Kb(59). Highlighted positions indicate anchor residues. (C) Mice were infected i.v. with 1.5⫻ 106PFU of MNV-CR6 (containing epitope P1519F) or MNV-CW3 (containing P1519Y). Splenocytes from naive and infected animals were harvested 8 days p.i. and stimulated with each indicated peptide in the presence of GolgiStop and GolgiPlug. Cytokine expression was analyzed by flow cytometry. Gated on live CD8 lymphocytes. Data are representative of 5 mice and at least 2 independent experiments.
on November 7, 2019 by guest
http://jvi.asm.org/
[image:6.585.113.475.65.410.2]Robust epitope P1519-specific T cell responses following
MNV infection.To determine whether P1519-specific CD8 T cells
were generated in the setting of physiological enteric infection, mice were infected p.o. with MNV-CR6 or MNV-CW3.
Consis-tent with previous data (51,52), strain CR6 established persistent
infection in immunocompetent mice, while CW3 was cleared by
day 7 p.i. (Fig. 5A). On days 8, 15, and 29 p.i., LPL, intraepithelial
lymphocytes (IEL), MLN, and SPL were isolated and analyzed by
flow cytometry using tetramer staining (Fig. 5B). Note that for
these analyses, we used the Kb-P1519tetramer matched to the
se-quence of the virus (i.e., Kb-P1519Yand Kb-P1519Ffor MNV-CW3
and MNV-CR6, respectively). Consistent with data from the
ex-periments whose results are shown inFigure 1, the P1519CD8 T
cell response was most robust in the intestine (Fig. 5B). This
ob-servation was particularly striking in the case of MNV-CW3,
where up to 30% of CD8 LPLs were specific for P1519Y(Fig. 5C). In
contrast, while the responses to MNV-CR6 were also most pro-nounced in the LP, the magnitude of the responses were 3- to
4-fold lower than observed for MNV-CW3 (Fig. 5CandD). Of
note, the absolute numbers of LPL and IEL were not significantly different between naive mice and mice infected with either MNV strain (data not shown).
In the case of MNV-CW3, time course analysis of Kb-P1519Y
staining revealed a classic kinetic response curve, with expansion, contraction, and maintenance of antigen-specific CD8 T cells in the lamina propria. In contrast, infection with MNV-CR6 resulted FIG 4Epitope P1519is highly conserved among all Norovirus genogroups. We constructed a phylogenetic tree containing members of all genogroups and genotypes (GenBank accession numbers are indicated). The evolutionary history was inferred using the neighbor-joining method (54). The optimal tree with the sum of branch length of 5.06925373 is shown. The tree is drawn to scale, with branch lengths in the same units as those of the evolutionary distances used to infer the phylogenetic tree. The evolutionary distances were computed using the Kimura 2-parameter method (55) and are in units of the number of base substitutions per site. The analysis involved 90 nucleotide sequences. All positions containing gaps and missing data were eliminated. There were a total of 228 positions in the final data set. Evolutionary analyses were conducted in MEGA5 (56). A sequence homologous to the P1519epitope identified in this study was present in the C terminus of capsids from all sequences analyzed (seeTable 1for the precise epitope motif of each clone shown here). The 9-amino-acid consensus sequences for genogroups I, II, and V are shown. In the logos, the height of each column of letters is equal to the information content (in bits) at the given position in the epitope. The relative height of each letter within each column is proportional to the frequency of the corresponding amino acid at that position (generated using WebLogo,
http://weblogo.berkeley.edu/logo.cgi) (58).
on November 7, 2019 by guest
http://jvi.asm.org/
[image:7.585.115.474.68.463.2]in a blunted initial P1519F-specific response that failed to show a
clear peak at day 8 p.i. (Fig. 5EandF). However, at days 15 and 29
p.i., the responses to CW3 and CR6 were similar in magnitude. Together, these data show that we are able to track MNV-specific intestinal CD8 T cells and that the magnitude and kinetics of the CD8 responses differ between two viruses with distinct biological behaviors.
Antigen-specific CD8 T cell responses to an acute and a
per-sistent strain of MNV are phenotypically distinct.During
effec-tor and memory T cell differentiation, the dynamic expression of
cell-surface molecules is critical for tissue-specific localization and can be tracked by flow cytometry. Changes in these and other surface markers also reflect integration of signals received during activation and, thus, can provide insights into the differentiation program of the cells. To begin to define the temporal expression of key surface markers on antigen-specific T cells responding to mu-cosal MNV-CR6 and MNV-CW3 infection, we focused on LFA-1
(CD11a), VLA-1 (CD49d), and␣E7 (CD103), as these integrins
are expressed differentially on mucosal versus peripheral epitope-specific CD8 T cell subsets during lymphocytic choriomeningitis
virus (LCMV) or Sendai virus infection (64, 65). Since
MNV-CW3 and MNV-CR6 differ in their ability to persist, we further examined the expression of PD-1, a marker associated with T cell
exhaustion in a number of chronic infections (66). Our analyses
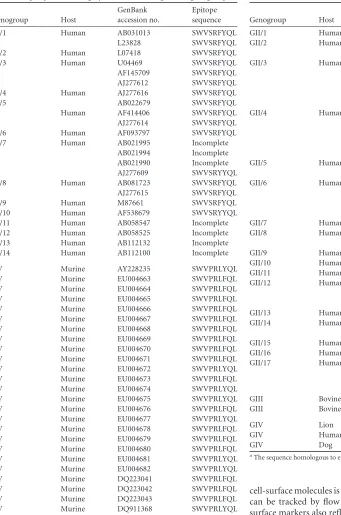
focused on LPL, where the largest MNV-specific CD8 T cell re-TABLE 1Epitope P1519is highly conserved among all NV genogroupsa
Genogroup Host
GenBank accession no.
Epitope sequence
GI/1 Human AB031013 SWVSRFYQL L23828 SWVSRFYQL GI/2 Human L07418 SWVSRFYQL GI/3 Human U04469 SWVSRFYQL AF145709 SWVSRFYQL AJ277612 SWVSRFYQL GI/4 Human AJ277616 SWVSRFYQL
GI/5 AB022679 SWVSRFYQL
Human AF414406 SWVSRFYQL AJ277614 SWVSRFYQL GI/6 Human AF093797 SWVSRFYQL GI/7 Human AB021995 Incomplete
AB021994 Incomplete AB021990 Incomplete AJ277609 SWVSRYYQL GI/8 Human AB081723 SWVSRFYQL AJ277615 SWVSRFYQL GI/9 Human M87661 SWVSRFYQL GI/10 Human AF538679 SWVSRYYQL GI/11 Human AB058547 Incomplete GI/12 Human AB058525 Incomplete GI/13 Human AB112132 Incomplete GI/14 Human AB112100 Incomplete
[image:8.585.49.390.75.590.2] [image:8.585.245.538.78.534.2]GV Murine AY228235 SWVPRLYQL GV Murine EU004663 SWVPRLFQL GV Murine EU004664 SWVPRLFQL GV Murine EU004665 SWVPRLFQL GV Murine EU004666 SWVPRLFQL GV Murine EU004667 SWVPRLFQL GV Murine EU004668 SWVPRLFQL GV Murine EU004669 SWVPRLFQL GV Murine EU004670 SWVPRLFQL GV Murine EU004671 SWVPRLFQL GV Murine EU004672 SWVPRLYQL GV Murine EU004673 SWVPRLFQL GV Murine EU004674 SWVPRLYQL GV Murine EU004675 SWVPRLYQL GV Murine EU004676 SWVPRLFQL GV Murine EU004677 SWVPRLYQL GV Murine EU004678 SWVPRLFQL GV Murine EU004679 SWVPRLFQL GV Murine EU004680 SWVPRLFQL GV Murine EU004681 SWVPRLYQL GV Murine EU004682 SWVPRLYQL GV Murine DQ223041 SWVPRLFQL GV Murine DQ223042 SWVPRLFQL GV Murine DQ223043 SWVPRLFQL GV Murine DQ911368 SWVPRLYQL
TABLE 1(Continued)
Genogroup Host
GenBank accession no.
Epitope sequence
GII/1 Human AJ277606 SWVNQFYSL GII/2 Human X81879 SWVNQFYSL U70059 SWVNQFYSL GII/3 Human AB067542 SWVNPFYTL U46039 SWVNPFYTL U02030 SWVNPFYTL U22498 SWVNPFYTL AF190817 SWVNPFYTL GII/4 Human X76716 SWVNQFYTL X86557 SWVNQFYTL AF145896 SWVNQFYTL AJ004864 SWVNQ_YTL AF414425 SWVNQFYTL GII/5 Human AF414423 SWVNQFYSL AJ277607 SWVNQFYSL GII/6 Human AF414410 AWVNQFYTL
AF414407 AWVNQFYTL AJ277620 AWVNQFYTL AB039776 AWVNQFYTL GII/7 Human AJ277608 AWVNQFYTL GII/8 Human AF195848 SWVKQFYSL
AB067543 AWVNQFYSL GII/9 Human AY054299 AWVNQFYSL GII/10 Human AF427118 SWVNQFYTL GII/11 Human AB112221 Incomplete GII/12 Human AJ277618 SWVNQFYSL
AB032758 TWVNQFYSL AB039775 SWVNQFYSL GII/13 Human AY130761 AWVNPFYTL GII/14 Human AB078334 SWVNQFYSL AY113106 SWVNQFYSL GII/15 Human AB058582 Incomplete GII/16 Human AB112260 Incomplete GII/17 Human AF414426 SWVSSFYIL
AF414427 SWVSSFYIL AF195847 SWVSSFYIL
GIII Bovine AF32025 SWVSFYYQL GIII Bovine AJ011099 SWVSLYYQL
GIV Lion EF450827 SWVSAFYVL GIV Human FM865412 SWVSSFYIL GIV Dog EU224456 SWVNAFYVL
aThe sequence homologous to epitope P1519for NV strains from Figure 4 is shown.
on November 7, 2019 by guest
http://jvi.asm.org/
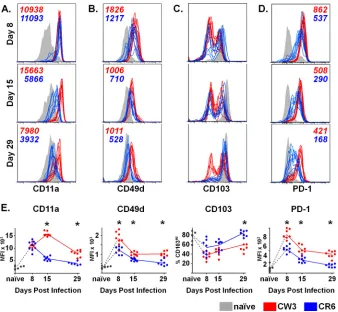
sponses were found (Fig. 5BtoD). As shown inFigure 6A, infec-tion with either strain of MNV resulted in upregulainfec-tion of LFA-1
␣-chain, CD11a, on day 8 p.i. compared to its level in naive T cells.
High expression of CD11a was maintained on CW3-specific T cells for at least 1 month following infection; in contrast, CD11a was gradually downregulated on CR6-specific CD8 T cells and by day 29 p.i. had returned to baseline. Like CD11a, CD49d (the
␣-chain of VLA-1) was upregulated on day 8 p.i. regardless of the
infecting MNV strain (Fig. 6B). By day 15, both CW3- and
CR6-specific lymphocytes had significantly downregulated CD49d ex-pression, although in the case of CW3, expression remained above baseline even at day 29. Finally, as previously reported, intestinal
lymphocytes in naive mice expressed high levels of CD103, the␣
subunit of the gut-homing integrin␣E7 (67). In contrast, the
presence of a CD103LOpopulation (approximately half of
MNV-specific LPL at day 8 p.i.) suggests that these cells were being
re-cruited to the intestine from nonmucosal sites (Fig. 6C). By day
29, nearly all CR6-specific T lymphocytes had transitioned to a
CD103HIphenotype; in contrast, the distribution of CD103 on
CW3-specific LPL remained bimodal.
As expected, PD-1 was upregulated at day 8 p.i. on both CR6-and CW3-specific T cells, consistent with the expression of this
molecule during early T cell activation (Fig. 6D). High expression
of PD-1 on antigen-specific CD8 T cells has also been associated with T cell exhaustion and dysfunction in the setting of certain
chronic infections (66). While the mechanism by which
MNV-CR6 establishes persistent infection in wild-type mice is currently unknown, we hypothesized that CR6-specific but not CW3-spe-cific LPL might maintain high levels of PD-1 expression at late time points. Contrary to our prediction, PD-1 expression was higher on CD8 T cells responding to MNV-CW3 than on those cells responding to MNV-CR6 infection at all time points exam-ined. Collectively, these data show that, in addition to the differ-ence in magnitude of the antigen-specific responses elicited by
MNV-CW3 and MNV-CR6, these two strains result in P1519
-spe-cific CD8 T cell populations with distinct immunologic profiles. In the case of MNV-CR6, the pattern of integrin expression at late time points is consistent with virus-specific cells residing in the intestine. In contrast, the expression of these same molecules on CW3-specific CD8 T cells suggests that these cells either down-regulate integrin expression over time or are continuously re-cruited from peripheral sites. While our experiments do not di-rectly test these possibilities, immune surveillance by continuous recruitment of peripherally primed CD8 T cells to sites of
infec-tion has previously been demonstrated (68). Finally, the finding
that infection with MNV-CR6 is not associated with PD-1 up-regulation at late time points suggests that, in contrast to other chronic pathogens, MNV persistence is not associated with a pre-viously described phenotype of classic CD8 T cell exhaustion.
Persistent MNV infection is associated with decreased
func-tionality of virus-specific CD8 T cells.A number of persistent
viral infections have been associated with dysfunctional T cell
re-sponses (53, 66). Although PD-1 was not upregulated during
chronic MNV-CR6 infection (Fig. 6D), we wanted to examine
whether, compared to MNV-CW3, MNV-CR6 leads to CD8 T cells with altered functionality. To test this possibility, we infected mice with MNV-CW3 or MNV-CR6 p.o. and analyzed epitope-specific CD8 T cells in two ways, (i) by tetramer staining with
Kb-P1519Yor Kb-P1519For (ii) byin vitrostimulation with peptide
P1519Yor P1519F(Fig. 7A). Consistent with our earlier results, after
TABLE 2 Common human HLAs predicted to bind epitope P1 519 a NV epitope or human class I HLA Consensus sequence IEDD rank 1 2 3 4 5 6 7 8 9 GI GII Norovirus GI S W V S R F Y Q L NA NA Norovirus GII S W V N Q F Y S,T L NA NA HLA-A*23:01 Y W, I 0.45 0.7 HLA-A*24:02 Y N, E, L, M, P,G D, P I, V F Q, N E,K I, L, F 0.55 1.10 HLA-B*08:01 G, L, I K, R E, Q, D, H, L, S, T, R, G, K K, R N, Q, H, I, L, Y, V, E, M, S, T, F E, H, M, N, D, Q, S, T, Y E, Q, H, S,L, V, D, T L, F, M 0.50 2.30 HLA-B*37:01 K, Q D, E, H, P, G, S, L V, I, T, R, A, D, G, H, M Q ,K ,Y ,L F ,M ,L ,T ,E ,N ,D , Q, G, H I, L 1.4 3.0 HLA-C*04:01 Y, P, F D, H D, E, P A, H, M, T, R V, I, L A K, S, H L, F, M 0.1 0.3 HLA-C*06:02 I, F, K, Y P, R P, I, G, F, Y, K, N, A P, E, D, Q, L I, L, F, M, K V, I, L, A, T, S R, K, Q, N Y, E, Q, N, R, G, T, S, K L, I, V, Y 0.4 0.9 HLA-C*07:02 Y, P, R, D P, G, A D, E, V, Q, P, S, G V, Y, I, L, F, M, T V, I, L, M A, R Y, M, N, R, V, F, E H, A, F, D, K Y, F, L 0.2 0.7 a The consensus sequence for each epitope and HLA binding preference are shown. Underlined residues denote preferred anchors at the given position ( 63 ). The Immune Epitope Database (IEDB) Analysis Resource was used to predict the binding affinity of human class I HLAs for epitope P1 519 from NV genogroups I and II. The table lists HLAs that returned a percentile rank of ⬍ 1.5. NA, not applicable.
on November 7, 2019 by guest
http://jvi.asm.org/
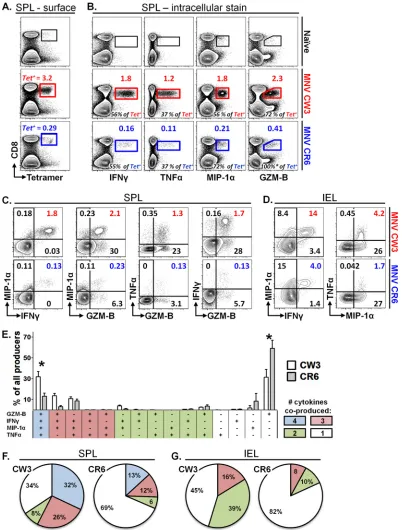
[image:9.585.79.253.75.725.2]infection with MNV-CW3 or MNV-CR6, approximately 3.2% and 0.3%, respectively, of CD8 T cells in the spleen stained
posi-tive for the corresponding tetramer at day 8 p.i. (Fig. 7A). In a
parallel analysis,in vitrostimulation with peptide P1519Yor P1519F
resulted in IFN-␥production by 1.8% and 0.16% of CD8 T cells,
respectively (Fig. 7B, 1st column). Thus, approximately one half
of tetramer-positive CD8 T cells from either CW3- or
CR6-in-fected animals are capable of producing IFN-␥at day 8 p.i. (Fig.
7B, 1st column, numbers in black). Similarly, approximately
one-third of tetramer-positive splenocytes produced TNF-␣after
in-fection with either MNV-CW3 or MNV-CR6 (Fig. 7B, 2nd
col-umn). In contrast, a greater fraction of the total MNV-CR6- than of the MNV-CW3-specific CD8 T cell population produced
MIP-1␣or granzyme B (GZM-B) (Fig. 7B, 3rd and 4th columns).
This difference in the fractions of MIP-1␣- and
GZM-B-produc-ing cells could reflect improved functionality of CD8 T cells spe-cific for MNV-CR6; alternatively, it could be due to skewing of the
MNV-CR6 response toward MIP-1␣and/or GZM-B production
at the expense of other cytokines. To begin to address this issue, we compared cytokine, chemokine, and GZM-B coproduction in the
setting of MNV-CW3 or MNV-CR6 infection (Fig. 7C). This
anal-ysis showed that, compared to the results for MNV-CR6, a signif-icantly greater fraction of CW3-specific CD8 T cells in the spleen were polyfunctional, as measured by the ability to coproduce two effector functions in various combinations. These observations
were also true for IEL in the intestine (Fig. 7D).
Next, we profiled CD8 T cells from CW3- and MNV-CR6-infected mice with respect to their ability to coproduce
var-ious combinations of four functions (IFN-␥, TNF-␣, MIP-1␣,
and GZM-B) in response to stimulation with peptide P1519. This
analysis confirmed the existence of a significant fraction of CD8 T
cells producing only GZM-B and MIP-1␣during MNV-CR6
in-fection and, also, revealed a greater frequency of MNV-specific CD8 T cells producing all four cytokines in response to MNV-FIG 5Robust epitope P1519-specific T cell responses following MNV infection. Mice were infected p.o. with 1.5⫻106PFU of MNV-CW3 or MNV-CR6. (A) Viral load in the terminal ileum (TI) was assessed on day 8 p.i. with MNV-CW3 or MNV-CR6. Dotted line indicates limit of detection. (B) Epitope-specific CD8 T cells in the indicated tissues were detected by tetramer staining on day 8 p.i. The data are representative of 8 mice per group. (C) Fractions of epitope-specific CD8 T cells in the IEL and LPL. The average absolute numbers of Tet⫹IEL on day 8 were 1⫻105for MNV-CW3 and 1.5⫻104for MNV-CR6. (D) Total numbers of Tet⫹CD8 T cells in spleen and MLN at day 8 p.i. In panels A, C, and D, horizontal lines show the means. (E) The epitope-specific CD8 T cell response in the LP was tracked for 29 days p.i. (F) Graph shows longitudinal summary data for the percentages of CD8 T cells staining with the respective MNV tetramer for MNV-CW3 versus MNV-CR6 infection. Note that MNV-CW3 and MNV-CR6 differ by a single amino acid in epitope P1519, and therefore, tetramers matching the appropriate strain were used in these experiments. In the experiment whose results are shown in panel A, naive cells were from the spleen; in the experiment whose results are shown in panel E, naive cells were from the LP. Naive cells from MLN and IEL showed similar backgrounds of tetramer staining (data not shown). *, differences between groups by the unpairedttest were statistically significant (P⬍0.05).
on November 7, 2019 by guest
http://jvi.asm.org/
[image:10.585.124.464.63.422.2]CW3 (Fig. 7E).Figure 7F shows a summary of the functional profiles of splenic CD8 T cells from MNV-CW3- and MNV-CR6-infected mice in terms of total number of functions performed. Particularly striking in this analysis is the finding that the majority (69%) of CD8 T cells responding to MNV-CR6 performed only one of the four functions analyzed. When this analysis was applied
to IEL, similarly diminished functionality was observed (Fig. 7G).
Since our analysis is limited to IFN-␥, TNF-␣, GZM-B, and
MIP-1␣, we cannot rule out the possibility that MNV-CR6-specific
CD8 T cells remain polyfunctional with respect to other cytokines or functions. However, these data suggest that persistent infection with MNV is associated with inefficient acquisition and/or main-tenance of polyfunctional capability with respect to cytokines, chemokines, or cytotoxic potential.
P1519-specific CD8 T cells can decrease MNV replication and
shedding in persistently infectedRag1ⴚ/ⴚmice.While
CR6 establishes persistent infection in wild-type mice,
MNV-CW3 is cleared from the terminal ileum (TI) by day 8 p.i. (Fig. 5A)
(49). Unlike wild-type animals,Rag1⫺/⫺mice fail to clear
infec-tion from the TI and become persistently infected with
MNV-CW3 (49). Chachu et al. have shown that virus levels in
persis-tently infectedRag1⫺/⫺mice can be reduced by adoptive transfer
of total splenocytes from CW3 immune donors. Furthermore, viral control in these studies required the presence of all three
components of the adaptive response, i.e., B cells and CD4 and CD8 T cells, as selective depletion of any one of these subsets prior
to transfer led to incomplete viral clearance (49,50). The relative
importance of specific B or T cell subsets individually to MNV
clearance, however, has not been examined. We used theRag1⫺/⫺
model of persistent MNV infection to assess the antiviral capacity
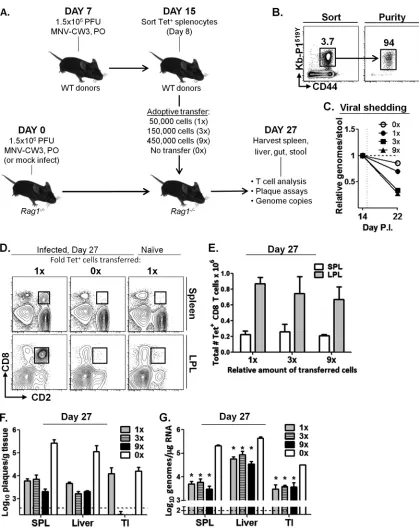
of P1519-specific CD8 T cellsin vivo(Fig. 8A).Rag1⫺/⫺mice were
infected p.o. with MNV-CW3, and persistent viral shedding over 27 days was confirmed by qPCR (data not shown). To generate a robust population of antigen-specific CD8 T cells, wild-type C57BL/6 mice were infected p.o. with MNV-CW3. Spleens from
these donor mice were isolated on day 8 p.i., and P1519Y-specific
CD8 T lymphocytes were sorted and adoptively transferred to
persistently infected Rag1⫺/⫺ mice (Fig. 8A and B). To test
whether the magnitude of the CD8 T cell response has a functional
effect on the viral burden, Rag1⫺/⫺mice received 50,000 (1⫻
group), 150,000 (3⫻group), or 450,000 (9⫻group) sorted Tet⫹
CD8 T cells on day 15 p.i. In addition, a control group of infected
Rag1⫺/⫺mice did not receive any cells (0⫻group), and a second
control group ofRag1⫺/⫺mice received cells but were kept MNV
free (naive group).
Viral shedding was followed longitudinally during the experi-ment by measuring genome copy number in fecal pellets. By day 27, a similar overall decrease in viral shedding was observed FIG 6Antigen-specific CD8 T cell responses to an acute and persistent strain of MNV are phenotypically distinct. (A to D) P1519-specific CD8 T cells from the LP of mice infected p.o. with MNV-CW3 and MNV-CR6 were analyzed for the expression of CD11a (A), CD49d (B), CD103 (C), and PD-1 (D) on days 8, 15, and 29 p.i. Mean fluorescence intensity is noted on the plots. The gating for the colored histogram plots was on live, tetramer-positive CD8 T lymphocytes; gray histograms denote CD44LOnaive CD8 T cells. (E) Mean fluorescence intensity (MFI) for each surface marker is summarized for the histograms in panels A to D, except for CD103, where the fraction of CD103HIcells is shown. For all comparisons, groups of 8 mice were used. *, differences between groups by the unpaired
ttest were statistically significant (P⬍0.05).
on November 7, 2019 by guest
http://jvi.asm.org/
[image:11.585.124.462.65.377.2]FIG 7Persistent MNV infection is associated with decreased functionality of virus-specific CD8 T cells. Mice were infected p.o. with 1.5⫻106PFU of MNV-CW3 or MNV-CR6. On day 8 p.i., equal numbers of splenocytes were stained with tetramer or stimulatedin vitrowith the appropriate P1519peptide in the presence of GolgiStop and GolgiPlug. Cytokine, chemokine, or GZM-B production by stimulated cells was analyzed by flow cytometry. (A) Surface stain for CD8 and tetramer. Gated on live lymphocytes. The numbers above each gate (in red or blue) indicate the percentage of CD8 T cells that stained positive for the tetramer. (B) ICS stain after stimulation with the appropriate peptide. Gated on live lymphocytes. Functional cells are expressed as the fraction of CD8 T cells (above gate in color), as well as the fraction of the Tet⫹population in the 1st column (black numbers at bottom of each plot). Naive background was subtracted from infected samples. *, note that GZM-B staining occasionally can exceed 100% of the tetramer-positive population, which could reflect GZM-B expression directlyex vivoin cells of different specificities. (C, D) Gated on live CD8 T lymphocytes. Numbers in color indicate cells that perform both functions as a percentage of all CD8 T cells. Naive background was subtracted from infected samples for each quadrant. (E) Patterns of expression of 4 functions by splenic CD8 T cells from infected mice. Theyaxis indicates the percentage of all CD8 T cells that produce any of the 4 functions. *, difference by nonpairedttest (P⬍0.05) between MNV-CW3 and MNV-CR6 for a given combination of functions was statistically significant. (F, G) Pie charts showing cumulative fractions of CD8 T cells producing any combination of 4 (spleen) or 3 (IEL) cytokines. These experiments represent averages from 8 mice per infection and were repeated at least twice. Note that analysis for GZM-B was omitted from IEL samples due to the high background expression of this molecule in naive intestinal lymphocytes.
on November 7, 2019 by guest
http://jvi.asm.org/
[image:12.585.92.494.66.596.2]among all groups that received Tet⫹cells (data not shown). How-ever, the rate of decline during the first 7 days following adoptive transfer was proportional to the number of transferred cells,
al-though this trend did not achieve statistical significance (Fig. 8C).
Rag1⫺/⫺mice were sacrificed 12 days after adoptive transfer
(day 27 p.i.), and tissues were analyzed for the presence of donor
lymphocytes and MNV titers. As shown by the results inFigure
8D, CD8⫹lymphocytes were readily detectable in the spleen and
LP ofRag1⫺/⫺mice that received adoptively transferred cells,
al-though there were no significant differences in the frequencies or FIG 8P1519Y-specific CD8 T cells decrease viral titer in persistently infectedRag1⫺/⫺mice. (A)Rag1⫺/⫺mice were infected p.o. with MNV-CW3. On day 7,
wild-type C57BL/6 donors were infected by the same route and with the same dose of virus. (B) Tet⫹CD8 T cells from donor spleens were sorted on day 15 (day-8 donor cells) for adoptive transfer to persistently infectedRag1⫺/⫺recipients in the numbers indicated in panel A. (C) Viral shedding in stool before and after
adoptive transfer of Tet⫹cells was monitored by qPCR. (D to G) Recipient mice were sacrificed 27 days p.i. (day 12 after adoptive transfer) and analyzed by flow cytometry for donor cells (D, E) and by plaque assay (F) and quantitative reverse transcription-PCR (G) for viral titer. Dotted lines indicate limit of detection. Error bars show standard deviations. *, differences between groups by the unpairedttest were statistically significant (P⬍0.05).
on November 7, 2019 by guest
http://jvi.asm.org/
[image:13.585.82.501.61.590.2]total numbers of Tet⫹cells in tissues of mice from the 1⫻, 3⫻, or
9⫻groups (Fig. 8E). As expected, no CD8 lymphocytes were
de-tected in the 0⫻group (Fig. 8D). In addition, Tet⫹cells did not
expand in naive recipients (Fig. 8D), indicating that the expansion
of these effector cells was in response to MNV infection rather than homeostatic proliferation, consistent with previously pub-lished data for adoptive immunotherapy of LCMV carrier mice
(69). As expected, CD2⫹CD8⫹lymphocytes in recipient mice
stained positive for tetramer and produced IFN-␥uponin vitro
stimulation with P1519Y (data not shown). Furthermore, there
were no differences in CD11a, CD103, or PD-1 staining between the three groups of infected recipients (data not shown).
To test whether transfer of MNV-specific Tet⫹cells affected
the viral burden in a dose-dependent manner, plaque assays and genome copy number counts in multiple tissues were used to monitor viral load. At day 27, viral loads were reduced by
approx-imately 10-fold in all three groups of infected recipients (Fig. 8F
andG). The greatest decrease in viral titer was seen in the terminal
ileum, where virus was undetectable by plaque assay in the 3⫻and
9⫻groups (Fig. 8F). At this late time point (12 days after transfer),
we did not observe significant differences between the 1⫻, 3⫻,
and 9⫻groups, likely due to the fact that an equilibrium between
viral reinfection and Tet⫹CD8 T cell responses had been reached.
Thus, these data suggest that CW3-specific CD8 T cells contribute to viral control in multiple tissues independently of other arms of the adaptive immune system.
DISCUSSION
Human noroviruses are estimated to cause 267 million infections
and 200,000 deaths per year (70). While the burden of this disease
is highest in developing countries, recent data from the CDC sug-gest that mortality from NV gastroenteritis is rising in the United
States (71). Vaccine efforts to date have focused on eliciting
anti-bodies that neutralize the binding of the P2 region of ORF2 to cell
surface HBGAs (72). Due to the rapid emergence of novel P2
variants in response to herd immunity (particularly among
mem-bers of genocluster GII.4, which account for⬎80% of human
infections), developing a broadly neutralizing vaccine has been
challenging (70, 72). Furthermore, despite recent progress in
mapping antibody epitopes and elucidating cross-blockade pat-terns among NV genogroups, the existence of long-term
protec-tive humoral immunity remains controversial (70).
In contrast to humoral immunity, cellular responses to human NV infection have been largely uncharacterized, despite the fact that CD4 and CD8 T cell responses have been demonstrated in
both infected and control volunteers (41,73). Indeed, T cells are
critical for the control of a number of other mucosal pathogens,
including influenza virus and HIV (74, 75). The importance of
defining the T cell component of NV immunity is further high-lighted by a growing recognition that noroviruses are capable of establishing chronic mucosal infection in both
immunocompro-mised and immunocompetent hosts (14–18).
In the present study, we use the murine model of NV infection to build upon previous work by Chachu et al., which established a
critical role for CD8 T cells in the control of MNV infection (49).
Our results demonstrate that (i) mucosal MNV infection elicits a
robust CD8 T cell response specific for epitope P1519, (ii) this
epitope is highly conserved in the P1 region of capsid proteins from all NV genogroups and seems to account for the majority of the CD8 T cell response, (iii) the magnitude and quality of the
epitope-specific CD8 T cell responses differ dramatically for strains that cause acute versus chronic infection, with persistent MNV infection being associated with fewer and less-functional CD8 T cells at mucosal sites, and (iv) sufficient numbers of
func-tional P1519-specific CD8 T cells are capable of reducing fecal viral
shedding and tissue viral loads during persistent infection even in the absence of other components of adaptive immunity. We be-lieve that these findings have the potential to affect future NV vaccine development and, more broadly, can serve as a starting point for understanding chronic mucosal infections.
The findings presented here could inform future vaccine de-velopment in two ways. First, we have established that virus-spe-cific CD8 T cells are not only critical for control of MNV infection but are also sufficient for decreasing titers in chronically infected
Rag1⫺/⫺animals. Thus, while antibodies clearly contribute to the
control of natural NV infection, harnessing the T cell response might be another important goal for future vaccine designs. Sec-ond, we have identified a conserved immunodominant MHC class I epitope that could serve as a specific target in future vacci-nation strategies aimed at eliciting broadly neutralizing protective T cell immunity. Before our findings in the MNV system can be translated into useful clinical applications, they must first be val-idated in humans. Recent work by Lindesmith et al. has
demon-strated that CD4⫹and CD8⫹peripheral blood mononuclear cells
(PBMCs) from infected volunteers are capable of producing
IFN-␥upon restimulation with VLPsin vitro(41,73).
Further-more, subsets of both acutely infected individuals and control subjects showed T cell responses after stimulation with hetero-typic VLPs, suggesting the existence of T cell memory and/or cross-stimulation of the T cell receptor (TCR) by closely related epitopes. It would be interesting to test whether such T cell
re-sponses could be elicited by stimulation with peptide P1519and/or
to map other immunodominant MHC class I epitopes from hu-man NV. A related question is whether, compared to infection with live virus, vaccination with nonreplicating VLPs elicits CD8 T cell responses of comparable magnitude and diversity. This issue is particularly relevant in light of the facts that VLPs have been used in virtually all NV vaccination trials to date and that, in a recent study by LoBue et al., adoptively transferred CD4 or CD8 splenocytes from mice vaccinated with MNV-CW3 VLPs failed to
protect recipients against challenge with the live virus (76).
Fi-nally, an important factor to consider when designing T cell-based vaccines is the optimal site of T cell priming. Specifically, while oral vaccination with VLPs might seem logical, it is not clear whether the generation of long-lasting protective immunity re-quires T cell priming at mucosal or peripheral sites. For example, MNV-CW3, which is successfully cleared, can be detected in spleens from immunocompetent mice at early time points, while the persistent CR6 strain is limited to mucosal sites (data not shown). Consistent with these observations, our data on the phe-notype and differentiation state of responding CD8 T cells sug-gests a model whereby successful clearance of MNV-CW3 infec-tion is associated with CD8 T cells that are continuously recruited
to the mucosa from peripheral sites (Fig. 6). The MNV system
provides a unique opportunity to address these questions, since MNV is capable of establishing infection via both mucosal and peripheral routes.
While persistent NV infection in immunocompromised pa-tients has been well-documented, it is also clear that even immu-nocompetent individuals can be asymptomatic carriers and shed