ePrints Soton
Copyright © and Moral Rights for this thesis are retained by the author and/or other copyright owners. A copy can be downloaded for personal non-commercial
research or study, without prior permission or charge. This thesis cannot be
reproduced or quoted extensively from without first obtaining permission in writing from the copyright holder/s. The content must not be changed in any way or sold commercially in any format or medium without the formal permission of the
copyright holders.
When referring to this work, full bibliographic details including the author, title, awarding institution and date of the thesis must be given e.g.
Techniques
Applications in Homogeneous Catalysis
ISBN 90-393-3669-5
Techniques
Applications in Homogeneous Catalysis
Ontwikkeling van Tijdsopgeloste XAFS Spectroscopie Technieken
Toepassingen in Homogene Katalyse
(met een samenvatting in het Nederlands)
Proefschrift
ter verkrijging van de graad van doctor aan de Universiteit Utrecht op gezag van de Rector Magnificus, Prof. Dr. W. H. Gispen
ingevolge het besluit van het College voor Promoties in het openbaar te verdedigen op maandag 19 april 2004 des middags te 2:30 uur
door Moniek Tromp
Debye Institute, Utrecht University, Utrecht, The Netherlands
Prof. Dr. G. van Koten,
Debye Institute, Utrecht University, Utrecht, The Netherlands
Co-promotores: Dr. J. A. van Bokhoven,
Institute for Chemical- and Bioengineering, Swiss Federal Institute of Technology (ETH), Zurich, Switzerland
Dr. G. P. F. van Strijdonck,
Van ‘t Hoff Institute for Molecular Sciences, University of Amsterdam, Amsterdam, The Netherlands
Chapter 1 General Introduction and Outline Thesis 1
Chapter 2 XAFS Data Acquisition Methods and Set-ups & 11 Novel Combined Time-Resolved ED-XAFS/UV-Vis set-up
Chapter 3 Cu K-edge EXAFS Characterisation of Copper(I) 25 Arenethiolate Complexes in both Solid and Liquid State:
Detection of Cu-Cu Coordinations
Chapter 4 Probing the Molecular Orbitals and Charge Redistribution 53 in Organometallic (PP)Pd(XX) Complexes -
A Pd K-edge XANES study
Chapter 5 Atomic XAFS as a Probe of Charge Redistribution 93 within Organometallic Complexes
Chapter 6 6a Structure-Performance Relations in Homogeneous 121 Pd Catalysis by In Situ EXAFS Spectroscopy
6b Deactivation Processes of Homogeneous Pd 131 Catalysts using In Situ Time-Resolved Spectroscopic Techniques
Chapter 7 7a Base-free Anaerobic Cu(II) Catalyzed 139 Aryl-Nitrogen Bond Formation
7b Multi-technique Approach to Reveal the Mechanism 151 of Cu(II) Catalyzed Arylation Reactions
Chapter 8 8a Summary 187
8bSamenvatting 191
List of Publications and Presentations 197
Dankwoord 203
C
C
h
h
a
a
p
p
t
t
e
e
r
r
1
1
General Introduction
Introduction
Catalysis
In the last decades, enormous emphasis is placed on the world’s responsibility to take care of the environment. For the chemical industry, this means that there is a growing demand for the production of compounds in a responsible and sustainable manner. New processes have to be developed which require a minimum amount of energy and resources and produce the least possible waste.
One of the main methods to obtain products in a selective and sustainable manner is catalysis. A catalyst increases the rate of a chemical reaction, without being consumed itself. Moreover, since a catalyst can also direct the product selectivity of a reaction, many compounds cannot be produced without a catalyst. In catalysis, three fields can be distinguished: homogeneous catalysis in which both the reactants and catalysts have the same aggregation phase, heterogeneous catalysis in which the reactants and catalyst possess a different phase, and biocatalysis which uses enzymes as a catalyst.1
In the petrochemical industry and during large-scale production of base chemicals mainly heterogeneous catalysts are used, because of their easy separation from products and reactants. Moreover, they are thermally stable. Homogeneous catalysts, however, are in general more active and selective. The electronic and steric properties of homogeneous transition metal catalysts can be fine-tuned in a controlled manner by changing the ligands around the metal center. In this way their activity and selectivity can be directed and the stability can be increased. Several drawbacks of these catalysts exist. The development costs are high and the difficult separation and fast degradation of the catalyst prevents an easy recycling. Consequently, homogeneous catalysts are mainly used in small batch reaction processes that have high demands for pure and selective products, which occurs e.g. in the pharmaceutical industry.
Revealing Reaction Mechanisms in Homogeneous Catalysis
In general, homogeneous catalysts have a well-defined structure in contrast to heterogeneous systems. Better insights in and understanding of the catalytic complex and catalytic cycle are therefore obtained in homogeneous catalysis. Crystal structures give detailed structural information about the catalytic complex and extensive kinetic studies lead to information about the reaction mechanisms. Sometimes, reaction intermediates or resting states are isolated and crystallized. In many studies presented in the literature however, a catalytic cycle is proposed using indirect evidence, without detailed structural information about the reaction intermediates themselves.
The arsenal of generally applied characterization techniques does not enable such detailed structural determination. Nuclear Magnetic Resonance (NMR) yields the local coordination of atoms. It can identify structural units from their characteristic chemical shifts and detects atom connectivities and distances in structures through coupling patterns. The application of this technique however is limited to accessible nuclei and in situ experiments are often difficult. Techniques like Infra Red and UV-Vis spectroscopy can generally be performed in situ and time-resolved, but are only able to identify a limited number of functional groups within molecules, local symmetry and bond angles or specific electronic transitions respectively.
An experimental technique that fills the gap in structural analysis and that can be applied in situ and in a time-resolved mode is X-ray absorption fine structure (XAFS) spectroscopy.2 XAFS is a very powerful technique to determine the local structure in materials (type and number of neighboring atoms, distances, electronic properties of absorber atom). Since the technique does not require long-range ordering of the material, amorphous materials and solutions can be studied. The technique is today broadly applied in heterogeneous catalysis. Only a few good examples in homogeneous catalysis are known, although the properties of XAFS spectroscopy suggest that it can be applied successfully. Detailed electronic and structural information about the homogeneous catalysts in their chemical active environment can be obtained and structure – performance relationships derived. The limited amount of applications in homogeneous catalysis may be due to the complicated data-analysis, which will be illustrated in Chapter 3 of this thesis.
It is clear that XAFS spectroscopy is complementary to other techniques. A combination of different spectroscopic techniques is required to unravel the complete catalytic system under investigation.
XAFS Spectroscopy
In this thesis the application of XAFS spectroscopy in homogeneous catalysis is explored. Developments of theory and data-analysis procedures, and instrumentation to monitor homogeneous catalytic reactions in situ and in a time-resolved mode are described. Therefore, an introduction into the technique will be presented here. The different set-ups and instrumentation to perform XAFS experiments, including the novel time-resolved in situ XAFS set-up, are described in Chapter 2.
Figure 1. Attenuation of an X-ray beam by an absorbing sample; Lambert’s Law.
I0 It
x
I0 It
x
Figure 2. The photoelectric effect: Excitation of a core electron to an empty state or the continuum.
photoelectron
Ebinding
hν
EFermi
hν s p d photoelectron
Ebinding
hν
EFermi
[image:13.595.66.300.553.695.2]XAFS Theory
In an X-ray absorption experiment a sample is exposed to high-energy X-rays that are produced by a synchrotron. The sample absorbs part of the photons, dependent on its absorption characteristics. The incoming X-ray beam with intensity I0 is attenuated by the sample according to Lambert’s Law (Figure 1):
x E t I e
I = 0 −µ( ) , (1)
where It is the intensity of the transmitted photons, µ (E) the linear absorption coefficient and x the absorption path length which is the thickness of the sample. If the energy of the X-ray photons is high enough to excite a core electron to an empty state or the continuum (Figure 2) a strong increase in absorption is observed. This is called the photo-electronic effect as drawn in Figure 2. In a plot that shows the absorption as a function of energy, a step is visible, the so-called absorption edge (Figure 3).2 Since the absorption edge is correlated to the binding energy E0 of an electron, the absorption edge is element specific.
At energies of the incident X-ray beam I0 larger than E0, the photoelectron obtains a kinetic energy Ekin defined by:
0 E h
Ekin = ν − . (2)
The outgoing photoelectron can be regarded as a spherical wave with wavelength λ =
2π/k and is defined as:
(
)
−
= 2 0
2 8
E h h
m
k π ν , (3)
with m the electron mass and h Planck’s constant.
The absorption coefficient, µ(E), of the sample is proportional to the probability of the photoelectric effect. Within the dipole approximation, which is only valid for photon wavelengths longer than atomic dimensions,3 the transition probability is a function of the initial state ψi and final state ψf wave functions according to Fermi’s Golden Rule:4
( )
ψ ψ δ(
ν)
µ E ∝ f • i Ef −Ei −h
2 UUUU
In this formula, ê is the electric field polarization vector of the photon and r the coordinate vector of the electron. The delta function describes the conservation of energy.
The outgoing electron scatters against the electron clouds of neighboring atoms, creating a backscattered wave that interferes with the outgoing wave. The final state wave function is thus a superposition of the outgoing and backscattered waves. The interference between these waves is a function of the energy and depends on the local structure of the absorber atom. In an X-ray absorption spectrum (Figure 3), this interference appears as oscillations in the absorption spectrum, which is called fine structure. The absorption coefficient above the absorption edge is defined as:
( )
(
k)
tot µ χ
µ = 0 1+ (5)
with µ0 the atomic background and χ the oscillatory EXAFS part of the spectrum as a function of k.
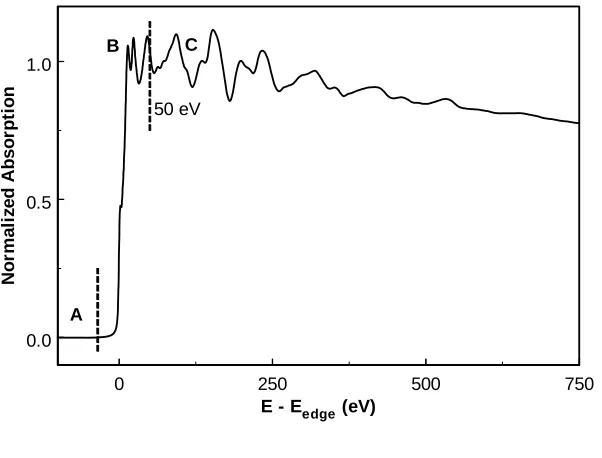
Figure 3 displays the absorption spectrum of Cu foil. It can be divided in three parts. The first part, A, is the so-called pre-edge part giving information about the oxidation state and the geometry. The features in the second part B, the X-ray absorption near-edge spectroscopy (XANES) part, provide information about the coordination geometry and oxidation state. Finally, part C is the extended x-ray absorption fine structure (EXAFS) from which detailed geometrical data can be derived.
Figure 3. Typical x-ray
absorption spectrum, showing (1) the pre-edge, (2) the X-ray absorption near edge region (XANES) including absorption edge and (3) the extended x-ray absorption fine structure (EXAFS) region.
0 250 500 750
E - Eedge (eV) 0.0
0.5 1.0
N
o
rm
al
iz
ed A
b
s
o
rp
ti
on
A
B C
[image:15.595.69.370.497.726.2]Geometrical Information from EXAFS
As mentioned above, EXAFS, which is the fine structure observed in Figure 3(C), originates from scattering of the outgoing electron against the electron clouds of neighboring atoms, creating a backscattered wave that interferes with the outgoing photoelectron.2 The interference pattern is not only determined by the type of atoms but also by the positions of these atoms. In a single scattering approximation the photoelectron scatters only once before it returns to the absorber atom (see Figure 3). This simplification is sufficient to describe and analyze the EXAFS signals in most experimental data. The EXAFS function can be described as a summation over all interference patterns scattered off of all neighboring atoms:
( )
k A( )
k(
kRj j( )
k)
jj ϕ
χ =
∑
sin 2 + (6)with j referring to the jth coordination shell, Rj the distance of the absorber atom to this coordination shell, Aj(k) the backscattering amplitude, and ϕj(k) the phase shift experienced
by the photoelectron.
The backscattering amplitude Aj(k) is a function of k:
( )
( )
2 2 22 / 2 2
0 k
j j j R j
j j
e k F N kR e S k
A σ
λ
− −
= . (7)
It contains the coordination number, Nj, and the magnitude of the backscattering amplitude Fj(k) which is element specific. In addition damping of the amplitude occurs. S02 is an amplitude reduction factor and approximates the loss in photon intensity caused by many-body effects like shake-up and shake-off due to relaxation processes after electron excitation.2 The exponential term containing the mean free path of the photoelectron λ accounts for the finite lifetime of the excited state. The thermal motion and structural disorder in the distance Rj is described by the Debye-Waller factor σ.
Fourier transformation of the EXAFS data results in a radial atomic distribution function.5 Analysis of the EXAFS data will thus yield the type and number of neighbors, their distance to the scatterer and their disorder.6 A careful data-analysis procedure6 is required to obtain reliable geometric information. This procedure will be explained in detail
AXAFS
The outgoing electron can also scatter against the electron cloud of the absorber atom itself. This is called Atomic XAFS.7,8,9 This scattering results in a peak in the Fourier Transform at approximately the atomic radius and contains information on the interatomic potential, i.e. the electronic structure as determined by the absorber atom and its neighbors. Controversy exists in the literature about the existence of Atomic XAFS and the assignments of the low R-peaks in the Fourier transform of the oscillatory part of the XAFS data.10 Careful background subtraction and EXAFS data-analysis procedures are required to properly isolate the AXAFS contribution from the total XAFS data.9 This will be discussed
in Chapter 5 and evidence for the existence of AXAFS will be provided.
XANES
The XANES part of the absorption spectrum (Figure 3(B)) is determined by the empty density of states (DOS). The empty DOS is probed by multiple scattering of the outgoing electron.2 At energies just above the absorption edge, the excited photoelectron possesses a low kinetic energy. Few processes exist that are able to absorb this low amount of energy, resulting in a long mean free path. The long mean free path allows the photoelectron to scatter more than once (Figure 4), and even against rather distant atoms (up to 30Å). This multiple scattering thus can give information about relative positions of these neighboring atoms. Stereochemical information like coordination and bond angles can be obtained from this part of the absorption spectrum. An extensive XANES study is described in Chapter 4, revealing important information on the DOS of and charge distribution within the samples under investigation.
Figure 4. After excitation of an electron of the
absorber atom (solid black circle) to the continuum, the photoelectron scatters against neighboring atoms (empty black circles). Examples of single scattering and multiple scatterings paths are indicated.
Single Scattering Multiple Scattering
Outline Thesis
In the standard scanning data acquisition mode of XAFS data (described in Chapter 2), collection times of EXAFS spectra vary from minutes to hours. As there is interest in obtaining structural information on dynamic systems, an alternative data acquisition method, i.e. energy dispersive (ED) mode, has been developed allowing short collection times.11 The time-resolution achievable at the moment is in the millisecond to second range. The ED-XAFS technique (Chapter 2) is further developed and applied to homogeneous catalytic systems in order to determine catalytic reaction intermediates and to gain insights into selected homogeneous catalytic reaction mechanisms. Moreover, since a combination of spectroscopic techniques gives complementary information about the system under investigation, a new set-up is developed to allow simultaneous time-resolved UV-Vis and ED-XAFS measurements. This set-up and its instrumentation are described in detail in
Chapter 2.
The structures of the homogeneous catalysts, catalytic precursors and resting states in the catalytically active phase, i.e. solution, are determined with ‘normal’ scanning XAFS. The EXAFS data-analysis for organometallic complexes is very difficult. Thus a procedure that accurately analyzes EXAFS data of organometallic systems was required. A new refined data-analysis procedure is developed which is described in Chapter 3. Although the crystal structures of many of these catalytic compounds are well known, the structures in reaction medium are often unclear. Measuring the catalysts in reaction medium can give essential information regarding their catalytic activity and selectivity as shown in Chapters 3, and 6a. X-ray absorption near edge spectroscopy (XANES) and Atomic XAFS (AXAFS) studies are performed, in combination with theoretical FEFF8.0 and DFT (ADF) calculations, to learn more about the electronic and geometrical properties of different organometallic complexes. The Pd K-edge of series of organometallic (PP)Pd(XX) complexes is studied extensively in Chapter 4. Detailed information about the positions of molecular orbitals and charge distribution within these complexes is obtained. In Chapter 5
Different homogeneous systems are studied in detail using the newly developed time-resolved spectroscopic techniques. Homogeneous palladium catalysts are found to be very active and selective in various organic synthesis reactions. However, their stability is often too low for large-scale industrial processes. Bidentate diphosphine ligands are used to influence the properties of the catalyst and thereby the performance of the catalyst and its stability towards deactivation. In Chapter 6b, the size and nature of the different inactive Pd-clusters formed during the allylic substitution reaction as a function of ligand and solvent are studied in detail using a combination of ED-XAFS and time-resolved UV-Vis experiments. Important insights in the deactivation mechanism of this system are obtained.
The novel combined set-up, allowing simultaneous acquisition of ED-XAFS and time-resolved UV-Vis, was used to study copper(II) catalyzed arylation reactions in Chapter 7. Clear changes in both the UV-Vis spectra and the ED-XANES spectra are observed, giving insights in changing oxidation states and geometry of the copper catalysts. Moreover, the combination with additional techniques like NMR, XRD, EPR and IR made it possible to propose a new reaction mechanism.
References
1. R. A. van Santen, P. W. N. M. van Leeuwen, J. A. Moulijn, B. A. Averill (Editors), Catalysis: An Integrated Approach, Second, Revised and Enlarged Edition, Elsevier, Amsterdam, 1999.
2. For example, X-ray Absorption, principles, applications, techniques of EXAFS, SEXAFS and XANES, eds. D. C. Koningsberger and R. Prins, Wiley Interscience, New York, 1988.
3. B. L. Henke, W. M. Gullikson, J. C. Davis, At. Data and Nucl. Data Tables 1993, 53, 181. 4. J. A. Muller, J. W. Wilkins, Phys. Rev. B1984, 29, 4331.
5. D. E. Sayers, E. A. Stern, F. W. Lyttle, Phys. Res. Lett.1971, 27, 1204.
6. D. C. Koningsberger, B. L. Mojet, G. E. van Dorssen, D. E. Ramaker, Top. Catal. 2000, 10, 143.
7. B. W. Holland, J. B. Pendry, R. F. Pettifer, J. Bordas, J. Phys. C: Solid State Phys.1978, 11, 633. 8. J. J. Rehr, C. H. Booth, F. Bridges, S. I. Zabinsky, Phys. Rev. B1994, 49, 12347.
9. G. E. van Dorssen, D. C. Koningsberger, D. E. Ramaker, J. Phys.: Condens. Matter 2002, 14, 13529.
10. A. Filliponi, A. Di Cicco, Phys. Rev. B1996, 53, 9466.
C
C
h
h
a
a
p
p
t
t
e
e
r
r
2
2
XAFS Data Acquisition
Methods and Set-ups
&
Novel Combined Time-Resolved
Introduction
The traditional and most used XAFS data acquisition mode is the ‘normal’ scanning mode, allowing acquisition times in the range from minutes to hours. Exact data-acquisition times depend on the element and concentration. As there is interest in obtaining structural information on dynamic systems such as chemical reactions, which occur on faster time scales, alternative methods of data acquisition have been developed. Nice overviews on time-resolved XAFS have appeared in literature.1,2,3 In this chapter the different data acquisition methods and corresponding set-ups will be described. The strengths and limitations are discussed. Some emphasis is placed on the energy dispersive data acquisition mode. Moreover, the development of a new set-up that enables the simultaneous acquisition of time-resolved UV-Vis and ED-XAFS data on homogeneous systems is presented in detail. The basic principles of XAFS spectroscopy have been discussed in Chapter 1. 4,5
XAFS Data Acquisition
I. Scanning XAFS
In the standard data acquisition mode, the photon energy is scanned in a step-by-step mode, i.e. monochromatic light is used to measure the absorption as a function of energy, yielding spectra of very high quality.5 A schematic representation of the set-up is shown in Figure 1. The entrance and exit slits (items I and III in Figure 1) define the size of the X-ray beam spot. The double crystal monochromator (item II in Figure 1) isolates a specific energy from the synchrotron beam according to the Bragg relation:
i d
nλ=2 sinθ , (1)
with the order of reflection n, the wavelength λ, the lattice spacing d, and the angle of incident beam θi. The double crystal is used to maintain the horizontal direction of the reflected beam.
third ionization chamber. This results in measuring I0 in the first, It in the second and Ir in the third ionization chamber.
Alternative detection methods, such as fluorescence and electron yield are also possible.5 These detection methods are required when the absorption of the sample is very high and the EXAFS signal is only a small fraction of the total absorption. In these cases, it is desirable to enhance the signal of interest by using the proper detector to discriminate the XAFS signal from the background. The fluorescence technique, for example, gives in general better data than transmission when the absorption of the element of interest is less than a few percent of the total absorption of the sample. This is the case for low energy edge or element present in low concentrations. Electron yield detection is a method for example used to enhance the surface sensitivity of the XAFS technique. Only transmission-type experiments are described in this thesis.
Figure 1. Schematic representation of a normal scanning XAFS set-up with (I) entrance slits, (II) double
crystal monochromator, (III) exit slits, (IV) ionization chamber I0, (V) sample, (VI) ionization chamber It, (VII) reference, (VIII) ionization chamber Iref.
II. Quick-EXAFS
The experimental set-up used for QEXAFS experiments is similar to that of the ‘normal’ scanning XAFS. Again, the energies are measured energy-by-energy using stepper motors, but now the monochromator is continuously driven through the required energy range with a simultaneous detector read-out.6 The absorption of the sample can be measured in both the forward and reverse direction. The data acquisition time of QEXAFS is therefore determined by (i) the achievable velocity of the movement of the monochromator, (ii) the integration time required per point in energy to achieve acceptable statistics and (iii) the reproducibility of the monochromator movements. Collection times vary from tens of a second to a few minutes, depending on the energy scan range. Channel-cut monochromators adjusted by piezo crystals, can further reduce the measuring time by a
White
X-Rays
I
II
III
IV V VI VII VIII
White
X-Rays
I
II
III
Utilization of this set-up allows the simultaneous acquisition of a reference compound, which is especially important to correct for possible beam instabilities. Since no real changes in data acquisition method in comparison to the ‘normal’ scanning mode exist, the QEXAFS technique allows all detection methods. This enables the application of QEXAFS to e.g. dilute systems with fluorescence detection.8
Caution has to be taken for the homogeneity of the sample and its stability during the scan. Since the absorption spectrum is measured set-by-step, small changes in the beam position on the sample will occur as for the ‘normal’ scanning mode. Moreover, to observe any intermediate in fast dynamic systems, it must be generated in high proportion and identified prior to their decay.
Figure 2. Schematic representation of a curved crystal.
III. Energy Dispersive XAFS
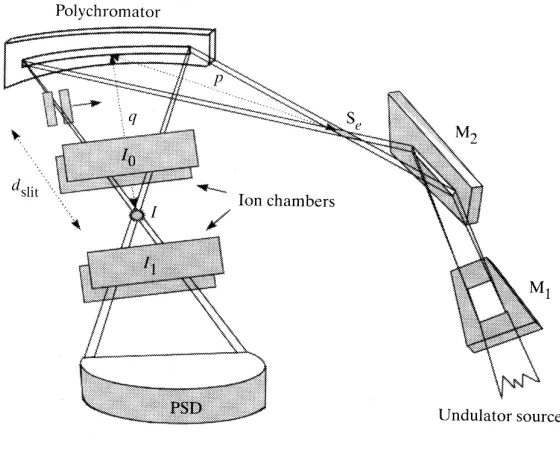
The energy dispersive approach to obtain time-resolved EXAFS data is based upon a completely different solution to the need for fast data-acquisition (in comparison to QEXAFS). The set-up is based on dispersive optics, i.e. a bent perfect crystal, which reflects a polychromatic beam out of a white source.2 A schematic representation is given in Figure 2. Again the Bragg relation (1) is valid here. Since the crystal is curved, the incident angle of all X-rays is different causing the X-rays to reflect with different energies in different directions. The crystal focuses all X-rays with different energies in one point. The sample is placed at this point. A position-sensitive detector able to work under high-flux conditions then collects the photons. In Figure 3 the complete ED-XAFS set-up is drawn. The energy-direction correlation given by the curved crystal is transformed into an energy-position correlation at the detector position. A mirror is placed behind the monochromator to reject
Curved Crystal
Synchrotron Radiation
θθθθ2
E1
E2
θθθθ1
Curved Crystal
Synchrotron Radiation
θθθθ2
E1
E2
the higher harmonic contributions. Since all data of a spectrum are acquired simultaneously, the time resolution achievable is in the sub-second range.
[image:24.595.77.498.380.586.2]The energy-dispersive data acquisition has a number of advantages over the scanning method.2,9,16,10,11 First of all, since a broad range of energies is measured at once, different edges can be measured simultaneously. Due to the lack of mechanical movements, the energy scale is very stable once the optics is tuned for a given energy range because instabilities and time delays associated with changing the energy are absent. This enables extreme sensitivity and detection of any small change in absorption induced by chemical changes. The required sample size is very small since the dispersed beam passes through a focus at the sample position. Since the whole spectrum is measured simultaneously, fluctuations in the incident X-ray beam intensity do not disadvantageously affect the quality of the recorded spectrum.
Figure 3. Schematic representation of the combined ED-XAFS / UV-Vis set-up.
However, the reduction of the source size and the lengthening of beamline have also introduced new problems related to the much higher sensitivity to beam instabilities. 2,11,16,12 The higher sensitivity arises mainly because the spectra are obtained as 1D images and they suffer from distortions due to phase contrast phenomena associated to imperfections in the optics and to small-angle scattering from the sample. This strongly affects the quality of the
Curved Crystal Sample at Focus
Position Sensitive Detector Optical Fibre UV-Vis
Light in
Light out
Synchrotron White Beam
EXAFS
UV-Vis
Curved Crystal Sample at Focus
Position Sensitive Detector Optical Fibre UV-Vis
Light in
Light out
Synchrotron White Beam
EXAFS
the image clearly amplifies the effect of beam instabilities. Because the intensity before (I0) and after the sample (It) cannot be measured simultaneously, the dispersive set-up is intrinsically more sensitive to instabilities with respect to the conventional scanning mode. Additionally, this leads to normalization problems.
EXAFS data that are collected the energy dispersive data acquisition mode are always detected in transmission mode. Therefore, highly concentrated samples are needed which limits the application range of this type of XAFS experiments. Additionally, since the sample is exposed to all X-ray energies at once, the intensity of the beam on the sample is very high and caution has to be taken for beam-induced changes like sample degradation and heating of the sample. Altogether, it is clear that experiments for ED-XAFS have to be carefully prepared.
Crystals
In ED-XAFS the curved crystal monochromator can be in either Bragg (reflection) or Laue (transmission) geometry13,14,15,16 (Figure 4a). To satisfy the best energy resolution requirements without limiting the energy bandwidth, the energy range which is reflected or transmitted at once, too much, Si(111) crystals are used in Bragg geometry when working at energies from 5 to 12 keV and in Laue geometry from 12 to 25 keV.2,13,14,15
These types of horizontally diffracting monochromators originally used a triangular crystal, because of simple engineering. However, the focal spot is not uniform, but it has a cusp form because of imperfect clamping and heating effects, and because the ideal surface is an ellipse. These problems can be avoided by using a rectangular crystal. 2,13-17,18,19 A picture of the Laue crystal, mounted in its bender at ID24 is given in Figure 4b.
Figure 4a. The different curved crystals (a) Bragg and (b) Laue.
Figure 4b. Picture of the Laue
crystal in its bender (ID24, ESRF, Grenoble, France).
Position Sensitive Detector
A photodiode array or CCD screen is typically used as a position sensitive detector. The X-ray flux is determined at each pixel. The saturation time of the pixels is depending on the sample and determines the acquisition time of a full XAFS spectrum. By averaging a number of spectra, the signal to noise ratio is improved. The time resolution depends on the acquisition time per spectrum, the amount of spectra needed to acquire an acceptable signal to noise ratio and the detector read-out time. Recent reports in the literature show spectra with a time resolution in the sub-second range.17,20,21,22
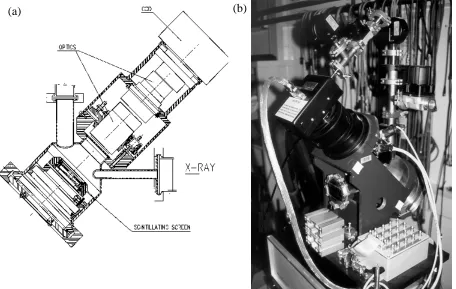
At beamline ID24 (ESRF, Grenoble, France),18,23,24 where the ED-XAFS experiments that are described in this thesis have been performed, an X-ray camera acting as a position sensitive detector was developed. This camera is based on a Peltier-cooled CCD camera of 1242 x 1152 pixels, of which 1242 x 64 pixels are exposed. The rest of the camera is physically masked. Instead of exposing the CCD camera directly to an X-ray beam, a scintillating screen (phosphorus screen) is coupled to the active part of the CCD via a lens system. By changing the scintillating screen, the camera can be easily adapted to the experimental needs, e.g. energy, time-resolution. A schematic drawing of the X-ray camera is shown in Figure 5a and a picture in Figure 5b.
itself. By using the masked part of the CCD-chip as a fast analogue buffer, 18 spectra can be taken with exposure times in the sub ms-range, and negligible dead time.
The conversion from spatial position on the detector to energy scale can be calculated from the Bragg angle equation (1), which defines the energy of the photons. The relationship between position and energy is almost linear in the energy range of interest. However, since the relationship is not completely linear, it is practically easier and principally better to avoid non-accurate geometrical measurements, to scale the spectra by using the energies of two edges or a reference EXAFS spectrum (e.g. a metal foil).2,25
Figure 5. The position sensitive detector at the ERSF (a) schematic drawing, (b) picture.
[image:27.595.66.522.319.608.2]IV. Turbo-XAFS
An experimental set-up where the I0 and It are simultaneously recorded is intrinsically
less sensitive to beam instabilities. Therefore, an experimental set-up, the so-called Turbo-XAFS, has been developed which is incorporated in the energy dispersive mode.26,27 In Turbo-XAFS (Figure 6), absorption spectra are recorded using two ionization chambers, positioned before and after the focus point, and thus the sample, respectively. A monochromatic beam is generated by scanning a narrow slit immediately after the curved crystal through the energy band produced by this crystal. This results in a scanning data acquisition mode (as in QEXAFS), however, without the corresponding instrumentation movements. Moreover, since the energies are measured step-by-step, simultaneous measurements of sample and reference and application of other detection techniques becomes possible. The Turbo-XAFS data acquisition method thus combines the high stability of the energy dispersive set-up with simultaneous normalization of the obtained data and allows a broader range of systems to be investigated due to the increased range of detection methods. A good time resolution of a few seconds is maintained.
Figure 6. Schematic
[image:28.595.232.512.441.667.2]Novel Combined Time-Resolved ED-XAFS / UV-Vis Set-up
For the research carried out in this thesis, a new set-up has been developed to study homogeneous catalytic system and which combines ED-XAFS with time-resolved UV-Vis spectroscopy. The two spectroscopic techniques can be applied simultaneously. The set-up is schematically drawn in Figure 3. The ED-XAFS data-acquisition set-up as described above is used. Time-resolved UV-Vis spectra are collected in a direction perpendicular to the x-ray beam of the EDXAFS.
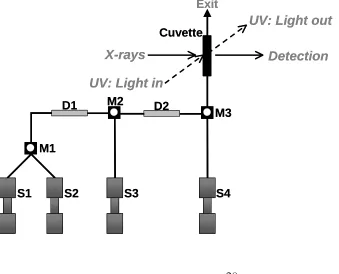
To be able to perform homogeneous reactions, a stopped-flow module (Biologic SFM-400) is used as schematically drawn in Figure 7. Four syringes (S1-S4) can be filled with 10 ml of reaction solution or solvent. The system is computer controlled and allows injection of precise volumes with controlled injection rates (and thus injection times). The solutions are injected using stepper motors via the delay lines (D1-D2) and the mixers (M1-M3) into the cuvette and finally, after measurement, through the cuvette into a waste flask. A total volume of 180 µl is injected each time to refresh all delay lines, mixers and the total cuvette content. The stopped-flow system has a dead time of ~3 ms, the time for the solutions to mix and reach the cuvette.
Figure 7. Schematic representation of the Stopped Flow Module with four syringes (S1-S4), three mixers
(M1-M3) and two delay lines (D1-D2).
X-rays Detection
S1 S2 S3
M1
M2 D1
Exit
Cuvette
S4 D2
M3
UV: Light in
UV: Light out
X-rays Detection
S1 S2 S3
M1
M2 D1
Exit
Cuvette
S4 D2
M3
UV: Light in
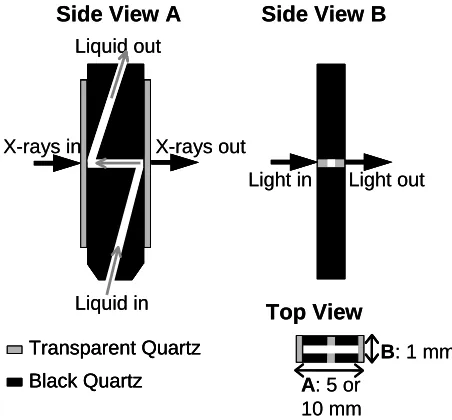
[image:29.595.66.405.478.752.2]Figure 8. Schematic representation of the SFM
cuvette allowing simultaneous UV-Vis and XAFS measurements (A = XAFS pathway, B = UV-Vis pathway; with A = 5 mm for Cu systems, and A = 10 mm for Pd systems; B = 1 mm).
[image:30.595.297.523.123.333.2]Special quartz cuvettes have been designed (Figure 8), in which the X-rays and UV-Vis light traverse perpendicular to each other (Figures 7 and 8). Cuts in different directions through the capillary are shown. Due to the different sensitivity of the two techniques for different (metal) systems, different path lengths are required (A = XAFS pathway, B = UV-Vis pathway) to allow simultaneous measurements on the same reaction mixture. For the Cu and Pd systems described in this thesis, B is 1mm and A is 5 and 10 mm, respectively. Moreover, due to the lower energy of the Cu K-edge, leading to a higher absorption of the x-rays in quartz, the quartz windows are polished from the standard 300 µm thickness (as used for Pd) down to 100 µm. A picture of the observation head of the stopped-flow module with cuvette and optical fibers is given in Figure 9.
Figure 9. Picture of the cuvette in the
observation head of the stopped-flow module with optical fibers connected.
A: 5 or
10 mm Transparent Quartz
Black Quartz Liquid in Liquid out
X-rays out X-rays in
Light in Light out
Side View A Side View B
Top View
B: 1 mm A: 5 or
10 mm Transparent Quartz
Black Quartz Transparent Quartz
Black Quartz Liquid in Liquid out
X-rays out X-rays in
Light in Light out
Side View A Side View B
Top View
As already mentioned before, due to the high photon flux at the sample position, sample degradation or heating can occur. Therefore, a shutter consisting of a small lead plate is placed between the incoming X-ray beam and the cuvette. In this way the beam can be taken away from the sample during for example the detector read-out, without moving the set-up or closing the complete beamline shutter. This method allows long time-resolved experiments with the shortest possible time of beam exposure on the sample. Moreover, simultaneously the shutter avoids saturation of the detector. An overview picture of the complete set-up is given in Figure 10. In the left upper part (the ‘back’ part) of the picture the detector can be seen. In the middle of the picture, the UV-Vis apparatus (white box) is observed. The optical fibers are connected to the observation head on the stopped-flow module. A waste tube on top of the observation head leads the chemicals out of the cuvette into a waste flask. The four syringes are recessed in the upper black box of the stopped-flow module, with the stepper motors in the lower one. The drive syringes are filled through the orifices on top of the syringe block (visible as white ring in picture 10).
References
1. M. A. Newton, A. J. Dent, J. Evans, Chem. Soc. Rev. 2002, 31, 83.
2. A. Fontaine, E. Dartyge, J. P. Itie, A. Jucha, A. Polain, H. Tolentine, G. Tourillon, Topics in Current Chem.1989, 151, 179.
3. A. J. Dent, Top. Catal.2002, 18(1-2), 27.
4. D. C. Koningsberger, B. L. Mojet, G. E. van Dorssen, D. E. Ramaker, Top. Catal.,2000,10, 143.
5. For example, X-ray Absorption, principles, applications, techniques of EXAFS, SEXAFS and XANES, eds. D. C. Koningsberger and R. Prins, Wiley Interscience, New York, 1988.
6. R. Frahm, Nucl. Instr. And Meth. In Phys. Res. A1988, 270, 578.
7. M. Richwin, R. Zaeper, D. Lutzenkirchen-Hecht, R. Frahm, Rev. Sci. Instrum.2002, 73, 1668. 8. L. M. Murphy, B. R. Dobson, M. Neu, C. A. Ramsdale, R. W. Strange, S. S. Hasnain, J.
Sychrotron Rad.1995, 2, 64.
9. R. P. Phizackerly, Z. U. Rek, G. B. Stephenson, S. D. Conradson, K. O. Hodgson, T.
Matsushita, H. Oyanagi, J. Appl. Cryst. 1983, 16, 220.
10. T. Matsushita, R. P. Phizackerley, Jpn. J. of Appl. Phys.1986, 20(11), 2223.
11. S. Pascarelli, T. Neisius, S. De Panfilis, M. Bonfirm, S. Pizzini, K. Mackay, S. David, A. Fontaine, A. San Miguel, J. P. Itie, M. Gauthier, A. Polian, J. Synchrotron Rad.1999, 6, 146. 12. S. Pascarelli, T. Neisius, S. De Panfilis, J. Synchrotron Rad.1999, 6, 1044.
13. J. Pellicer-Porres, A. San Miguel, A. Fontaine, J. Synchrotron Rad.1998, 5(5), 1250.
14. A. San Miguel, M. Hagelstein, J. Borrel, G. Marot, M. Renier, J. Synchrotron Rad. 1998, 5(6), 1396.
15. M. Hagelstein, C. Ferrero, M. Sanchez del Rio, U. Hatje, T. Ressler, W. Metz, Physica B1995,
208&209(1-4), 223.
16. J. Evans, Chem. Soc. Rev. 1997, 11.
17. A. Dent, J. Evans, M. Newton, J. Corker, A. Russell, M. B. Abdul Rahman, S. Fiddy, R. Mathew, R. Farrow, G. Salvini, P. Atkinson, J. Synchrotron Rad. 1999, 6(3), 381.
18. M. Hagelstein, A. San Miguel, A. Fontaine, J. Goulon, J. Phys. IV France1997, 7(C2), 879. 19. M. Hagelstein, C. Ferrero, U. Hatje, T. Ressler, W. Metz, J. Synchrotron Rad.1995, 2, 174. 20. R. Frahm, Nucl. Instr. And Meth. In Phys. Res. A1998, 270, 578.
21. M. Kovalenko, V. Mironov, V. Shaliapin, S. Tiutiunnikov, J. Alloys Compd.1999, 286, 26. 22. G. Salvini, D. Bogg, A. J. Dent, G. E. Derbyshire, R. C. Farrow, A. Felton, C. A. Ramsdale,
Physica B 1995, 208&209, 229.
23. M. Hagelstein, A. Fontaine, J. Goulon, Jpn. J. Appl. Phys.1993, 32, 240.
24. J. L. Hodeau, J. Vacinova, Y. garreau, A. Fontaine, M. Hagelstein, E. Elkaim, J. P. Lauriat, A. Prat, P. Wolfers, Rev. Sci. Instrum. 1995, 66, 1499.
25. A. M. Flank, A. Fontaine, A. Jucha, M. Lemonnier, D. Raoux, C. Williams, Nucl. Instr. and Meth.1983, 208, 651.
26. S. Pascarelli, T. Neisius, S. De Panfilis, J. Synchrotron Rad.1999, 6, 1044.
C
C
h
h
a
a
p
p
t
t
e
e
r
r
3
3
Cu K-edge EXAFS Characterization of Copper(I)
Arenethiolate Complexes in both
Solid and Liquid State:
Detection of Cu-Cu Coordinations
Abstract
This paper describes a structural characterization with EXAFS of the structure of copper(I) arenethiolate complexes in both solid and liquid state. Previously observed difficulties in the detection of the Cu-Cu interaction were attributed to anti phase behavior of different Cu–Cu-neighbor contributions. A data analysis procedure solely based on EXAFS parameters is presented which resolves these problems.
A careful analysis of the individual coordination shells and the use of different k
-weightings during the data analysis are shown to be an absolute necessity to obtain reliable
analysis results. During R-space fitting, the difference file technique is used to separate,
examine and compare the individual contributions. Using this technique their statistical significance and correctness can be determined. Anti phase behavior can be detected and
accounted for in this way. An additional mixed organocopper aggregate [Cu4(SAr)2(Mes)2]
with different Cu-sites is analyzed and proves the value of the above described analysis
procedure. Moreover, this newly developed EXAFS data analysis procedure is applicable to
any other EXAFS spectrum obtained.
Introduction
An important reaction in organic synthesis is the (selective) carbon-carbon bond
formation for which organocuprates [R2CuLi]1-3, [R2Cu(CN)Li]4,5, [R2Cu(CN)Li2]6 are most
widely applied.7-12 In our ongoing studies in the field of organo-copper and cuprate
chemistry, we have synthesized well defined heterocuprates derived from the
aminoarenecopper species (CuSC6H4CH(Me)NMe2-2)313-15 (1) which contain an S,N
-bidentate coordinated arenethiolate. This complex and related chiral copper arenethiolates promote selective group transfer of Grignard reagents (RMgX) to various organic substrates
16-24, e.g. chemo- and enantio-selective 1,4-addition to acyclic enones.17 Specifically, the latter
is the first reported case in which a copper complex, i.e. enantiopure 1 (R, R, R or S, S, S),
has been used in catalytic amounts to achieve enantioselective C-C bond
formation.17,18,20,22,23
The nature of the active cuprate species in these and related reactions is still largely unknown. Extended X-ray Absorption Fine Structure (EXAFS) spectroscopy provides local structural information about a specific element in a compound. In contrast to X-Ray Diffraction (XRD), EXAFS spectroscopy does not require long-range ordering of the material. Therefore, EXAFS can be applied in structural studies of molecules in any state of aggregation. EXAFS has been used for the elucidation of the co-ordination sphere of metal
centers in enzymes25,26 and for the determination of the structure of compounds in solid
state and liquid state.27 EXAFS is unique in unraveling the structure of species under
non-ambient conditions, as it can be applied in situ, under high pressure, temperature, and in the
presence of gasses. In organometallic chemistry the technique is complementary to Infra-Red spectroscopy (IR), Nuclear Magnetic Resonance spectroscopy (NMR) and XRD.
Studies of 63,65Cu NMR on organo-copper complexes, that could provide direct detailed
information about the coordination sphere of the copper site(s) in organocuprates, is hampered by the large nuclear quadrupole moment of the copper nucleus.
EXAFS spectroscopy of organo-copper and -cuprate mixtures is not
straightforward.[25,26,28-32] In the recent literature, several examples exist where Cu-Cu
coordinations were not detected or very difficult to detect by EXAFS, although in some cases XRD and/or other chemical information strongly suggested that Cu neighbors around
the photon-absorbing Cu ion were present.28,30-35 Sometimes Cu-Cu contributions were not
Cu···Cu distances.33 Examples are: (i) organocopper reagents (CuCN + BuLi and
CuCN·2LiCl)28,30-32, (ii) phenoxo-bridged dicopper(I) compounds34 and (iii)
copper(I)-thiolate clusters in the native protein [Cu-(αEC)nG].35
Figure 1. Schematic structures of Cu(I) arenethiolate complexes 1 and 2 as determined in solid state by
XRD, see references 13, 14 and 15 for full structural details.
In a quest to improve and understand the mechanistic aspects of the copper-based catalytic systems for enantioselective synthesis, we have applied EXAFS spectroscopy to identify the catalytic site(s) of the key intermediates in our system. In this study a systematic method for the analysis of Cu K-edge EXAFS spectra is presented that allows the proper detection of Cu-Cu contributions. The analysis method will be established by means of Cu K-edge EXAFS spectroscopy on the copper(I) arenethiolate species
(CuSC6H4CH(Me)NMe2-2)3 (further abbreviated as [Cu3(SAr*)3]; 1) (Figure 1). The structure
of this Cu arenethiolate complex is well known by single crystal XRD.13-15 The detectability
of the Cu-Cu coordination is investigated using the structural information obtained from single crystal XRD as a starting basis for the EXAFS analysis. The analysis strategy will be
demonstrated on the solid state [Cu3(SAr*)3] EXAFS spectra measured at room
temperature. Subsequently, the analysis procedure will be applied to the EXAFS data of
[Cu3(SAr*)3] dissolved in toluene measured at room temperature. The structure of a related
mixed organo(arenethiolate)copper(I) aggregate [Cu4(SAr)2(Mes)2] (2) (Figure 1), that
contains distinctly different Cu sites[21] has been determined with EXAFS using the newly
developed analysis procedure to confirm and demonstrate the validity of the developed analysis procedure.
The results of the EXAFS analysis provide essential information about the structure
and dynamics of the complexes and of the vibrating Cu3S3 ring of the trimeric
CuSAr-aggregate. This information will be important for an understanding of the formation of the kinetic intermediates between the organo-copper catalyst precursor of the Grignard reagent
1 2
S
Cu S
Cu S
Cu N
N N
S Cu R
Cu
R Cu S Cu
EXAFS Data-Analysis Methods
Reference Compounds
Theoretical references were used for the analysis of the Cu-S, Cu-N, Cu-Cu and Cu-C
coordinations. The theoretical references were generated using the code FEFF8.36 EXAFS
data from reference compounds were used to calibrate the theoretical references: Cu foil (7
µm) for Cu-Cu, ZnS for Cu-S37 and copper phthalocyanine for both Cu-N37 and Cu-C since
N and C are neighboring atoms in the periodic table. The XDAP program38 was used for
the reference data fitting. The theoretical references were optimized as described in ref. 39. Table 1a gives the FEFF8 input parameters. For all atom pairs a partially non-local potential
was used.36Vi is estimated to be 3 eV. S02, the Debye-Waller factor and Vr were varied until
the generated references optimally fit in R-space the first coordination shell of the
experimental EXAFS spectra of the above mentioned reference compounds (see Table 1b). The reference spectra were measured at room temperature, so the references are optimized for the room temperature situation. These calibrated references can then be used to fit the
EXAFS data of the samples down to very low values of k (k≥ 2.5 Å-1).39
Table 1a: FEFF8 input parameters used for the calculations of phase shifts and backscattering
amplitudes. For all atom pairs a partially non-local potential is used.36
Atom Pair σσσσ2 [Å2] S02 Vr [eV] Vi [eV]
Cu-Cu 0.009 0.92 4.0 3.0
Cu-S 0.005 0.88 2.5 3.0
Cu-C 0.000 0.92 1.0 3.0
Cu-N 0.002 0.84 -3.1 3.0
Table 1b: Best fit results for the experimental data using the theoretical references, including fitting
parameters. Fits were performed in R-space, k3-weighted.
Shell NXRD RXRD [Å] N R [Å] ∆∆∆∆σσσσ2 [Å2] E0 [eV] ∆∆∆∆k [Å-1] ∆∆∆∆R [Å]
Cu-Cu 12 2.56 11.9 2.54 0.000 -0.2 2.9-12.5 1.5-2.7
Cu-S 4 2.35 4.0 2.35 0.001 0.4 2.9-12.5 1.0-2.4
Cu-C 4 1.95 4.0 1.96 0.001 -1.2 3.5-12.5 1.0-2.0
R-space fit
The EXAFS data were analyzed using the commercially available program XDAP.38
This program allows multiple-shell fitting in R-space by minimizing the residuals between
both the magnitude and imaginary part of the Fourier transforms of the data and the fit. R
-space fitting has important advantages compared to the usually applied fitting in k-space, as
is extensively discussed in ref. 39. R-space fitting makes Fourier filtering unnecessary, which
is of great advantage if overlapping shells are present. Moreover, by choosing the proper
window in R-space the background subtraction errors and the presence of further higher
shells can be avoided. Another important advantage is that the amount of information
(number of independent data points, vide infra) is not decreased by a shortening of the range
of reliable data in k-space due to Fourier filtering errors.
Variance and Number of Independent Data Points
The errors in the structural parameters were calculated from the covariance matrix taking into account the statistical noise of the EXAFS data and the correlations between the different coordination parameters. The standard deviation per data point was estimated by
averaging 3 data scans. The number of independent data points (Nindp) was determined as
outlined in the "Reports on Standard and Criteria in XAFS Spectroscopy"40:
= 2*∆ *∆ +2
π
R k
Nindp . (1)
A large number of independent data points is especially important if several contributions are present and overlapping, to reliably fit the data and account for possible anti phase behavior of different contributions as shown in this study.
The variances of the magnitude and imaginary part of the Fourier transforms of fit and data were calculated according:
[
(
)
]
[
]
100d ) ( FT d ) ( FT ) ( FT variance 2 exp 2 exp model × ∫ − ∫ = R R k R R R k k n n
Difference File Technique
The difference file technique was applied together with phase-corrected Fourier
transforms to resolve the different contributions in the EXAFS data.39,41 The difference file
technique allows the observation of each individual contribution with respect to the other
contributions present in the EXAFS spectrum. The experimental χEXP(k) in the range Rmin
to Rmax can be described by summation of different model EXAFS contributions χMOD,j(k),
describing each coordination shell:
χ ( ) χ ( )
Shells
1 MOD,
EXP k k
j
j
∑
== . (3)
For each individual fitted contribution m the following equation should then logically
be valid:
∑
≠ = −
= j
m i
i m
i and 1
MOD,
EXP χ
χ
χ . (4)
The right side of this equation is further denoted as the difference file of shell m. A
sensitive and practical method to check whether a contribution is statistically significant
consists of a comparison of the amplitude of χm with the noise level present in the
difference file (the noise in the difference file is essentially the same as the noise in the experimental data). The total variances between total fit and data determine the correctness of the total analysis of the obtained EXAFS data. Moreover, the use of the difference file technique enables one to observe and examine the individual contributions and their position, intensity and influence on each other during the analysis procedure.
Weight Factor kn
The phase shift and backscattering amplitude of each neighboring atom are in
principle element specific and have a characteristic dependency of the wave factor k.
Normally, a combination of a k0- and k3-weighting during the EXAFS data-analysis is used
in order to separate each individual contribution.39 Moreover, in this study the use of both
k0- and k3-weighting was crucial in order to unravel interference effects of higher
co-ordination shells. Principally, different k-weightings should yield identical results and a good
fit in one weighting should be good in all other weightings applied.39 As discussed to be of
vital importance in this study, a fit in kn-weighting is only considered correct if other kn
-weightings show minima in variances too. In a system with many contributions such as in
this case, a single kn-weighting may well show several minima in variances obscuring the
Results
Single Crystal X-ray Diffraction on [Cu3(SAr*)3]
The crystal structure of the copper(I) arenethiolate [Cu3(SAr*)3] (1) is known from
obtained Single Crystal X-ray Diffraction data.13-15 The molecular structure of 1 shows a
triangular trimeric aggregate which comprises three identical (crystallographic related) CuSAr units that are held together by bridging of the thiolate sulfur atom between adjacent copper atoms. This structure is shown in Figure 2 in which only one of the three chelating arms is displayed completely. The position of the other two arms is indicated by showing only the nitrogen atom.
Figure 2. [Cu3(SAr*)3] (1) showing only one of the three chelating arms. The position of the other two arms is only indicated by the nitrogen atom. The C-atoms having about the same Cu···C distance have identical color.
The crystallographic Cu-neighbor distances are given in Table 2.13-15 Three carbon
neighboring atoms (further denoted as Ca) are located at a distance of 2.96 Å; three other
carbon atoms (further denoted as Cb), also relevant for the EXAFS analysis, can be
distinguished at a distance of 3.31 Å (see also Figure 2). The values for the coordination
distances for the Cu-S, Cu-Cu, Cu-Ca and Cu-Cb pairs are average values and the maximum
[image:40.595.66.328.352.566.2]Table 2: Single Crystal X-ray Diffraction on [Cu3(SAr)3] at 110K.
Ab-Sc Pair[a] N R [Å][b]
Cu-N 1 2.08
Cu-S 2 2.21 (± 0.02)
Cu···Cu 2 2.83 (± 0.00)
Cu···Ca 3 2.96 (± 0.02)
Cu···Cb 3 3.31 (± 0.14)
[a]
Abbreviations: Ab = absorber; Sc = scatterer. [b]
In between brackets the maximum deviation in distances is given.
EXAFS Data of [Cu3(SAr*)3] in the Solid State and Solution (at Room Temperature)
Figure 3 displays the Cu K-edge EXAFS data of [Cu3(SAr*)3] obtained in the solid
state (solid line) and solution (dotted line). The signal to noise ratio is very good, the data
can be analyzed up to k = 12.5 Å-1. The corresponding k0- and k3-weighted Fourier
transforms (for 2.9 < k < 12.5 Å-1) are given in respectively Figure 4a and 4b. It can be
observed that the intensity in the Fourier Transforms for the sample in solution is in both
k-weightings slightly higher. Moreover, for R > ~2 Å some small but significant changes in
the imaginary parts can be observed. A very important observation and crucial for the
EXAFS data-analysis to be applied in this study is the fact that for the k3-weighted Fourier
transforms almost no intensity is observed for R > 2.2 Å, whereas in the k0-weighted
Fourier transforms there is.
Figure 3. Raw EXAFS data of
[Cu3(SAr*)3] in solid state (solid line) and in solution (dotted line).
2 4 6 8 10 12 14
k / Å-1 -0.05
-0.04 -0.03 -0.02 -0.01 0.00 0.01 0.02 0.03 0.04 0.05
χχχχ /
/
/ /
k
Figure 4. Fourier transforms of the EXAFS data of [Cu3(SAr*)3] in solid state (solid line) and in solution (dotted line) for 2.9 < k < 12.5 Å-1 (a) k0-weighted and (b) k3-weighted.
First the [Cu3(SAr*)3] sample in solid state is analyzed since the crystal structure of this
sample is known from single crystal XRD. For the initial analysis in R-space of the
[Cu3(SAr*)3] EXAFS data a k0-weighted factor was used. In the next step the correctness of
the fit was checked by using a higher k-weighting (k1, k2, k3). Additionally, the influence of
an increasing number of coordination shells is observed carefully. The crystallographically
known values for the coordination numbers (N) and distances (R) (Table 2) were used as
starting input parameters. The data were analyzed by using an R-space fit with k-range of
2.9 < k < 12.5 Å-1 and R-range of 1.0 < R < 4.0 Å. Both the absolute and the imaginary
part of the Fourier transform were optimized. Each shell was fitted by iteratively allowing
the parameters (R, N, ∆σ2 and ∆E0) of that shell to be free. An increasing number of
co-ordination shells were used to fit the data. A two-shell fit N, Cu-S), a three-shell fit
(Cu-N, Cu-S, Cu-Cu), a four-shell fit (Cu-(Cu-N, Cu-S, Cu-Cu, Cu-Ca) and a five-shell fit (N,
Cu-S, Cu-Cu, Cu-Ca, Cu-Cb) were used to observe the influence of an increasing number of
co-ordination shells (Table 3).
1 2 3 4
R / Å
-0.03 -0.02 -0.01 0.00 0.01 0.02 0.03
FT
k
0 χχχχ
(k
)
solid solution
(a)
1 2 3 4
R / Å
-4.5 -3.5 -2.5 -1.5 -0.5 0.5 1.5 2.5 3.5 4.5
FT k
3 χχχχ
(k
)
solid solution
Table 3: EXAFS analysis of [Cu3(SAr)3] (solid, RT), k 0
-weighted fit, 2 – 5 shells.[a]
Ab-Sc Pair[b]
N R
[Å]
∆∆∆∆σσσσ2 [Å2]
∆∆∆∆E0 [eV]
Var. Im.[b]
Var. Abs.[b]
2-shell fit
Cu-N 2.1 2.20 0.040 7.8 k0: 2.0 0.96
Cu-S 2.0 2.21 0.000 2.4 k3: 4.3 2.0
3-shell fit
Cu-N 1.1 2.04 0.008 9.3 k0: 0.17 0.083
Cu-S 2.0 2.22 0.002 -0.2 k3: 1.4 0.64
Cu···Cu 6.9 2.96 0.040 -6.9
4-shell fit
Cu-N 1.0 2.08 0.005 1.0 k0: 0.037 0.063
Cu-S 2.0 2.21 0.003 0.4 k3: 0.44 0.21
Cu···Cu 2.8 3.00 0.014 -3.7
Cu···Ca 3.1 3.15 0.007 5.9
5-shell fit
Cu-N 1.0 2.05 0.001 0.6 k0: 0.017 0.012
Cu-S 1.9 2.23 0.003 -1.4 k3: 0.20 0.10
Cu···Cu 1.7 2.84 0.016 1.7
Cu···Ca 3.3 2.99 0.010 7.9
Cu···Cb 2.8 3.45 0.013 -1.3
[a]
Nindp = 20. Fit: R-space, 2.89 < k <12.50; 1.0 < R <4.0, all parameters iteratively refined.
[b]
The final five-shell total fit for [Cu3(SAr*)3] at RT (k0-weighted) is given in Figure 5a.
To show that the obtained fit is correct also the fit in an other k-weighting, i.e. k3, is shown
in Figure 5b, with the fit variances given in Table 3. As the difference file technique was used for the analysis of the EXAFS spectra, the individual contributions can be analyzed separately and should also fit correctly to be able to conclude a good analysis. In Figure 6 the Fourier transforms of the individual difference files are given, including the fits for the individual shells. The Cu-N contribution, displayed in Figure 6a is fitted very well in the
analysis range applied (1.0 < R < 4.0 Å). The Cu-S single-shell is the largest contribution in
the analysis and fits perfectly as can been seen in Figure 6b. In Figure 6c the Cu-Cu
contribution is shown. The Cu-Ca contribution given in Figure 6d fits very well and the
Cu-Cb contribution, which is displayed in Figure 6e, shows a little noise on the measured data.
It can be observed that both Cu-C contributions are larger than the Cu-Cu contribution. Only little noise can be seen in the Fourier Transforms of the difference files of the smallest
contributions (Cu-Cu, Cu-Ca, Cu-Cb). From these Figures it is clear that these individual
contributions are well above the noise, and thus are significant, and that they are fitted very
well. The final EXAFS co-ordination parameters are summarized in Table 3.
Figure 5. Fourier Transforms of raw data (solid line) and R-space fit (dotted line) (2.9 < k < 12.5 Å-1and 1.0 < R < 4.0 Å) with 5 coordination shells of [Cu3(SAr*)3] in solid state (a) k
0
-weighted, (b) k3-weighted.
1 2 3 4
R / Å -0.02
-0.01 0.00 0.01 0.02
FT k
0 χχχχ
(k
)
raw data fit
(a)
1 2 3 4
R / Å -4.5
-3.5 -2.5 -1.5 -0.5 0.5 1.5 2.5 3.5 4.5
FT k
3 χχχχ
(k
)
(b)
Figure 6. Fitted single shell contributions (dotted line) and difference files (solid line) of 5 shell R-space
fit (k0, 2.9 < k < 12.5, 1.0 < R < 4.0) of [Cu3(SAr*)3] in solid state measured at RT. (a) Cu-N, (b) Cu-S, (c) Cu-Cu, (d) Cu-Ca and (e) Cu-Cb.
1 2 3 4
R / Å
-0.010 -0.006 -0.002 0.002 0.006 0.010 FT k 0 χχχχ (k ) (a) Cu-N difference file single shell contribution
1 2 3 4
R / Å
-0.025 -0.015 -0.005 0.005 0.015 0.025 FT k 0 χχχχ (k ) (b) Cu-S difference file single shell contribution
1 2 3 4
R / Å
-0.002 -0.001 0.000 0.001 0.002 FT k 0χχχχ (k ) (c) Cu-Cu difference file single shell contribution
1 2 3 4
R / Å -0.005 -0.003 -0.001 0.001 0.003 0.005 FT k 0χχχχ (k )
(d) Cu-Ca
difference file single shell contribution
-0.003 -0.002 -0.001 0.000 0.001 0.002 0.003 FT k 0χχχχ (k ) difference file single shell contribution
The [Cu3(SAr*)3] was also measured in solution, i.e. in toluene. In Figure 7a the Fourier transforms (2.9 < k < 12.5 Å-1) of both the k0- and k3-weighted spectrum are given. In the k3-weighted spectrum a very low intensity of the signal is observed between 2 and 2.5 Å, whereas in the k0-weighted spectrum a clear signal remains present (note the differences in axis). A five-shell analysis has been performed using a k0-weighting. The crystallographic results are used as starting input parameters and the shells are iterative refined leaving step by step (shell by shell) all parameters free. The k0-weighted R-space fit is shown in Figure 7b and the results are given in Table 4. The correctness of the fit is also shown in Figure 7c for the k3-weighted fit using the obtained parameters, with the calculation variances given in Table 4.
Figure 7. (a) Fourier transform (2.9 < k < 12.5 Å-1) of raw EXAFS data of [Cu3(SAr)3] in solution k 0
-weighted (solid line), k3-weighted (dotted line). (b) k0-weighted and (c) k3-weighted R-space fit (2.9 < k < 12.5 Å-1and 1.0 < R < 4.0 Å) with 5 co-ordination shells of [Cu3(SAr*)3] in solution (RT).
1 2 3 4
R / Å
[image:46.595.64.518.366.756.2]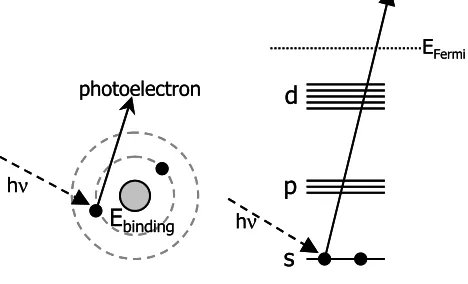


![Figure 2. [Cuarms is only indicated by the nitrogen atom. The C-atoms having about the same Cu3(SAr*)3] (1) showing only one of the three chelating arms](https://thumb-us.123doks.com/thumbv2/123dok_us/8521401.353159/40.595.66.328.352.566/figure-cuarms-indicated-nitrogen-atoms-having-showing-chelating.webp)
