arXiv:hep-ex/0101035v1 20 Jan 2001
SLAC-PUB-8742 BABAR-PROC-00/31
January, 2001
Physics at
B
A
B
AR
Christos Touramanis∗
Department of Physics
Oliver Lodge Laboratory, University of Liverpool L69 7ZE , Liverpool , U.K.
(for the BABAR Collaboration)
The BABAR detector at the SLAC PEP-II asymmetrice+e− collider has first started collecting
data in May 1999. A study of time-dependent CP-violating asymmetries in B0 → J/ψ KS0 and B0 → ψ(2S)KS0 decays has been performed on a data sample of 9.0 fb
−1 taken at the Υ(4S)
resonance and 0.8 fb−1 off-resonance, collected through July 2000. The preliminary result sin2β = 0.12±0.37 (stat)±0.09 (syst) is presented here, together with preliminary results on neutral and chargedB meson lifetimes andB0B0 mixing.
Presented at the
5th International Symposium on Radiative Corrections (RADCOR–2000)
Carmel CA, USA, 11–15 September, 2000
1
Introduction
The three–generation Standard Model can accommodate CP violation through the presence of a non-zero imaginary phase in the Cabibbo-Kobayashi-Maskawa (CKM) quark mixing matrix. However, existing measurements ofCP violation in the neutral kaon system cannot prove that the CKM phase is indeed the origin ofCP violation in nature.
The primary goal of the BABAR experiment at PEP-II is to elucidate this question by a series
of observations and measurements ofCP–violating effects in theB meson system. These measure-ments allow the extraction of the angles α, β and γ of the Unitarity Triangle, whose non–zero area [1] is a direct measure ofCP violation.
BABAR can also access the sides of the Unitarity Triangle through measurements of |Vub|,|Vcb|
in semileptonic B decays and |Vtd| in B0B0 mixing. This allows to overconstrain the Unitarity Triangle and perform stringent tests of the Standard Model.
Thus, high statistics, a clean environment and broad access to the rich phenomenology of the B sector will allow BABAR to improve our knowledge of the overall B decay picture and probe
New Physics at higher energy scales. A broad heavy flavor physics programme is also ongoing in BABAR.
2
PEP-II
The PEP-II B Factory [2] is an e+e− colliding beam storage ring complex at SLAC designed to
produce a luminosity of 3x1033cm−2s−1at a center–of–mass energy of 10.58 GeV (Υ(4S) resonance).
During the 2000 run PEP-II has exceeded this luminosity, whileBABAR, with a logging efficiency
of>95%, has routinely accumulated data above its design daily rate of 135 pb−1.
The machine has asymmetric energy beams, with a High Energy Ring (HER, 9.0 GeV electrons) and a Low Energy Ring (LER, 3.1 GeV positrons). These correspond to a center–of–mass boost of βγ=0.56 and lead to an average separation of βγcτ=250µm between the two B mesons vertices, allowing the measurement of time–dependentCP–violating decay rate asymmetries.
At theΥ(4S) resonanceB mesons can only be produced asB+B−or coherentB0B0 pairs. The time evolution of a coherentB0B0 pair is coupled in such a way that theCP or flavor of one B at
decay time t1 can be described as a function of the otherB (Btag) flavor at its decay time t2 and
the signed time difference ∆t=t1−t2.
3
B
AB
AR3.1 Detector description [2]
The volume within the 1.5T BABAR superconducting solenoid contains a five layer silicon strip
3.2 Particle reconstruction and identification [2]
Charged particle tracking using the SVT and DCH achieves a resolution of (δpT/pT)2= (0.0015pT)2+
(0.005)2, where p
T is the transverse momentum in GeV/c. The SVT with a typical resolution of
10µm per hit provides excellent vertex resolution both in the transverse plane and inz. The typical fully reconstructed single B decay vertex resolution in z is 50µm. Photons are reconstructed in the EMC, yielding mass resolutions of 6.9 MeV/c2 forπ0 → γγ and 10 MeV/c2 forK0
S → π0 π0.
Leptons and hadrons are identified using a combination of measurements from all the BABAR
components, including the energy loss dE/dx in the helium-based gas of the DCH (40 samples maximum) and in the silicon of the SVT (5 samples maximum). Electron identification is mainly based on the characteristics of their shower in the EMC, while muons are identified in the IFR and confirmed by their minimum ionising signal in the EMC. Excellent kaon identification in the barrel region is provided by the DIRC, which achieves a separation of>3.4σ in the range 0.25–3.5 GeV/c.
4
B
reconstruction
A variety of inclusive, semiexclusive and exclusive reconstruction methods are applied on theBABAR
data, covering semileptonic and pure hadronic decay modes. The correspondingB samples have different sizes and purity levels and are used for different types of studies (Branching Fraction mea-surements, studies of the dynamics of certain decay chains). We will focus here on the cases where some information (final state(s), charge, CP or flavor content, decay vertex) can be reconstructed for bothB mesons in the event.
4.1 Exclusive B sample
B0 and B± mesons are reconstructed in the following hadronic modes of definite flavor: B0 →
D(∗)−π+, D(∗)−ρ+, D(∗)−a+1,J/ψ K∗0,B− →D0 π− and B− → D∗0 π− †. All final state particles are reconstructed. The selections have been optimised for signal significance, using on–peak, off– peak and simulated data. Charged particle identification, mass(or mass difference) and vertex constraints are used wherever applicable. The signal for each decay mode is identified in the two-dimensional distribution of the kinematical variables ∆EandmES: ∆E =Erec∗ −Eb∗is the difference
between the B candidate energy and the beam energy and mES =
q
E∗2
b −p∗rec2 is the mass of a
particle with a reconstructed momentum p∗rec = P
ip∗i assumed to have the beam energy, as is
the case for a true B meson. In events with several B candidates only the one with the smallest ∆E is considered. The ∆E and mES variables have minimal correlation. The resolution in mES is ≈3 MeV/c2 and is dominated by the beam energy spread. The resolution in ∆Eis mode dependent and varies in the range of 12–40 MeV. For each mode a rectangular signal region is defined by the three standard deviation bands in mES (5.27 < mES < 5.29 GeV/c2) and ∆E (mode dependent
interval). For each mode the sample composition is determined by fitting the mES distribution
for candidates within the signal region in ∆E to the sum of a single Gaussian representing the signal and a background function introduced by the ARGUS collaboration [3]. The purity of each subsample is computed as the ratio of the area of the Gaussian in the±3σ range over the total area in this range. Figure 1 shows the mES distributions for the summed hadronic B0 and B± modes
with the fits superimposed.
Beam-Energy Substituted Mass (GeV/c2)
Combinations/0.0025 GeV/c
2
B
AB
ARBeam-Energy Substituted Mass (GeV/c2)
Combinations/0.0025 GeV/c
2
B
AB
AR [image:4.612.100.525.101.304.2](a)
(b)
Figure 1: mESdistribution for all the hadronic modes for (a)B0 and (b)B±. The complete fit and
its ARGUS [3] background content are also shown. The number of signal events in allB0 andB± modes are 2577±59 and 2636±56, with purity of≈86% and≈89% respectively.
4.2 Flavor tagging
After removal of the daughter tracks of the reconstructed Brec in an event, the remaining tracks
are used to determine the flavor of the other B meson (Btag), and this ensemble is assigned a tag
flavor, either B0 or B0.
For each of the tagging methods used we define an effective tagging efficiency Qi = εi ×
(1−2wi)2, whereεi is the fraction of events tagged by this methodiandwi is the mistag fraction, i.e. the probability of incorrectly assigning the opposite tag to an event using this method. A dilution factor is defined asD = 1−2w and is extracted from the data for each method.
The Lepton category uses the presence and charge of a primary lepton from the decaying b quark. Both electrons and muons are used, with a minimum center-of-mass momentum requirement of 1.1 GeV/c. If both an electron and a muon candidate satisfy this requirement, only the electron is taken into account. Mistag arises from (a) pions seen as leptons and (b) softer opposite-sign leptons coming from charm semileptonic decays.
The Kaoncategory is based on the total charge of all identified Kaons. Events with conflicting
LeptonandKaontags are excluded from both categories.
For events not tagged with the previous methods, a variety of available particle identification and kinematic variables are fed in a Neural Network whose design and training aims at exploiting the information present in this set of correlated quantities. It is sensitive to the presence of primary and cascade leptons, charged kaons and soft pions fromD∗ decays. In addition, the charge of
tag isB0 ifxN T is negative, and B0 otherwise. Events with|xN T|>0.5 are assigned to theNT1
tagging category and events with 0.2 < |xN T| < 0.5 to the NT2 tagging category. Events with |xN T|<0.2 have very little tagging power and are rejected.
4.3 ∆t calculation and resolution
Since no stable charged particle emerges from theΥ(4S) decay point, the production point of the B mesons and thus their individual decay times cannot be determined. However the decay time difference ∆t between the two is sufficient for the description of a coherent B meson pair (decay length difference technique).
The event topology is sketched in Fig. 2. In the boost approximation used in BABAR the decay
time difference is calculated as : ∆t= ∆z/c < βγ >, where the small flight path of theB mesons perpendicular to the z exis is ignored.
Actually, the small effects arising from the tilt of the PEP-II beams with respect to theBABARz
axis (20 mr), fluctuations in the beam energies, theBmeson transverse momentum in theΥ(4S) rest frame, have been studied and are taken into account either in the calculations or in the systematic errors as appropriate.
∆z Y(4S)
Bopp
Brec
Beam spot y
[image:5.612.177.432.304.468.2]z
Figure 2: Event topology showing the twoB production and decay points. The figure is not drawn to scale; it has been expanded in the y direction.
The resolution σz for the fully reconstructed B is found in the simulation to be 45–65µm,
depending on the mode. The resolutionσz for the tag side is≈125µm, with a small bias of 25µm
5
B
lifetime measurements
The observed ∆t distribution for a set of B pair events in the presence of the resolution function
Ris :
F(∆t) = Γ exp(−Γ|∆t|)⊗ R( ∆t; ˆa) (1)
where ˆais the set of parameters describing the resolution function.
TheBmeson lifetimes are extracted with unbinned maximum likelihood fits that take individual event ∆terrors into account. Our preliminary results are :
τB0 = 1.506±0.052 (stat)±0.029 (syst) ps
τB+ = 1.602±0.049 (stat)±0.035 (syst) ps
τB+/τB0 = 1.065±0.044 (stat)±0.021 (syst)
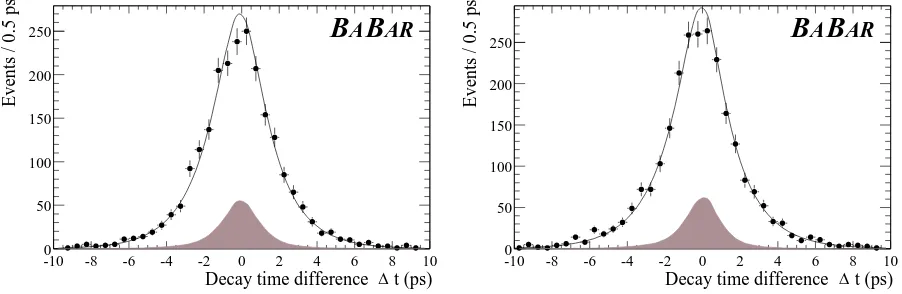
The only background source is combinatorial and it is estimated from the side-bands of the beam energy substituted mass variable. The main systematic error comes from the resolution modeling and parameters. The two proper time fits are shown in Figure 3.
t (ps) ∆ Decay time difference
-10 -8 -6 -4 -2 0 2 4 6 8 10
Events / 0.5 ps
0 50 100 150 200
250
B
AB
ARt (ps) ∆ Decay time difference
-10 -8 -6 -4 -2 0 2 4 6 8 10
Events / 0.5 ps
0 50 100 150 200
[image:6.612.73.524.302.449.2]250
B
AB
ARFigure 3: ∆t distributions for the B0 (right) and B± (left) candidates. The result of the lifetime
fit is superimposed. The hatched areas represent the background content of the event samples.
6
B
0mixing measurements
Mixing allows the two neutralB mesons in the B0B0 coherent state to decay with the same flavor
(mixed events) or the opposite flavor (unmixed events). In a perfect detector one would then observe a time dependent oscillation in the rates of unmixed(+) and mixed(-) events :
f±(∆t; Γ,∆md) =
1 4Γ e
−Γ|∆t| [ 1 ± cos ∆m
d∆t] (2)
where ∆md is the difference between the mass eigenstates BH0 and BL0. Due to imperfect tagging
and vertex determination the observed rates become :
F±(∆t; Γ,∆md,D,aˆ) =
1 4Γ e
−Γ|∆t| [ 1 ± D ×cos ∆m
whereD is the dilution factor (section 4.2) andR is the ∆tresolution (section 4.3)
An unbinned maximum likelihood fit that takes into account individual event ∆t errors and tagging category is performed on events from the exclusively reconstructedB0sample (section 4.1), after tagging (section 4.2) has been performed. The value of ∆md is fitted simultaneously with
the individual dilution factors for each tagging category. This information is later used in the sin2β extraction. Our preliminary result for ∆md is :
∆md= 0.516±0.031(stat.)±0.018(syst.)¯hps−1
A sample of events where a semileptonic (D∗ℓν) instead of a hadronicB0 decay has been
recon-structed (7517 events) are analysed using the same method and fit. The preliminary result for ∆md
from this sample is :
∆md= 0.508±0.020(stat.)±0.022(syst.)¯hps−1
Combining the ∆md results from the hadronic and semileptonicB samples we obtain the
prelimi-nary result :
∆md= 0.512±0.017(stat.)±0.022(syst.)¯hps−1
The main sources of systematic errors are the ∆t resolution function, Monte Carlo statistics and theB± background in the semileptonic sample.
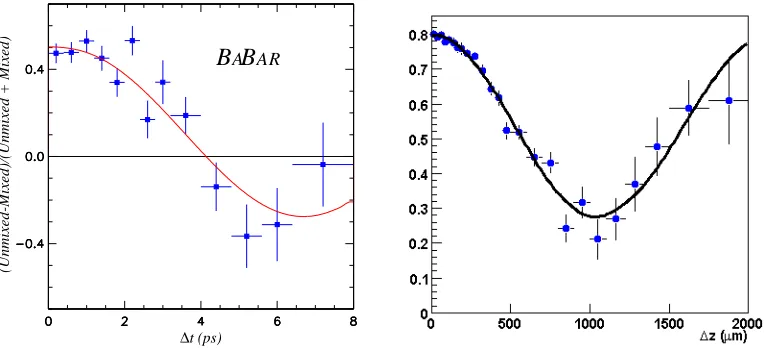
In an independent analysis a more abundant but less pure sample of dilepton events has been used. In this inclusive approach the mistag arising from cascade leptons and theB± fraction are extracted from the same fit as ∆md. Our preliminary result for ∆md is :
∆md= 0.507±0.015(stat.)±0.022(syst.)¯hps−1
The results from the hadronic and dilepton samples are shown in Figure 4. The tagging performance parameters for each tagging method (category) are extracted from the fully reconstructed sample fits (hadronic and semileptonic) and are shown in Table 1.
Tagging Category ε(%) w (%) Q(%)
Lepton 11.2±0.5 9.6±1.7±1.3 7.3±0.7
Kaon 36.7±0.9 19.7±1.3±1.1 13.5±1.2
NT1 11.7±0.5 16.7±2.2±2.0 5.2±0.7
NT2 16.6±0.6 33.1±2.1±2.1 1.9±0.5 all 76.7±0.5 27.9±1.6
Table 1: Tagging preformance parameters measured from the mixing maximum-likelihood fit for the fully-reconstructedB0 sample. The uncertainties onεand Q are statistical only.
7
The
sin2
β
measurement
If one of the neutralB mesons(Btag) of the coherentB0B0pair decays to a definite flavor eigenstate
at timettag and the otherB decays to aCP–even eigenstate like J/ψ KS0 orψ(2S)K
0
∆t (ps)
(Unmixed-Mixed)/(Unmixed + Mixed)
[image:8.612.109.491.84.259.2]B
AB
ARFigure 4: The observed time dependent asymmetries between unmixed and mixed events for the fully reconstructed (left) and dilepton (right) B0 samples described in the text. The curves show the fit results.
then in a perfect detector the following decay rates would be observed :
f±( ∆t; Γ,∆md,sin 2β) =
1 4Γ e
−Γ|∆t| [ 1 ± sin 2β×sin ∆m
d∆t] (4)
where ∆t=tCP −ttag and the (+) or (−) sign indicates whether theBtag is tagged as aB0 or a
B0 respectively. In the presense of the dilution factor D and ∆t resolution R the observed rates become :
F±( ∆t; Γ,∆md,Dsin 2β,ˆa) =
1 4Γ e
−Γ|∆t| [ 1± Dsin 2β×sin ∆m
d∆t]⊗ R( ∆t; ˆa) (5)
The time dependent decay rate asymmetryACP(∆t) is aCP–violating observable which (neglecting resolution effects) is approximately proportional to sin2β:
ACP(∆t) = F+(∆t) − F−(∆t)
F+(∆t) + F−(∆t)
∼ Dsin 2β×sin ∆md∆t (6)
7.1 Analysis procedure
The extraction of sin2β from the data follows the following steps :
• Selection of the signal B0/B0 → J/ψ K0
S and B0/B0 → ψ(2S)KS0 events, detailed in the following section. Backgrounds and in particular any admixture with the “wrong”CP content have to be kept at a minimum level.
• Measurement of ∆t. The resolution is studied using simulated events and its parameters are actually extracted from real data, as described in section 4.3.
• Determination of the flavor of the Btag, as described in section 4.2. The dilution factorsDi
• Extraction of the amplitude of theCP asymmetry and the value of sin2β with an unbinned maximum likelihood fit, desribed in the following.
A blind analysis has been adopted for the extraction of sin2β. A technique that hides the result of the fit by arbitrarily flipping its sign and adding an arbitrary offset, without affecting the error on the fitted parameters or their correlations, was used. Moreover, the visual CP asymmetry in the ∆t distribution is hidden by multiplying ∆tby the sign of the tag and adding an arbitrary offset. Such an approach allows to optimise and finalise the event selection and fitting strategy as well as perform a variety of validation and stability checks without the posibility of any experimenter’s bias.
7.2 Event samples
The CP sample contains B0 candidates reconstructed in theCP eigenstates J/ψ K0
S orψ(2S)KS0.
The charmonium mesons are reconstructed through their decays to e+e− and µ+µ−, while the ψ(2S) is also reconstructed through its decay to J/ψ π+π−. The KS0 is reconstructed through its decays to π+π− andπ0π0.
Utilisation of the exclusively reconstructed B samples (section 4.1) for the characterisation of the tagging and vertexing performance and quality has already been described. In addition 570 B+ →J/ψ K+ candidates and 237 B0 →J/ψ(K∗0 →K+π−) candidates have been reconstructed and used extensively in validation analyses.
7.3 Selection of events in the CP sample
Events are required to have at least four reconstructed charged tracks, a vertex within 0.5 cm of the average position of the interaction point in the transverse plane, total visible energy greater than 5 GeV, and second-order normalized Fox-Wolfram moment[4] (R2 =H2/H0) less than 0.5.
For theJ/ψ orψ(2S)→e+e− (µ+µ−) candidates, at least one of the decay products is required to be positively identified as an electron (muon) in the EMC (IFR). Electrons outside the acceptance of the EMC are accepted if their DCH dE/dx information is consistent with the electron hypothesis. Looser particle identification criteria are applied on the second electron (muon) candidates. In the muon case, a minimum ionising signature in the EMC is required.
J/ψ candidates are selected with an invariant mass greater than 2.95(3.06) GeV/c2 for e+e− (µ+µ−) and smaller than 3.14 GeV/c2 in both cases. Theψ(2S) candidates in leptonic modes must have a mass within 50 MeV/c2 of theψ(2S) mass. The lower bound is relaxed to 250 MeV/c2 for the
e+e−mode. For theψ(2S)→J/ψ π+π−mode, mass-constrainedJ/ψ candidates are combined with pairs of oppositely charged tracks considered as pions, and ψ(2S) candidates with mass between 3.0 GeV/c2 and 4.1 GeV/c2 are retained. The mass difference between theψ(2S) candidate and the
J/ψ candidate is required to be within 15 MeV/c2 of the known mass difference. KS0 candidates reconstructed in the π
+π− mode are required to have an invariant mass,
com-puted at the vertex of the two tracks, between 486 MeV/c2 and 510 MeV/c2 for theJ/ψ K0
S selection, and between 491 MeV/c2 and 505 MeV/c2 for the ψ(2S)KS0 selection.
For the J/ψ KS0 mode we also consider the decay of the K
0
S into π
0π0. For pairs of π0
candi-dates with total energy above 800 MeV we determine the most probableK0
S decay point along the path defined by theKS0 momentum vector and the primary vertex of the event. The decay-point probability is the product of theχ2 probabilities for each photon pair constrained to theπ0 mass. We require the distance from the decay point to the primary vertex to be between −10 cm and +40 cm and the K0
S mass measured at this point to be between 470 and 536 MeV/c
BCP candidates are formed by combining mass-constrainedJ/ψ orψ(2S) candidates with
mass-constrainedK0
S candidates. Cuts on the colinearity of flight vertex and momentum of the KS0 (for π+π− decays), the cosine of the helicity angle of the J/ψ orψ(2S) in theB candidate rest frame (e+e− and µ+µ− modes) or the cosine of the angle between the BCP candidate three-momentum
vector and the thrust vector of the rest of the event (ψ(2S) → J/ψ π+π− mode) are applied to
achieve the required signal purity.
BCP candidates are identified in themES–∆E plane (see section 4.1). Signal event yields and
purities, determined from a fit to the mES distributions after selection on ∆E, are presented
in Table 2. The CP candidate events are 168 with a purity of 95.6%. In 120 of these events there is information on the flavor of the otherB. These events are used in the final fit for sin2β. Distributions of ∆E and mES are shown in Figures 5 and 6.
Final state All events Purity Tagged events J/ψ KS0 (K
0
S →π
+π−) 124 96% 85
J/ψ K0
S (K
0
S →π
0π0) 18 91% 12
ψ(2S)KS0 27 93% 23
Table 2: Event yields for theCP samples used in this analysis. The total number of events in the mES–∆E signal box and their purity, as well as the size of the subsamples where the other B is
tagged, are shown.
7.4 Extracting sin2β
The ∆tof the 120 selected and tagged events is fitted to the expected time evolution (equation 5) with an unbinned maximum likelihood fit. Individual event errors on ∆tare taken into account. The resolution determined on the fully reconstructed sample and the mistag factorwicorresponding to
the tagging category for each event are used in the fit. The ∆mdare fixed to the nominal PDG [5]
values of τB0 = 1.548 ps and ∆md= 0.472 ¯hps−1 respectively. The resulting errors on sin2β due
to these uncertainties are 0.002 and 0.015.
7.5 Fit validation, systematics studies and null CP tests
Knowledge of the mistag fractions, description of the ∆t resolution and backgrounds are (in that order) the main sources of systematic errors. All these have been extracted from real data. Real data, fully simulated Monte Carlo, and “Toy” Monte Carlo samples have been used to validate the method and implementation of the fit, to rule out possible biases from the method itself, and to assess the size of systematic errors.
[image:10.612.156.454.223.285.2]-0.1 -0.05 0 0.05 0.1 ∆ E (GeV) 0 20 40 60
5.2 5.225 5.25 5.275 5.3
Beam-energy substituted mass (GeV/c2)
Entries/2.5 MeV/c
2
B
A
B
AR
-0.2 -0.1 0 0.1 0.2 ∆ E (GeV) 0 2 4 6 8
5.2 5.225 5.25 5.275 5.3
Beam-energy substituted mass (GeV/c2)
Entries/2.5 MeV/c
2
[image:11.612.86.517.101.277.2]B
A
B
AR
Figure 5: J/ψ K0
S signal. Left: KS0→π+π−, Right: KS0 →π0π0
-0.1 -0.05 0 0.05 0.1 ∆ E (GeV) 0 2.5 5 7.5 10
5.2 5.225 5.25 5.275 5.3
Beam-energy substituted mass (GeV/c2)
Entries/2.5 MeV/c
2
[image:11.612.192.407.340.506.2]B
A
B
AR
Figure 6: ψ(2S)KS0 (K
0
S →π
+π−) signal.
Sample Apparent CP-asymmetry Hadronic charged B decays 0.03±0.07
Hadronic neutralB decays −0.01±0.08
J/ψ K+ 0.13±0.14
J/ψ K∗0 (K∗0 →K+π−) 0.49±0.26
[image:11.612.163.443.572.646.2]7.6 Results
The maximum-likelihood fit for sin2β on the full tagged sample ofB0/B0→J/ψ KS0andB
0/B0 →
ψ(2S)K0
S events yields the preliminary result :
sin2β = 0.12±0.37 (stat)±0.09 (syst) (7)
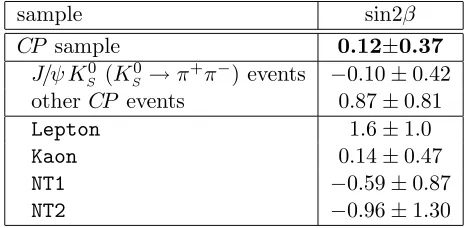
The results of the fit for each type ofCP sample and for each tagging category are given in Table 4. The contributions to the systematic uncertainty are summarized in Table 5. The ∆tdistributions for B0 and B0 tags are shown in Fig. 7 and the raw asymmetry as a function of ∆t is shown in
Fig. 8. The probability of obtaining a value of the statistical error larger than the one we observe is estimated at 5%. Based on a large number of full Monte Carlo simulated experiments with the same number of events as our data sample, we estimate that the probability of finding a lower value of the likelihood than our observed value is 20%.
sample sin2β
CP sample 0.12±0.37
J/ψ K0
S (KS0→π+π−) events −0.10±0.42 other CP events 0.87±0.81
Lepton 1.6±1.0 Kaon 0.14±0.47
NT1 −0.59±0.87
[image:12.612.186.420.252.366.2]NT2 −0.96±1.30
Table 4: sin2β fit results from the entire CP sample and various subsamples.
Source of uncertainty Uncertainty on sin2β
uncertainty on τB0 0.002
uncertainty on ∆md 0.015
uncertainty on ∆z resolution for CP sample 0.019 uncertainty on time-resolution bias forCP sample 0.047 uncertainty on measurement of mistag fractions 0.053 different mistag fractions for CP and non-CP samples 0.050 different mistag fractions for B0 and B0 0.005
background in CP sample 0.015
total systematic error 0.091
[image:12.612.114.499.422.558.2](a)
entries/0.4 ps
∆
t (ps)
(b)
B
A
B
AR
0 2.5 5 7.5 10
-5 0 5
0 2.5 5 7.5 10
[image:13.612.157.388.82.283.2]-5 0 5
Figure 7: Distribution of ∆t for (a) the B0 tagged events and (b) the B0 tagged events in the
CP sample. The error bars plotted for each data point assume Poisson statistics. The curves correspond to the result of the unbinned maximum-likelihood fit and are each normalized to the observed number of taggedB0 orB0 events.
-1 -0.5 0 0.5 1
-5 0 5
∆t (ps)
Asymmetry
B
A
B
AR
Preliminary
Figure 8: The rawB0-B0 asymmetry (NB0−N
B0)/(NB0+N
B0) with binomial errors as function
of ∆t. The solid curve represents our central value of sin2β. The two dotted curves correspond to one statistical standard deviation from the central value. The curves are not centered at (0,0) in part because the probability density functions are normalized separately forB0 and B0 events, and ourCP sample contains an unequal number ofB0 andB0 tagged events (70B0 versus 50B0). The χ2 between the binned asymmetry and the result of the maximum-likelihood fit is 9.2 for 7
[image:13.612.201.395.363.559.2]8
Conclusions and prospects
The firstBABARmeasurement of theCP-violating asymmetry parameter sin2βhas been presented :
sin2β= 0.12±0.37 (stat)±0.09 (syst) (preliminary) (8)
BABARaims at collecting more than 20 fb−1of data by the end of Run 1 in fall 2000. A measurement
of sin2β with a precision better than 0.2 is expected early in 2001.
Very competitive preliminary results have also been presented for theBmeson lifetimes, as well as the first measurements of B0B0 mixing at the Υ(4S). These measurements will also benefit in the near future from the expected significant increase in statistics.
References
[1] C. Jarlskog, inCP Violation, C. Jarlskog ed., World Scientific, Singapore (1988).
[2] BABAR Collaboration, B. Aubert et al., “The first year of the BABAR experiment at
PEP-II”, BABAR-CONF-00/17, submitted to the XXXth International Conference on High Energy
Physics, Osaka, Japan.
[3] ARGUS collaboration, H. Albrechtet al., Z Phys. C48, 543 (1990).
[4] G. C. Fox and S. Wolfram, Phys. Rev. Lett.41, 1581 (1978).
![Figure 1: mES distribution for all the hadronic modes for (a) B0 and (b) B±. The complete fit andits ARGUS [3] background content are also shown](https://thumb-us.123doks.com/thumbv2/123dok_us/8064096.226420/4.612.100.525.101.304/figure-distribution-hadronic-complete-andits-argus-background-content.webp)