Comparative Analysis of White Blood Cell by
Different Segmentation Methods Using
Knowledge Based Learning
Rajwinder Kaur
1, Harpreet Kaur
2Student, Dept. of CSE, Doaba Institute of Engineering and Technology, Kharar, Punjab, India1
Assistant Professor, Dept. of CSE, Doaba Institute of Engineering and Technology, Kharar, Punjab, India2
ABSTRACT: Blood cells extraction and detection is very much important for all human beings, because there are WBCs, RBCs, Platelets in our blood, White blood cell count gives the vital information that help diagnosis many of the patient’s sickness. This work presents a new adaptive approach of extracting and detecting the WBCs in blood sample microscopic images. In the research work the author used two different approaches one is k-means clustering algorithm and second is Hough transform. Author also used to study the different parameters like radius of the cells, calculate the time for getting the output from te sample input image.
KEYWORDS: WBCs, blood cells, Hough transform, k-means Clustering.
I.INTRODUCTION
The major challenges in computer vision is to determining the location, shape, or quantity of instances of a particular object. An example is to find only the circular objects from an input image. While numerous feature extraction techniques are openly available for circle detection, one of the most robust and commonly used methods is the Circular Hough Transform. The goal of this application note is to provide the reader with an understanding of the operations behind a CHT. An overview of the Hough Transform and k-means clustering is given.
Generalized Hough Transform
The Generalized Hough Transform is a modified version of the Hough Transform that not only searches for analytically defined shapes, but also arbitrary shapes. This method uses the principle of template matching, which relies on detecting smaller elements matching a template image.
Circular Hough Transform
The Circular Hough Transform set the radius to a constant value or provide the user with the option of setting prior to running the application. For each edge point, a circle is drawn with that point as origin and radius. The CHT depends on a pre-define value of the circles radius.
k- Means Clustering
One of the clustering algorithms is K-mean clustering, K-means clustering algorithm is used to cluster observations into groups of related observations without any prior knowledge of those relationships. The k-means algorithm is one of the simplest clustering techniques and it is commonly used in medical imaging, biometrics and related fields. In the very first step, a number of desired clusters, k, is chosen.
II.RELATED WORK
S.Kareem [2] et al described a novel idea to identify the total number of red blood cells (RBCs) as well as their location in a Giemsa stained thin blood film image. The method utilizes basic knowledge on cell structure and brightness of the components due to Giemsa staining of the sample and detects and locates the RBCs in the image.
Harsh Kapadia [3] et al has stated predominantly emphases on two algorithms Hough Transform and the Sub-Pixel Edge Detection and their application on 1-Dimensional barcode scanning. The system is meant to verify Barcode on-line. It primarily focuses on two aspects of barcode verification. One is two detect the angle if barcode is skewed in the image and correct the same. The other is to detect the edges of a barcode in real time blurred image using sub-pixel edge detection.
Siyu Guo [4] et al has stated that the Hough transform has been a frequently used method for detecting lines in images. However, when applying Hough transform and derived algorithms using the standard Hough voting scheme on real world images, the methods often suffer considerable degeneration in performance, especially in detection rate, because of the large amount of edges given by complex background or texture.
Marcin Smereka [5] et al has modified the Hough transform, it was proposed that improves the detection of low-contrast circular objects. The original circular Hough transform and its numerous modifications were discussed and compared in order to improve both the efficiency and computational complexity of the algorithm.
J. Poomcokrak [6] et al presented Blood cell counting by laboratory task utilizes hemocytometer and microscope. The conventional task depends on physician skill. It is laborious.
Jiqiang Song [7] et al concluded that Hough Transform is recognized as a powerful tool for graphic element extraction from images due to its global vision and robustness in noisy or degraded environment. However, the application of HT has been limited to small-size images for a long time. Besides the well-known heavy computation in the accumulation, the peak detection and the line verification become much more time-consuming for large-size images.
Ji. Y. Xie [8] et al introduced a new Randomized Hough Transform aimed at improving curve detection accuracy and robustness, as well as computational efficiency. Robustness and accuracy improvement is achieved by analytically propagating the errors with image pixels to the estimated curve parameters. The errors with the curve parameters are then used to determine the contribution of pixels to the accumulator array. The computational efficiency is achieved by mapping a set of points near certain selected seed points to the parameter space at a time.
Clark F. Olson [9] et al stated the techniques to perform fast and accurate curve detection using constrained Hough transforms, in which localization error can be propagated efficiently into the parameter space. We first review a formal definition of Hough transform and modify it to allow the formal treatment localization error. We then analyze current Hough transform techniques with respect to this definition.
Lorenzo Putzu, and Cecilia di Ruberto [10] et al stated that the counting and analysis of blood cells allows the evaluation and diagnosis of a vast number of diseases. in particular, the analysis of white blood cells (wbcs) is a topic ofgreat interest to hematologists. nowadays the morphological analysis of blood cells is performed manually by skilled operators. this involves numerous drawbacks, such as slowness of the analysis and a nonstandard accuracy, dependent on the operator skills. in literature there are only few examples of automated systems in order to analyze the white blood cells, most of which only partial. this paper presents a complete and fully automatic method for white blood cells identification from microscopic images. the proposed method firstly individuates white blood cells from which, subsequently, nucleus and cytoplasm are extracted. the whole work has been developed using matlab environment, in particular the image processing toolbox.
S. S. Savkare, S. P. Narote [12] et al concluded that malaria, thalassaema and babesia are serious global health problem and rapid, precise diagnosis and determination of parasitemia is necessary for accurate medication. visual quantification of parasitemia in thin blood films is a very tedious, subjective and time-consuming task. manual counting by light microscopy is the most widely used technique for parasitemia determination but it is a time-consuming and laborious process and requires expertise. this work resents an automatic method for quantification and classification of erythrocytes in giemsa stained thin blood films infected with plasmodium falciparum or protozoan parasite. the features are extracted using statistical parameters and svm classifier used for classification of normal or infected blood cells.[28]
Zainab Nayyar [13]et al stated image processing techniques are widely used in the domain of medical sciences for detecting various diseases, infections, tumors, cell abnormalities and various cancers. detecting and curing a disease on time is very important in the field of medicine for protecting and saving human life. there are three types of primary cells in human body red blood cells, white blood cells and platelets. their functionalities are different. in this paper red blood cells detection and countingis done and it is observed that which cells are normal and which are infected.
Nasrul Humaimi Mahmood and Muhammad Asraf Mansor [14] et al presented that the number of red blood cells contributes more to clinical diagnosis with respect to blood diseases. the aim of this research is to produce a computer vision system that can detect and estimate the number of red blood cells in the blood sample image. morphological is a very powerful tool in image processing, and it is been used to segment and extract the red blood cells from the background and other cells. the algorithm used features such as shape of red blood cells for counting process, and hough transform is introduced in this process. the result presented here is based on images with normal blood cells. the tested data consists of 10 samples and produced the accurate estimation rate closest to 96% from manual counting.[27]
Gaganjit Singh, Swarnalatha P., Tripathy B.K., Swetha Kakani [15] et al stated the detection of leukaemia in a patient is done by determining the abnormal white blood cell (wbc) count and calculating the blood cell ratio. traditional method of finding the blood count of a suspected leukaemia patient employs manual counting of the cells using a microscope, which is prone toerrors, is time consuming and stressful to the medical technicians. image processing techniques can make this process more reliable and efficient. in this paper, image enhancement techniques have been applied on the blood sample image to obtain a better image for blood cell ratio calculations. convex hull of blood cells is computed to determine the number of cells in an image. results show that the technique is able to give better results for counting number of wbc and computing blood cell ratio.
III. METHODOLOGY/PLANNING OF WORK
To implement the objective listed above following methodology will be adopted.
As per first approach - HOUGT TRANSFORM
1) Call Input image
2) Hough transform edge linking
3) Image segmentation
4) Snake body detection
5) Output image
6) Counting cells
As per second approach - k-MEANS CLUSTERING
1) Call input image
2) Clustering image
3) Histogram equalization
5) Blood cell extraction
6) Counting cells
IV. RESULT AND DISCUSSION
The Observation table created by taking some sample images is given below, the table contains number of total cells detected in an input image, the input images are taken from laboratory and these are actually microscopic images. The number of cells is detected by using k-means clustering algorithm. Total number of cells are calculated first and then only WBCs are detected and than calculated. Percentage of accuracy is also calculated.
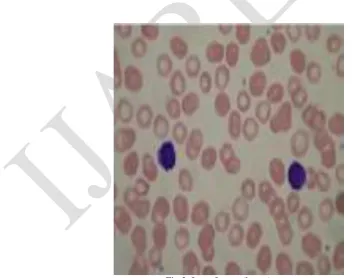
Fig 1 Input Image
Fig 1.c) Total Cells Count Fig 1.d) Execution Time
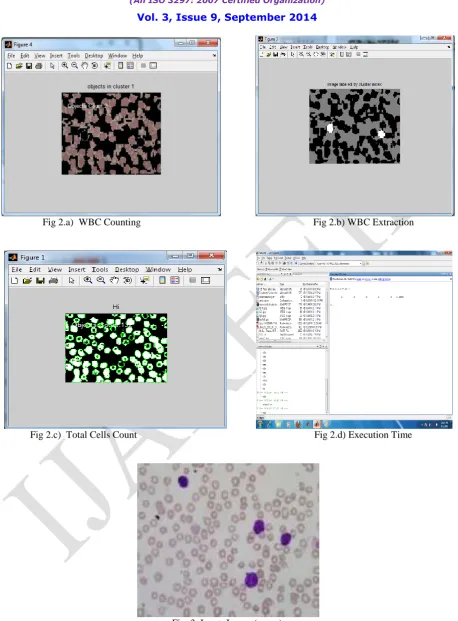
For input image in Figure 1, we got four outputs using k-Means clustering algorithm as shown above, Fig 1.a shows us total number of WBCs counted by using k-Means clustering algorithm. Fig 1.b highlights the WBCs, which are extracted from input image fig 1, in fig 1.c we have calculated total number of cells in blood sample, total number of cells are counted for detecting diseases in human being, the overall percentage is calculated if we know all number of cells in blood sample. Fig 1.d shows the execution time for the code until our final output comes. The time is calculated using “clock” function of MATLAB.
Fig 2.a) WBC Counting Fig 2.b) WBC Extraction
Fig 2.c) Total Cells Count Fig 2.d) Execution Time
Fig 3.a) WBC Counting Fig 3.b) WBC Extraction
Fig 3.c) Total Cells Count Fig 3.d) Execution Time
Fig 4.a) WBC Counting Fig 4.b) WBC Extraction
Fig 4.c) Total Cells Count Fig 4.d) Execution Time
Table 1.1 Shows Total Number of Cells , Number Of WBC Count, Execution Time and Percentage Of Accuracy
Sr. No. Input image
name
No. Of Total Cells
No. Of WBCs Execution Time
for Code
%age Of Accuracy
1 a.png 303 9 12.72 100 %
2 b.png 132 2 2.61 100 %
3 c.png 290 6 2.72 80 %
4 d.png 126 10 4.76 83.33 %
In the table above total number of cells, number of WBCs are shown, the execution time is calculated for different input images.
V. CONCLUSION
blood image.We formulate number of parameters for our output and input images. We used to calculate time,find out radius of cells .
VI. FUTURE SCOPE
For developing an image technique that will become efficent for counting blood cells in different images, someone could develop a system using GUI. In this research work we took single image at a time for our research work, we calculate Radius and Time to implement our design parameters. One can use some other technique to implement same design with reduced time. Someone can also calculate some other parameters and can implement the GUI design.
REFERENCES
1. Clark F. Olson in 1999, "Constrained Hough Transforms for Curve Detection" in Computer Vision and Image Understanding Vol. 73, No. 3, March, pp. 329–345.
2. Harsh Kapadia1, Alpesh Patel in JUNE-2013 "Application of Hough Transform and Sub-Pixel Edge Detection in 1-D Barcode Scanning" in International Journal of Advanced Research in Electrical, Electronics and Instrumentation Engineering Vol. 2, Issue 6.
3. J. Poomcokrak and C. Neatpisarnvanit in 2008 "Red Blood Cells Extraction and Counting" in The 3rd International Symposium on Biomedical Engineering (ISBME 2008).
4. Ji, Y. Xie in 2003 "Randomised hough transform with error propagation for line and circle detection" in Springer-Verlag London Limited accepted at 21/06/02.
5. Jiqiang Song, Michael R. Lyu in SEPTEMBER-2004 "A Hough transform based line recognition method utilizing both parameter space and image space" in Department of Computer Science & Engineering, The Chinese University of Hong Kong, Shatin, N.T., Hong Kong SAR, P.R. China.
6. Marcin Smereka, Ignacy Duleba in 2008 "Circular Object Detection Using A Modified Hough Transform" in Int. J. Appl. Math. Comput. Sci., 2008, Vol. 18, No. 1, 85–91 DOI: 10.2478/v10006-008-0008-9.
7. Siyu Guo , Tony Pridmore , Yaguang Kong , Xufang Zhang 2009 in "An improved Hough transform voting scheme utilizing surround suppression" in Pattern Recognition Letters 30 (2009) 1241–1252
8. S.Kareem, R.C.S Morling and I.Kale in 2011 "A Novel Method to Count the Red Blood Cells in Thin Blood Films" in 978-1-4244-9474-3/11 ©2011 IEEE.
9. Venkatalakshmi.B, Thilagavathi.K in 2013 "Automatic Red Blood Cell Counting Using Hough Transform" in Proceedings of 2013 IEEE Conference on Information and Communication Technologies (ICT 2013).
10. Lorenzo Putzu, and Cecilia Di Ruberto in 2013 "White Blood Cells Identification and Counting from Microscopic Blood Image" in International Journal of Medical, Health, Pharmaceutical and Biomedical Engineering Vol:7 No:1.
11. Monika Mogra , Vivek Srivastava in 2014 " A Comprehensive Review of Analysis of Counting Blood Cells Using Different Image Processing Algorithms" in International Journal of Engineering Science Invention ISSN (Online): 2319 – 6734, ISSN (Print): 2319 – 6726.
12. S. S. Savkare, S. P. Narote in February 2011"Automatic Classification of Normal and Infected Blood Cells for Parasitemia Detection" in IJCSNS International Journal of Computer Science and Network Security, VOL.11 No.2.
13. Zainab Nayyar in 2014 " Blood cells detection & counting" in International Journal of Applied Engineering Research and Development (IJAERD) ISSN(P): 2250-1584; ISSN(E): 2278-9383 Vol. 4, Issue 2.
14. Nasrul Humaimi Mahmood and Muhammad Asraf Mansor in 2012 " Red blood cells estimation using hough transform 15. technique" in An International Journal (SIPIJ) Vol.3, No.2.