strain distribution, band lineups and electron effective masses in self-assembled pyramidal
In1-xGaxAs/GaAs and SixGe1-x/Si quantum dots
.
White Rose Research Online URL for this paper:
http://eprints.whiterose.ac.uk/1683/
Article:
Califano, M. and Harrison, P. (2002) Composition, volume, and aspect ratio dependence of
the strain distribution, band lineups and electron effective masses in self-assembled
pyramidal In1-xGaxAs/GaAs and SixGe1-x/Si quantum dots. Journal of Applied Physics,
91 (1). pp. 389-398. ISSN 1089-7550
https://doi.org/10.1063/1.1410318
[email protected] https://eprints.whiterose.ac.uk/ Reuse
See Attached
Takedown
If you consider content in White Rose Research Online to be in breach of UK law, please notify us by
Composition, volume, and aspect ratio dependence of the strain
distribution, band lineups and electron effective masses in self-assembled
pyramidal In
1ÀxGa
xAs
Õ
GaAs and Si
xGe
1ÀxÕ
Si quantum dots
M. Califanoa)and P. Harrison
Institute of Microwaves and Photonics, School of Electronic and Electrical Engineering, University of Leeds, LS2 9JT-Leeds, United Kingdom
~Received 19 March 2001; accepted for publication 20 August 2001!
We present a systematic investigation of the strain distribution of self-assembled pyramidal In12xGaxAs/GaAs and SixGe12x/Si quantum dots for the case of growth on a~001!substrate. The dependence of the biaxial and hydrostatic components of the strain on the quantum dot volume, aspect ratio, composition, and percentage of alloying x is studied using a method based on a Green’s function technique. The dependence of the carriers’ confining potentials and the electronic effective mass on the same parameters is then calculated in the framework of eight-band k•p theory. The
results for which comparable published data are available are in good agreement with the theoretical values for strain profiles, confining potentials, and electronic effective mass. © 2002 American
Institute of Physics. @DOI: 10.1063/1.1410318#
I. INTRODUCTION
High strain epitaxy has now become a standard tech-nique for the production of quasi-zero-dimensional systems via Stranski–Krastanov growth.1Due to the lattice mismatch between deposited material and substrate, the system is un-der high strain, which is partly relaxed by the elastic defor-mation leading to the fordefor-mation of three-dimensional ~3D!
islands. The strain is therefore a key feature of the dots and causes large changes in both the band profiles and the carrier effective masses, if compared with the bulk values, which become functions of position inside the dot. Islands of vari-ous sizes and shapes have been reported,2– 6 depending on the epitaxial method and on the particular growth conditions, such as temperature, growth rate, etc. But besides the size and shape, another crucial parameter varies with the growth conditions: their composition. In fact it is now believed that even though it is possible, in principle, to achieve the forma-tion of, say, pure InAs islands on a GaAs substrate by fol-lowing a careful ~i.e., low temperature, low growth rate!
growth procedure, the capping process, besides altering the dot shape,5–7decreases the InAs composition in the islands to 60%–70%.8 The problem is that the InAs percentage in the dot may not be constant, either, but may decrease from the top to the base of the pyramid.8,9A way to overcome this uncertainty about the composition could be to grow In12xGaxAs with x50.5 directly from the start, which, under certain conditions, should give dots with virtually the same composition,10 avoiding any problems in the determination of the InAs content. The alloy island, due to the value of its lattice constant~intermediate between that of pure dot mate-rial and that of pure substrate! is expected to exhibit a dif-ferent strain configuration compared to the pure dot material. In this article we will investigate the influence of vol-ume, aspect ratio~Q5b/2h, where b is the pyramid base and
h its height!and composition ~percentage of alloying x! on the hydrostatic and biaxial strain components and on the re-lated carrier confining potentials and the electronic effective mass in self-assembled pyramidal In12xGaxAs/GaAs and SixGe12x/Si quantum dots~QDs!, for the case of growth on a~001!substrate. The article is organized as follows. In the next section we describe the model used for the calculations. In Sec. III we present and discuss our results and compare them with previous available theoretical calculations. Sec. IV contains the conclusions.
II. MODEL
A. Strain distribution
The strain distribution is calculated by means of the Green’s function technique,11and takes into account the an-isotropy of the elastic properties in cubic crystals. The Fou-rier transform of the strain tensor for QDs with cubic sym-metry is11
«
˜i j~j!5«0x˜QD~j!
3
H
di j2~C1112C12!jijj/j2
11~C121C44!Sp51 3 jp
2
C44j21Canjp
2
312
F
j2
C44j2
1Canji
21
j2
C44j2
1Canjj
2
G
J
, ~1!where C11,C12,C44 are the elastic moduli and Can5C11
2C1222C44 ~we use the elastic constants of the matrix for
both dot and matrix material, as suggested by Andreev
et al.11 on the basis, among other considerations, of Keyes’ scaling relationship12!
a!Electronic mail: [email protected]
JOURNAL OF APPLIED PHYSICS VOLUME 91, NUMBER 1 1 JANUARY 2002
389
«05
aS2aQD
aQD
, ~2!
where aS and aQD are the lattice constants of the substrate
and the QD materials, respectively; x˜QD(j) is the Fourier
transform of the dot characteristic function~equal to 1 inside the dot and 0 outside!
x
˜QD~j!52e
2ihj3
j1j2
H
E
S
h,j32Lx
2hj12
Ly
2hj2
D
2E
S
h,j32Lx
2hj11
Ly
2hj2
D
2E
S
h,j31Lx
2hj12
Ly
2hj2
D
1E
S
h,j31Lx
2hj11
Ly
2hj2
DJ
~3!and
E~a,x!5~eiax21!/ix. ~4!
We point out that the expression we use for the Fourier trans-form of the dot characteristic function @Eq. ~3!# is different from that reported in Ref. 11. That may partially account for the better agreement we obtain for the biaxial component with microscopic atomistic calculations of the strain distri-bution, such as those reported by Cusack, Briddon, and Jaros.13 and Jiang and Singh,14 that used the valence force field model by Keating16and Martin.17
It is interesting to mention that expression~1!is obtained by adopting for the strain the initial condition
«i j5«0di j, ~5!
which implies a compressive strain along both the in-plane and growth directions, unlike the case of pseudomorphic growth of strained layers where to a compressive ~tensile!
in-plane strain corresponds a tensile ~compressive! strain along the growth direction. If we try to force the same initial condition for a pyramidal system, the strain component along the growth direction is always positive ~tensile!even at the tip of the dot, in contrast with all the previously published theoretical results.
B. Band lineups
Starting from the hydrostatic and biaxial components of the strain, we calculated the band-edge energies at the Bril-louin zone center (k50). In the framework of the eight-band k•p theory the energy shifts are given by
DEc5DEc
hy
, ~6!
DEhh5DEv,av
hy
1DEhh sh
, ~7!
DElh5DEv,av
hy
1DElhsh, ~8!
DEso5DEv,av
hy
1DEsosh, ~9!
where
DEchy5ac~ «xx1«y y1«zz!, ~10!
DEv,av hy
5av~ «xx1«y y1«zz!, ~11!
DEhhsh5212dEsh, ~12!
DElhsh521
2D01 1
4dE
sh
112
F
D0 21D0dEsh1
9
4~dE
sh!2
G
1/2,
~13!
DEso sh
5212D01
1
4dE
sh
212
F
D0 21D0dEsh1
9
4~dE
sh!2
G
1/2,
~14!
whereD0 is the spin-orbit splitting in the absence of strain.
The strain-dependent shiftdEshdepends on the interface orientation. In the case of growth on a ~001!substrate
dEsh5b~2«zz2«xx2«y y!, ~15!
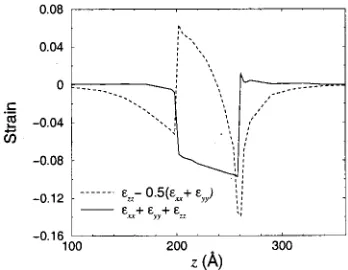
where b is the shear deformation potential. The hydrostatic strain component~see Fig. 1!
«h5«xx1«y y1«zz ~16!
leads therefore to a shift of both the average valence-band energy Ev,av and the conduction-band energy Ec ~av and ac
[image:3.612.350.524.53.188.2]are the respective hydrostatic deformation potentials!, whereas the direction and magnitude of the splitting of the light-, heavy-hole and split-off bands depend only on the biaxial strain~see Figs. 1 and 2!
FIG. 1. Hydrostatic~full line!and biaxial~dotted line!strain components as a function of position along the height of an InAs pyramid with aspect ratio
[image:3.612.313.560.248.377.2]Q51 (h560 Å).
«b52«zz2«xx2«y y. ~17!
Finally, we have
Ec5Ev,av1
D0
3 1Eg1DEc
hv, ~18!
Ehh5Ev,av1
D0
3 1DEhh, ~19!
Elh5Ev,av1
D0
3 1DElh, ~20!
Eso5Ev,av1 D0
3 1DEso. ~21!
The values of the average valence-band energy Ev,av, the
band-gap energy Eg, the split-off energy D0, the
deforma-tion potentials ac, av, and b, the lattice constant a and the
elastic moduli C11, C12and C44 are reported in Table I.
C. Conduction-band effective masses
For a nondegenerate ~apart from spin! band edge with energye0the dispersion relation for small k is parabolic in k
in the vicinity of the Gpoint24
enk5en01
\2
2
(
ab ka 1mnab
kb; a,b5x, y ,z, ~22!
where
1
mnab
5m1
0
dab1
2
m0 2
(
mÞn
pmna pnmb en02em0
~23!
pmna 5
E
unit cell
un0*paum0dr ~24!
and the spin-orbit term proportional tos3¹V inphas been neglected. For the conduction-band edge associated with the anti-bonding s orbitals~G6 symmetry!, considering only the
contributions of the ~quadruplet! states m5G8 ~heavy and
light holes!and~doublet!m5G7 ~spin-orbit split-off band!,
the effective mass can be expressed as24
1
mG 6
5
1
m01
4 P2
3e01
2 P2
3~e01D0!
, ~25!
where P is the interband matrix element
P52i m0
^
SupxuX&5
2i m0
^
SupyuY&
52i m0
^
SupzuZ&
. ~26!From Eq.~25!we obtain
P2
5
S
12mG 6
m0
D
3\2E
g~Eg1D0!
2mG6~3Eg12D0!
. ~27!
Since in the present case mG6!m0, the term mG6/m0 has
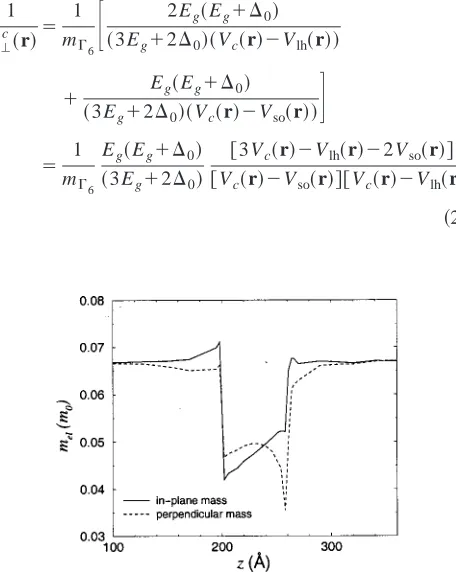
been neglected. Substituting Eq. ~27! ~obtained in the ab-sence of strain!into Eq.~23! ~where all the matrix elements considered in the summation are proportional to P!, assum-ing that P does not change significantly with strain, we ob-tained the strain-dependent expression for the effective mass tensor miic ~the in-plane and perpendicular components are displayed in Fig. 3!
1
m'c~r!5
1
mG6
F
2Eg~Eg1D0! ~3Eg12D0!~Vc~r!2Vlh~r!!
1~3E Eg~Eg1D0!
g12D0!~Vc~r!2Vso~r!!
G
5m1 G6
Eg~Eg1D0! ~3Eg12D0!
@3Vc~r!2Vlh~r!22Vso~r!# @Vc~r!2Vso~r!#@Vc~r!2Vlh~r!#
[image:4.612.322.550.436.722.2]~28!
[image:4.612.51.299.512.630.2]FIG. 3. In-plane~full line!and perpendicular~dotted line!electron effective mass components as a function of position along the height of an InAs pyramid with aspect ratio Q51 (h560 Å).
TABLE I. Material parameters. Lattice constant a~in Å!; elastic constants C11, C12 and C44 ~in units of
1012dyne cm22; Ref. 19!; Average valence-band energy E
v,avand hydrostatic deformation potentials avand ac
~in eV; Ref. 20!; band gap Eg~in eV; Ref. 21!, spin-orbit splittingD0, and shear deformation potential b~in eV;
Refs. 19 and 23!.
a C11 C12 C44 Ev,av D0 Eg av ac b
InAs 6.058 0.83 0.45 0.40 26.67 0.38 0.42 1.00 25.08 21.8 GaAs 5.653 1.18 0.54 0.59 26.92 0.34 1.519 1.16 27.17 21.7 Si 5.431 1.675 0.650 0.801 27.03 0.04 1.17 2.46 4.18 22.1 Ge 5.658 1.315 0.494 0.684 26.35 0.30 0.74 1.24 21.54 22.9
1
mi
c
~r!5
1
mG6
2Eg~Eg1D0! ~3Eg12D0!
H
0.25@Vc~r!2Vhh~r!#@Vc~r!2Vso~r!# @Vc~r!2Vhh~r!#@Vc~r!2Vso~r!#@Vc~r!2Vlh~r!#
1@V 0.75@Vc~r!2Vlh~r!#@Vc~r!2Vso~r!#
c~r!2Vhh~r!#@Vc~r!2Vso~r!#@Vc~r!2Vlh~r!#1
0.5@Vc~r!2Vlh~r!#@Vc~r!2Vhh~r!# @Vc~r!2Vhh~r!#@Vc~r!2Vso~r!#@Vc~r!2Vlh~r!#
J
, ~29!
where mG6 is the bulk electronic effective mass. A similar
approach to the electron effective mass tensor was used by Fonseca et al.25who, nevertheless, did not take into account the coupling with the split-off band.
D. Valence-band effective masses
Unfortunately the same treatment is unsuitable for the valence-band states G8 andG7, because they do not couple
with each other.26 In other words, the matrix elements
^
uG7,8uk•puuG7,8&
are zero for parity reasons ~they are of thetype
^
nupˆx1pˆy1pˆzum&
, where un&
,um&
5uX&
,uY&
,uZ&
, and the operator pˆadoes not connect any of those states!, unless the contribution of higher ~remote! valence~and/or conduc-tion! bands is taken into account in the summation of Eq.~23!. This could be regarded as a higher order contribution so that in the first approximation the heavy-hole effective masses could be considered to be independent of strain.
The problem is that according to Cusack, Briddon, and Jaros13the heavy-hole effective mass value in the dots is far from both the bulk and the quantum well values: their esti-mate for mhh,z ~derived by performing empirical
pseudopo-tential and ab initio local density calculations for the InAs band structure under strain, near the center of a pyramid with
h560 Å and b5120 Å!, is 0.59, while the isotropic bulk value is mhh50.40. Strangely enough, the two-dimensional
~quantum well! system value mhh,z5(g122g2)2 1
50.263
~according to Chuang,15but 0.345 according to the values for
g1 andg2 reported by Jiang and Singh14! ~which is the one
suggested for the dots by k•p approach!is not intermediate between the zero-and the three-dimensional system ones.
In the framework of k•p theory in order to obtain
non-zero matrix elements we should use at least a 14-band
Hamiltonian ~which takes into account three more conduc-tion bands!, but in this case we would not know all the de-formation potentials for the higher bands.
E. Alloys
The lattice constant for the ternary~T!alloy In12xGaxAs
~of the form ABxC12x, or binary SixGe12x,@BxC12x#!was obtained from linear interpolation of that of the binary ~B!
constituents according to Vegard’s law21
aABC~x!5xaAB1~12x!aAC, ~30!
whereas for parameters such as Eg, Ev,av and D0 we used
the quadratic approximation
TABC~x!5xBAB1~12x!BAC1x~12x!CABC, ~31!
where C is the bowing parameter, which is constant for Eg and D0 ~CEg(In12xGaxAs)50.38, CD0(In12xGaxAs)
50.15).27 For SixGe12x the composition dependence of the valence-band spin orbit splitting is linear,22 and since the dots are of type II, i.e., the electrons are not confined inside the dot but in the substrate, there being no need for great accuracy in the determination of the conduction-band profile, we have used a simple linear relationship for the band gap energy Eg as well!. For Ev,avthe bowing parameter depends
on the hydrostatic deformation potentials of the binary constituents28
Cv,av.3Dav
Da aS
[image:5.612.74.548.521.722.2], ~32!
where
Dav5av~AB!2av~AC! ~33!
and
Da5a~AB!2a~AC!. ~34!
III. RESULTS AND DISCUSSION
This section is divided into three subsections each of which analyzes how the dot properties we are interested in
~i.e., strain distribution, band lineups and electron effective mass tensor! change by varying a different parameter. We present an investigation of their dependence on the volume, for a fixed aspect ratio Q51, in subsection III A, and on the aspect ratio ~for a virtually constant volume! in subsection III B, for dots with pure InAs composition. Their behavior as a function of both the variables is, nevertheless, general and can be applied to other lattice mismatched, pseudomorphi-cally grown heterostructures. Therefore, since the great ma-jority of experimental Si/Ge QDs have Q of about 4 –729–32
~values for which both strain and band edge profiles are rather constant inside the dot, as can be seen below!, we did not repeat the calculations for this material. We preferred, instead, to present strain and band edges for experimental samples, and compare them for different Si contents in the
last subsection, where we study the effect of varying the dot composition accounting for 30% and 50% ~x50.3 to 0.5!
substrate alloying. Three experimental InAs structures with aspect ratios ranging from 1.4 to 4.5 ~which explains our choice of the range of variation for Q!have been considered as well.
A. Volume dependence
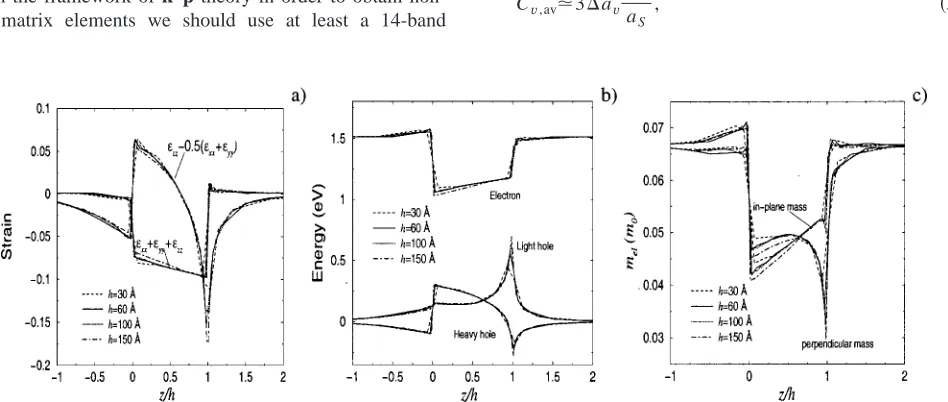
In Fig. 4~a! we show the variation with volume of the hydrostatic and biaxial component of the strain ~as in Refs. 13 and 14, we plot «zz20.5(«xx1«y y)5«b/2 instead of the full biaxial strain eb! for InAs structures with aspect ratio Q51, as a function of the normalized position along the height of the pyramid. As the volume varies from 36 000 Å3 to 4 500 000 Å3, the overall shape of the curves does not change, whereas the values of both components depend weakly on the volume. This dependence is more pronounced near the base and the tip of the pyramid and reflects itself in a similar difference in the band lineups@Fig. 4~b!#and elec-tron effective mass components @Fig. 4~c!#.
The curves we obtain for both electron confining poten-tial and effective masses of the structure with h5100 Å and
b5200 Å are in agreement with those reported by Fonseca
[image:6.612.84.535.52.210.2]et al.25 ~the agreement is excellent for the electron band
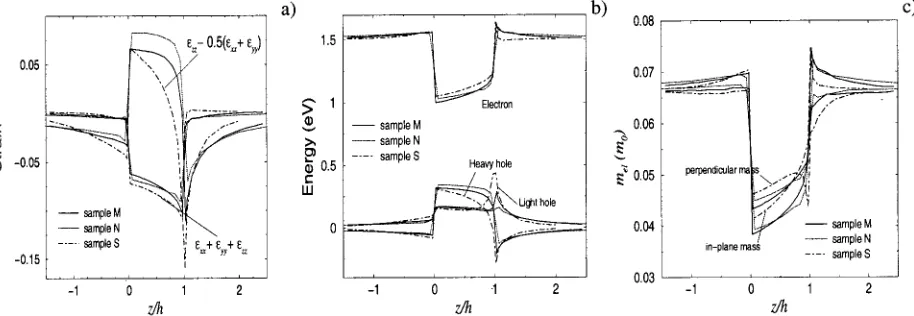
FIG. 5. Hydrostatic and biaxial strain, band edges and electron effective mass~in-plane and perpendicular!components as a function of the normalized position along the height of the pyramid, for InAs structures with aspect ratio Q51~full lines!, 2~dotted lines!, 3~dashed lines!and 4~dot-dashed lines!.
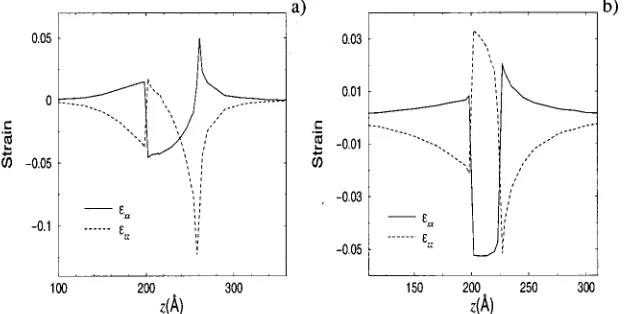
FIG. 6. In-plane~exx, solid lines!and perpendicular ~ezz, dashed lines! strain components, as a function of the position along the height of the pyra-mid, for InAs structures with aspect ratio Q51 and h560 Å ~a!, and Q
54 and h525 Å~b!.
[image:6.612.58.376.583.740.2]edge, for which we obtain the same value at the center of the pyramid. Note that in Ref. 25 on the x axis the distance is measured from the top, whereas in the present article we measure it from the bottom!. Nevertheless, if we use their expressions for the effective masses ~which are similar to ours but neglect the coupling with the split-off band!, the results of the calculations consistently overestimate the ef-fective masses by about 6% for all the structures considered, if compared to those obtained with our expressions ~they themselves mention that the electronic energy levels ob-tained with their procedure are 5%–10% higher than the ex-act values, if compared with an eight-band k•p calculation. In fact, neglecting the coupling between the light-hole and the split-off bands can lead to an error in the light-hole en-ergies comparable to the light- and heavy-hole energy split-tings which could be several tens of meV and too large to be ignored.15This, in turn, is expected to affect the value of the electronic effective mass components!. If we compare the value for the perpendicular component of the effective mass in the center of the pyramid reported in Ref. 25 ~we choose this point to conform to the choice of Cusack, Briddon, and Jaros13,18!with the value in the same point from Fig. 4, the overestimate is about 4%.
The average value of the effective mass of all three structures, which is a factor of 2 larger than the bulk value
~see Table II!, is in agreement with that calculated by Cu-sack, Briddon, and Jaros.13
B. Dependence onQ
[image:7.612.313.561.96.199.2]The situation is completely different when we keep the volume virtually constant and vary the aspect ratio Q be-tween 1 and 4~as shown below, this variation covers most of the experimental samples obtained so far by epitaxial growth!. The largest variation in volume is from 288 000 to 341 333 Å3, which correspond to a variation of the dimen-sions of the dot from h560 Å and b5120 Å, to h563.5 Å and b5127 Å, which, as can be seen in Fig. 4~a!, does not introduce any detectable variation in the strain curves. Figure 5 displays the results of our calculations. For Q51 the biaxial strain becomes negative at about 2/3 of the pyra-mid height. This means that the«zz strain tensor component equals the «xx5«y y one ~pure hydrostatic pressure! at that point, in excellent agreement with the results reported by Cusack and co-workers.18 As a consequence of this change of sign of the biaxial component ~see Fig. 5~b!, the heavy-hole band edge becomes lower in energy than the light hole one @see Eq.~12!#. For higher Qs this transition occurs much nearer to the tip~at about 1/10 of the height from it, for
Q52, and at the tip, for Q53,4!. The strain profile for Q
54 is in agreement with that reported by Cusack and co-workers18 for a structure of the same dimensions, where no region of purely compressive stress was found within the dot, and therefore the heavy-and light-hole potentials were well separated @as in Fig. 5~b!#. Moreover, the biaxial
[image:7.612.51.296.96.199.2]FIG. 7. Hydrostatic and biaxial strain, band edges and electron effective mass~in-plane and perpendicular!components as a function of the normalized position along the height of the pyramid, for InAs experimental structures with aspect ratio Q51.4~dotted lines!, 2.8~full lines!and 4.5~dot-dashed lines!. TABLE II. Electronic in-plane and perpendicular effective masses~in units
of m0!and carrier confining potentials~in meV!calculated in the center of
the pyramid (h/2) for InAs structures with aspect ratio Q ranging from 1
~four structures with different volumes!to 4.
Q me,'(h/2) me,i(h/2) Ec(h/2) Ehh(h/2) Elh(h/2) h b
1 0.049 0.047 393 216 146 30 60 1 0.049 0.047 393 216 144 60 120 1 0.049 0.047 394 213 147 100 200 1 0.048 0.046 410 214 152 150 300
2 0.048 0.044 422 279 140 40 160 3 0.048 0.043 428 311 150 30 180 4 0.047 0.042 442 329 159 25 200
TABLE III. Average values of the electronic in-plane and perpendicular effective masses~in units of m0!and carrier confining potentials~in meV!
for InAs structures with aspect ratio Q ranging from 1~four structures with different volumes!to 4.
Q ^me,'& ^me,i& ^Ec& ^Ehh& ^Elh& h b
1 0.0474 0.0478 391 188 211 30 60 1 0.0466 0.0480 395 176 219 60 120 1 0.0470 0.0469 404 197 200 100 200 1 0.0460 0.0458 423 200 203 150 300
[image:7.612.79.536.573.731.2]strain maximum increases with Q, whereas its minimum decreases. Another interesting feature is that with increasing
Q the depth ~both absolute and measured in units of the pyramid height! of the region of substrate above the dot where the biaxial strain component is nonzero also in-creases. In other words, the lower the height~the flatter the pyramid!the deeper the effect of the strain on the substrate above it.
These differences in behavior for different Qs ~as op-posed to the almost unchanged shapes of the curves for dif-ferent volumes!, can be explained in terms of the different effects the surrounding ~substrate and barrier! material pro-duces on dots of different shape. For all Qs the in-plane lattice constant is compressed by the substrate near the base
@which gives a negative «xx and a positive «zz component, see Figs. 6~a!and 6~b!#. For low Q structures, however, as one moves towards the tip, the barrier material that sur-rounds the dot compresses the perpendicular lattice constant as well, producing a region where both«zzand«xxare nega-tive, till, nearer to the apex, the «xx component becomes positive@as in Fig. 6~a!#. High Q pyramids, instead, are flat-ter and the compression caused by the substrate to the sides is not enough to produce any change in sign of the strain tensor components. This means that«zz at the pyramid tip is still positive @i.e., the dot perpendicular lattice constant is still larger than the unstrained one, as in Fig. 6~b!#, and there-fore no region of pure hydrostatic pressure is found within
the dot. As a consequence, no crossing between the heavy-and light-hole bheavy-ands occurs within the dot heavy-and the region of the substrate above it where the barrier material «zz stays negative~i.e., where the barrier material z lattice constant is smaller than the unstrained one! increases ~in other words, since the z component of the strain at the pyramid tip is still tensile, the region immediately above it must be under a compressive strain along that direction!.
This is a factor that has to be taken into account when stacked arrays of self-assembled QDs are grown. High Q dots will, in fact, require thicker spacing layers to be consid-ered isolated~electronically decoupled!, than needed by low
Q dots. On the other hand, if one wants to achieve vertical
alignment and coupling of QDs by exploiting the strain cou-pling effect, the growth of high or low Q dots allows the spacing layer to be tailored to suit any particular device re-quirement.
Even though Fig. 5 seems to suggest a similar increase also in the region below the pyramid, this effect is only due to the normalization. If plotted on an absolute scale, there is no difference in the extension of this region for the different values of Q considered here.
[image:8.612.316.561.103.161.2]Both the hydrostatic and the biaxial components are in good agreement almost everywhere with microscopic atom-istic calculations of the strain distribution such as those re-ported ~for a structure with h560 Å and b5120 Å!by Cu-sack, Briddon, and Jaros.13and Jiang and Singh,14 that used
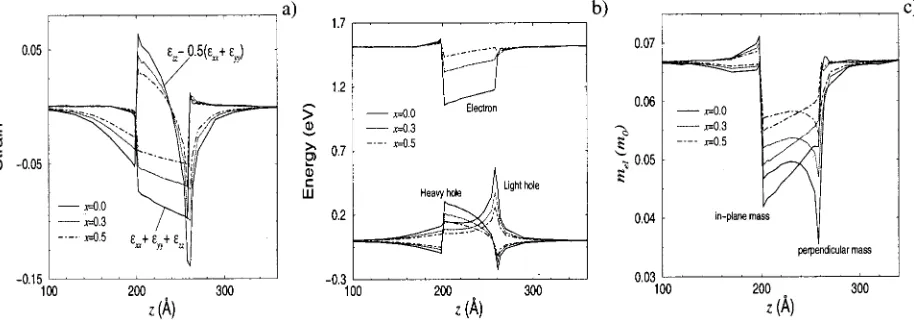
FIG. 8. Hydrostatic and biaxial strain, band edges and electron effective mass~in-plane and perpendicular!components as a function of the position along the height of the pyramid, for In12xGaxAs structures with aspect ratio Q51 (h560 Å) and GaAs composition x50 ~full lines!, 0.3~dotted lines!and 0.5
~dot-dashed lines!.
TABLE IV. Electronic in-plane and perpendicular effective masses~in units of m0!and carrier confining potentials~in meV!calculated in the center of
the pyramid (h/2) for three experimental InAs structures with aspect ratio Q ranging from 1.4 to 4.5~since the last pyramid has a rectangular base we report both dimensions!.
Q me,'(h/2) me,i(h/2) Ec(h/2) Ehh(h/2) Elh(h/2) h b
1.4a 0.049 0.045 414 253 135 70 200
2.8b 0.046 0.042 463 300 150 70 400
4.5c 0.047 0.041 452 332 161 30 300–250 aReference 33.
b
Reference 34.
c
Reference 35.
TABLE V. Average values of the electronic in-plane and perpendicular ef-fective masses~in units of m0!and carrier confining potentials~in meV!for
three experimental InAs structures with aspect ratio Q ranging from 1.4 to 4.5~since the last pyramid has a rectangular base we report both dimen-sions!.
Q ^me,'& ^me,i& ^Ec& ^Ehh& ^Elh& h b
1.4a 0.048 0.046 408 228 173 70 200
2.8b 0.047 0.042 454 287 151 70 400
4.5c 0.047 0.042 442 321 156 30 300–250 aReference 33.
b
Reference 34.
c
Reference 35.
[image:8.612.79.536.561.722.2]the valence force field model by Keating16and Martin.17The maximum value for the biaxial strain we calculate at the base of the pyramid is, nevertheless, about 30% lower than that reported in the cited works ~see Fig. 1!. This is expected to affect the biaxial-strain-dependent shiftdEshbetween the
[image:9.612.316.561.96.152.2]va-lence bands at that point. Comparison with the hole potential profiles reported by Cusack and co-workers in Ref. 18 shows that the light-hole band edge at the base of the dot for the structure with Q51 in Fig. 2 has actually a value about 20% lower than that resulting from their calculations. The same comparison for the structure with Q54 reveals that, even though the overall shape of the band edge profiles shown in Fig. 5 is in agreement with that reported in Ref. 18, our calculated values are underestimated.
If, on the other hand, we compare our results ~Fig. 4, dashed lines! with the strain profiles reported by Andreev
et al.11 for a pyramid with b560 Å and h530 Å, we find that both the strain components are in very good agreement almost everywhere except at the tip of the dot where the biaxial strain value they calculated is about 70% higher than that shown in Fig. 4, whereas the agreement is still good for the hydrostatic component. This discrepancy is hard to ex-plain, since we use the same expression for the Fourier trans-form of the strain tensor. However, the choice of other pa-rameters such as the integration domain and the number of sampling points for the calculation of the three-dimensional inverse Fourier transform integral in the momentum space may have affected the results.
The most relevant feature about the band edges that emerges from the comparison among the curves in Fig. 5 is that with increasing Q the overall depth of both the electron and hole confining potentials increases and becomes less
variable with position ~i.e., more potential-well-like! inside the dot. All this has the effect of decreasing the value of both the electronic effective mass components me,'and me,iwith
increasing Q.
In Tables II and III we present the results of our calcu-lations for the electronic in-plane and perpendicular effective masses ~in units of m0! and carrier confining potentials ~in meV! ~both on average and calculated in the center of the pyramid h/2!for InAs structures with aspect ratio Q ranging from 1~four structures with different volumes!to 4.
The value of the perpendicular ~i.e., along the growth direction!electron effective mass calculated in the center of the pyramid decreases by about 2% with increasing volume for a fixed Q~and up to twice as much with increasing Q!, in passing from the first structure to the fourth, whereas the in-plane component has a similar behavior with increasing volume but a greater decrease ~about 10%! with increasing
Q, if we compare the same two structures. The electron
con-fining potential in the dot center increases by more than 12% with Q increasing from 1 to 4, and by about 4% increasing the volume from 36 000 to 4 500 000 Å3 for Q51. The heavy-hole band edge position in the center of the pyramid slightly decreases with increasing volume, whereas it in-creases by more than 50% when Q passes from 1 to 4. A similar behavior is found for the average values of these quantities.
[image:9.612.53.297.98.151.2]In Fig. 7 we compare the strain, band edges and effective masses profiles for three experimental InAs QDs grown by Schmidt et al.,33 Murray et al.34 and Noda, Abe, and Tamura,35respectively, with aspect ratios ranging from about 1.4 to about 4.5. The relevant quantities are reported in Tables IV and V.
FIG. 9. Hydrostatic and biaxial strain components~a!and band edge profiles
[image:9.612.53.365.601.756.2]~b!as a function of the position along the height of the pyramid, for experi-mental SixGe12x/Si structures ~see Ref. 30!with aspect ratio Q56 and Si composition x50~full lines!, 0.3~ dot-ted lines!and 0.5~dot-dashed lines!. TABLE VI. Electronic in-plane and perpendicular effective masses~in units
of m0!and carrier confining potentials~in meV!calculated in the center of
the pyramid (h/2) for In12xGaxAs structures with aspect ratio Q51 and GaAs composition x50, 0.3 and 0.5.
x me,'(h/2) me,i(h/2) Ec(h/2) Ehh(h/2) Elh(h/2) h b
0.0 0.049 0.047 393 216 144 60 120 0.3 0.053 0.052 146 150 99 60 120 0.5 0.058 0.057 42 106 69 60 120
TABLE VII. Average values of the electronic in-plane and perpendicular effective masses~in units of m0!and carrier confining potentials~in meV!
for In12xGaxAs structures with aspect ratio Q51 and GaAs composition x50, 0.3 and 0.5.
x ^me,'& ^me,i& ^Ec& ^Ehh& ^Elh& h b
C. Alloying
When alloying~or intermixing!occurs during~or after!
the growth process, the lattice mismatch between substrate and dot material is reduced, with a consequent proportional
~we only consider alloys with uniform composition! reduc-tion of the strain induced by it. This is shown in Fig. 8, where we compare biaxial and hydrostatic strain for In12xGaxAs pyramids with Q51 (h560 Å) and a GaAs composition x50, 0.3 and 0.5.
If we consider the energy lineups, it is apparent that with increasing GaAs composition both electrons and holes be-come progressively more weakly bound, due to the reduced difference in the carrier band edge positions between sub-strate and alloy dot. The electron confining potential under-goes the largest variation, decreasing from an average value of about 400 meV for x50 to a value of only a few tens of meV ~about 40 meV! for x50.5, which, according to our calculations is not enough to trap any electron inside the dot
~we assume a constant 3D confining potential inside the pyramid. See Ref. 36 for more details about the method em-ployed!. Even though its value at the base of the pyramid is of about 90 meV and stays higher than 50 meV almost until one half of the height, the potential well is still not suffi-ciently deep to bound an electron. The fact that In12xGaxAs dots with a nominal In content of x50.5 do actually have bound electronic levels may be explained in the light of re-cent experiments37 which have found a highly nonuniform composition with an In-rich core having an inverted-pyramid
~or-cone!shape in such structures. This In-rich region would then be responsible for trapping the electrons.
The electron effective masses~calculated in the center of the pyramid! follow a quasilinear behavior in passing from the value of 0.049 ~for the perpendicular and 0.047 for the in-plane component respectively!, for x50 to 0.058~0.057!
for x50.5~the same is true for their average value, as shown in Tables VI and VII, where we present our results for the carrier confining potentials as well!.
The same trend has been found for the SixGe(12x)/Si experimental structures considered, as shown in Figs. 9 and 10, where we compare, for two different experimental samples,29,30the strain and band edge profiles for x varying between 0 and 0.5.
IV. CONCLUSIONS
We have presented an investigation of the strain distri-bution of self-assembled pyramidal In12xGaxAs/GaAs and SixGe12x/Si quantum dots in the case of growth on a~001! substrate, where the dependence of the biaxial and hydro-static components on the quantum dot volume, aspect ratio, composition and percentage of alloying x has been calculated using a method based on the Green’s function technique.
The dependence of the carriers’ confining potentials on the same parameters has then been calculated in the frame-work of eight-band k•p theory. In this framework we derived an expression for the electron effective mass in-plane and perpendicular components which takes into account the cou-pling with the spin-orbit split-off band and demonstrated the importance of this inclusion by comparing our results with other published data, where this coupling is neglected.
Good agreement is obtained from the comparison~where possible!with theoretical values for strain profiles, confining potentials and electronic effective mass reported in the litera-ture.
ACKNOWLEDGMENTS
The authors would like to thank M. Halsall and A. Dun-bar ~UMIST! for providing them with experimental data on Si/Ge QDs prior to publication. One of us~M. C.!would like to thank M. Henini~University of Nottingham! for valuable discussions on QD growth and composition. The authors would like to thank the School of Electronic and Electrical Engineering, the Faculty of Engineering, and the University of Leeds for financial support.
1I. N. Stranski and L. Von Krastanov, Akad. Wiss. Lit. Mainz Math.-Natur.
Kl. IIb 146, 797~1939!.
2M. Grundmann, J. Christen, N. N. Ledentsov, J. Bo¨hrer, D. Bimberg, S. S.
Ruvimov, P. Werner, U. Richter, U. Go¨sele, J. Heydenreich, V. M. Ustinov, A. Yu. Egorov, A. E. Zhukov, P. S. Kop’ev, and Zh. I. Alferov, Phys. Rev. Lett. 74, 4043~1995!.
3
D. Leonard, K. Pond, and P. M. Petroff, Phys. Rev. B 50, 11 687~1994!.
4J. M. Moison, F. Houzay, F. Barthe, L. Leprince, E. Andre and O. Vatel,
Appl. Phys. Lett. 64, 196~1994!.
5M. Fricke, A. Lorke, J. P. Kotthaus, G. Medeiros-Ribeiro, and P. M.
Petroff, Europhys. Lett. 36, 197~1996!.
6
[image:10.612.52.348.54.207.2]S. Sauvage, P. Boucaud, F. H. Julien, J.-M. Gerard, and J.-Y. Marzin, J. Appl. Phys. 82, 3396~1997!.
FIG. 10. Hydrostatic and biaxial strain components~a!and band edge profiles
~b!as a function of the position along the height of the pyramid, for experi-mental SixGe12x/Si structures ~see Ref. 29!with aspect ratio Q55 and Si composition x50~full lines!, 0.3~ dot-ted lines!and 0.5~dot-dashed lines!.
7Y. Nabetani, T. Ishikawa, S. Noda, and A. Sakai, J. Appl. Phys. 76, 347
~1994!.
8D. Zhi, H. Davoc, R. Murray, C. Roberts, T. S. Jones, D. W. Pashley, P. J.
Goodhew, and B. A. Joyce, J. Appl. Phys. 89, 2079~2001!.
9I. Kegel, T. H. Metzger, A. Lorke, J. Peisl, J. Stangl, G. Bauer, J. M.
Garcia, and P. M. Petroff, Phys. Rev. Lett. 85, 1694~2000!.
10
M. Henini~private communication!.
11A. D. Andreev, J. R. Downes, D. A. Faux, and E. P. O’Reilly, J. Appl.
Phys. 86, 297~1999!.
12R. W. Keyes, J. Appl. Phys. 33, 3371~1962!. 13
M. A. Cusack, P. R. Briddon, and M. Jaros, Phys. Rev. B 54, R2300
~1996!.
14H. Jiang and J. Singh, Phys. Rev. B 56, 4696~1997!. 15P. N. Keating, Phys. Rev. 145, 637~1966!.
16R. M. Martin, Phys. Rev. B 1, 4005~1969!. 17
Landolt-Bornstein, Numerical Data and Functional Relationships in
Sci-ence and Technology, Group III, vol. 17a, edited by O. Madelung
~Springer, New York, 1982!.
18C. G. Van de Walle, Phys. Rev. B 39, 1871~1989!. 19
J. H. Davies, The Physics of Low-Dimensional Semiconductors—An
intro-duction~Cambridge University Press, Cambridge, 1998!.
20H. C. Casey and M. B. Panish, Heterostructure Lasers, Part B: Materials and Operating Characteristics~Academic, New York, 1978!.
21G. Bastard, Monographies de Physique—Wave Mechanics Applied To Semiconductor Heterostructures ~Les Editions de Physique, Les Ulis, 1992!.
22L. R. C. Fonseca, J. L. Jimenez, J. P. Leburton, and R. M. Martin, Phys.
Rev. B 57, 4017~1998!.
23
M. Grundmann, O. Stier, and D. Bimberg, Phys. Rev. B 52, 11969~1995!.
24S. L. Chuang, Physics of Optoelectronic Devices ~Wiley, New York,
1995!.
25M. P. C. M. Krijn, Semicond. Sci. Technol. 6, 27~1991!. 26
R. Braunstein, Phys. Rev. 130, 869~1963!.
27M. Cardona and N. E. Christensen, Phys. Rev. B 37, 1011~1988!. 28
C. Miesner, O. Ro¨thig, K. Brunner, and G. Abstreiter, Appl. Phys. Lett. 76, 1027~2000!; C. Miesner, K. Brunner, and G. Abstreiter~unpublished!.
29
M. Hallsal and A. Dunbar~private communication!.
30J. L. Liu, Y. S. Tang, K. L. Wang, T. Radetic, and R. Gronsky, Appl. Phys.
Lett. 74, 1863~1999!.
31
V. Le Thanh, V. Yam, P. Boucaud, F. Fortuna, C. Ulysse, D. Bouchier, L. Vrvoort, and J.-M. Lourtioz, Phys. Rev. B 60, 5851~1999!.
32
M. A. Cusack, P. R. Briddon, and M. Jaros, Phys. Rev. B 56, 4047~1997!.
33K. H. Schmidt, G. Medeiros-Ribeiro, M. Oestreich, P. M. Petroff, and G.
H. Doh¨ler, Phys. Rev. B 54, 11346~1996!.
34R. Murray, D. Childs, S. Malik, P. Siverns, C. Roberts, J.-M. Hartmann,
and P. Stavrinou, Jpn. J. Appl. Phys., Part 1 38, 528~1999!.
35
S. Noda, T. Abe, and M. Tamura, Physica E~Amsterdam!2, 643~1998!.
36M. Califano and P. Harrison, Phys. Rev. B 61, 10959~2000!.
37N. Liu, J. Tersoff, O. Baklenov, A. L. Holmes, Jr., and C. K. Shih, Phys.