THE SCOTTISH ECONOMY
SHORT-TERM FORECASTS*
This section presents short-term forecasts for the
quarterly growth rates of Scottish manufacturing
(Division D of the 1992 SIC) output.
[image:1.514.280.481.140.415.2]The present forecasting period extends to 1995Q2.
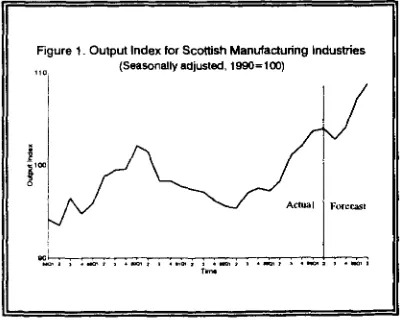
Figure 1 depicts the actual growth rates for Scottish
manufacturing output from 1988Q1 to 1994Q1 and
the forecasts for 1994Q2 to 1995Q2. As is clear
from the figure, the output of Scottish
manufacturing industries is predicted to grow
steadily in 1994 except for the third quarter. For
1994 as a whole, the output of Scottish
manufacturing industries is predicted to rise by
around 3.1% over 1993. The first half of 1995 is
also predicted to be a period of steady growth, with
even faster growth rates than in 1994. Further
details of growth rates for Scottish manufacturing
outputs are presented in the following table.
[image:1.514.50.251.400.563.2]Development of the short-term model of
the economy was made possible by the
funding of a three-year research fellowship
by TSB Bank Scotland.
TABLE 1. QUARTERLY GROWTH OF SCOTTISH MANUFACTURING OUTPUT
1992/91 1993/92
91Q4/90Q4 92Q4/91Q4 93Q4/92Q4 94Q1/93Q4
Forecast 94Q2/94Q1 94Q3/94Q2 94Q4/94Q3 95Q1/94Q4 95Q2/95Q1
1994/93
(%)
-0.8 3.4
-2.1 1.4 4.7 1.6
0.8 -1.1
1.2 3.0 1.6
3.1
SCOTTISH CHAMBERS' BUSINESS SURVEY:
SECOND QUARTER 1994
The SCBS is conducted by Strathclyde University's
Fraser of Allander Institute together with the
Chambers of Commerce of Aberdeen, Central,
Dundee, Edinburgh, Fife and Glasgow, is the largest
and most comprehensive regular survey of business,
employment and other issues affecting the Scottish
business community. In the present survey, which
was conducted during June, 973 firms responded to
the questionnaire.
BUSINESS PERFORMANCE
Business Confidence
who were more optimistic in the first quarter. In the second quarter, Manufacturing respondents were more optimistic than they were in the same period a year ago, with a net balance of 38% of respondents reporting higher optimism. This compares with the situation in the first quarter where a balance of 23% of respondents were more optimistic than in the same period a year earlier.
In Construction, optimism continued to rise and at a slightly faster rate than in the first quarter. A net balance of 9% of respondents reported that they were more optimistic than in the previous quarter. This compares with a 7% balance of respondents who were more optimistic in the first quarter over the fourth quarter 1993. A net balance of 35% of respondents reported that they were more optimistic than they were a year ago, an improvement of 6 percentage points on the response in the first quarter.
In Distribution, confidence surprisingly fell in Retailing, although this follows the considerable reduction in the rate of increase in the first quarter. In contrast, confidence rose in Wholesaling at much the same rate as in the first quarter. In Retailing, a net balance of 15% of respondents were less optimistic about the general business situation than they were in the first quarter, which compares with a positive balance of 1% in the first quarter. In Wholesaling, a net balance of 11% reported that they were more optimistic. This can be compared with a positive net balance of 12% in the previous quarter. A net balance of 26% of wholesalers reported that they were more confident than they were year ago, while a net balance of 6% of retailers were less confident, a fall of sixteen percentage points on the previous quarter.
Optimism among respondents from the Tourism and Leisure sector continued to rise and again at a much faster rate than in the first quarter. A net balance of 36% of respondents reported that they were more optimistic about the general business situation than they were three months earlier, compared with a balance of 2 1 % in the first quarter. A net balance of 18% of respondents were more optimistic in the first quarter than in the same period of 1993.
Orders and Sales
In Manufacturing, orders and sales appeared to be
rising strongly. For orders, a net balance of 29% of respondents reported an increase while, for sales, a balance of 28% of firms experienced a rise. These figures compare with positive balances of 16% and
12%, respectively, in the first quarter. Orders and sales from all principal markets are now rising strongly and at faster rates than in the first quarter. Export orders and sales appear to be the most buoyant by an appreciable margin, followed by demand from the domestic Scottish market and rest of UK markets.
In Construction, orders are now rising at a faster rate than in the previous quarter. A net balance of 11 % reported an increase in orders compared with 5% in the fourth quarter. Orders from the private sector continue to be the source for the growth in demand, while orders from Central Government and Other Public Sector remain depressed.
Retail sales appear to have fallen in the second quarter. A net balance of 6% of retailers reported that sales had fallen, compared with a balance of 8% reporting a rise in sales in the previous quarter. In Wholesaling, sales rose at a faster rate than in the first quarter. A net balance of 24% of respondents reported a rise in sales, compared with a balance of 18% reporting a rise in sales in the last survey.
Tourism demand rose in the most recent quarter, after falling in the first quarter. A net balance of 18% of companies reported an increase compared with the balance of 5% reporting a fall in the three months to March. Demand from all principal markets rose during the quarter, with demand from abroad somewhat stronger than from the domestic Scottish and UK markets.
Stock Adjustments
Stocks of finished goods in Manufacturing fell again in the current quarter, with a net balance of 15% reporting a decrease. Stocks of raw materials also continue to be run down, while work in progress continues to rise.
Finance and Investment
however, the demand for finance for investment in
plant and equipment appears to have fallen again
after rising in the first quarter and falling in the
fourth quarter 1993.
Manufacturing investment intentions in plant and
machinery were revised upwards again in the
present quarter and respondents expect to revise
them up further in the third quarter. There was a
further deterioration in manufacturers' investment
intentions in land and buildings, with a net balance
of 6% of respondents reporting a decline. In
Retailing and Wholesaling, investment intentions
continue to be positive. Net balances of 10% and
16% of retail and wholesale respondents,
respectively, reported an upward revision in
investment intentions compared to the same period
a year ago. The investment intentions of
Construction respondents are now favourable for
plant and equipment, but continue to decline for
investment in buildings.
Expectations
The outturn in the second quarter was generally
better than expected by respondents in the first
quarter. However, in Retailing, first-quarter
expectations were confounded by the decrease in
sales in the present quarter. In Tourism the outturn
for demand was somewhat less strong than expected
in the first quarter.
Demand conditions are generally expected to
improve further in the third quarter of 1994. The
Tourism sector is anticipating a faster growth of
demand than the outturn in the present quarter. In
Manufacturing, the growth of demand is expected
to be about the same, while in Construction and
Wholesaling the rate of growth is expected to slow
down slightly. In Retailing, there is the expectation
that demand will rise again, although this is held by
only a small net balance of 3%.
PRIMARY
CONSTRUCTION
The Scottish Office Index of Construction figures
for the first quarter have just been published and
show a continuing improvement, with a 2.2%
quarterly increase, to stand at 112.2. This is an
increase of 4.4% in the year on year comparison
and is evidence of recovery in the Scottish
construction industry.
The industry in the UK as a whole is also
exhibiting signs of recovery, with a quarterly
increase of 1.1%, to stand at 86.8 which, due to its
proximity to the turning point (q3 1994), is 0.5%
down in the year on year comparison. However,
the fragility of the recovery in the UK as a whole
and the recent increase in interest rates, must be a
worrying factor for constructors.
In the second quarter 1994, the Scottish Chambers
Business Survey (SCBS) showed that overall
business confidence was higher than in the first
quarter, but lower than that expressed in the fourth
quarter 1993. Compared with the second quarter
1993, a net 35% were more confident.
Total new orders continued to improve for a net
11 % of respondents and a balance of 7% predicted
a further increase in the next quarter. The recovery
continues to be led by the private sector, with
central government and other public service orders
continuing to decline. The largest limiting factor to
output was cited as a lack of orders/sales.
Average capacity utilisation increased over the
quarter to stand at 79.7%, an increase of some
2.5%. A small balance (2%) reported utilizing less
capacity than in the same quarter in 1993. Work in
progress was increased for a net 14% of
respondents.
Investment intentions for plant and equipment were
revised upwards in the second quarter, mainly for
replacement purposes by a balance of 4% of
respondents. Land and existing buildings investment
intentions however were revised downwards for a
net 1%.
quarter three was expected to improve.
Almost half of respondents attempted to recruit during the second quarter and 8% of those experienced increased difficulties. Problems were reported in finding suitable professional and managerial (22%), technical (19%), skilled manual (24%) and in other categories.
Nearly a quarter of respondents increased employee remuneration, with an average increase of 2.6%, which was the lowest reported increase in any of the SCBS sectors.
Brick sales in the UK were the highest in five years, a good leading indicator of improvements in the building trade, according to recent Department of Environment figures. Building costs are now almost one third cheaper in real terms than at the height of the eighties construction boom. This was the finding of a recent report released by the Royal Institution of Chartered Surveyors, who state that this is due to a combination of low land prices, cheaper labour and increased efficiency amongst building firms. It is thought that this situation will continue for the next few years. The RIAS building cost department estimates that prices will rise by around 5% annually during the next two years, leaving nominal building costs still 6% below their 1989 peak. When compared with a likely 8% rise in retail prices over the period, the basic message emerging from the report, issued amid further industry gloom, is that now is the time to buy.
While the housing market is driven essentially by demand, the construction side is still primarily cost sensitive and builders are likely to become far more choosy about their tendering in future. The tendency to go for turnover at any cost is now becoming a phenomenon of the past as constructors are taking now a more realistic view of their spare capacity. As construction and land prices rise faster than house prices and industrial and commercial rents, there is a danger that developers may cancel some of their more ambitious projects as margins are squeezed.
Taylor Woodrow Construction Holdings is to purchase the former Howard Doris oil platform construction yard at Kishorn. At its peak in the late 70s the yard was the biggest employer in the Highlands, with a 3,500 workforce. The site has remained derelict since 1986, although there is little that needs to be done to get it back into production.
The National Council of Building Material
Producers' forecasting panel stressed the importance of the government maintaining current expenditure plans in the November budget, as 39% of total output in this sector relates to the public sector. In the light of the recent interest rate raise, this becomes even more important as private sector growth is so closely linked to the overall performance of the economy.
The harmonization of business rates north and south of the border could see Scotland hit by a "particularly iniquitous" penalty, warns Charlie Crighton, Chesterton's Director of Rating in a message to key property owners and landlords. The changes proposed for the 1995 revaluation could lead to increased costs and "progressive vandalism" leading to disincentives for developers and investors considering further investment in Scotland. The Scottish system of granting rates relief on a building after it has stood empty for three months, could be replaced by the English Practice requiring the landlord to pay half rates until it is occupied. This could lead to the English and Welsh practice of 'soft stripping' buildings to render them incapable of beneficial use becoming a feature of the Scottish market.
The Halifax building society is reported to be on the look out to merge with a rival, with rumours that the preferred target is the Leeds Permanent. The Leeds had planned a link up with the National and Provincial, but that was called off. In their latest house price index, the Halifax report that average house prices in Scotland, continued their upward trend in the second quarter 1994, rising by 1.7% and by 0.4% over the year. This compares with a UK wide quarterly increase of 1.0% and an annual increase of 0.6%.
FISHING
In the first seven months of 1994, the total value of landings of fish by British and foreign vessels in Scotland was £162,825,000, 0.8% lower than the figure for the corresponding period of 1993. At the level of the major classifications of fish, the fall was wholly the result of lower volumes and values of demersal landed: the volume of landings was down 5.4% on the 1993 figure whilst the value of landings was 8.4% lower. For the other major species, the value and volume of pelagic landings rose, whilst for shellfish the value increased despite falling volume.
important by value. The most striking difference
from the previous year is the large fall in the
volume and value of the landings of cod. The
value is down by 22.2%, volume by 23.6% and the
absolute fall in the value of landings is £5,822,000.
For the other economically important species,
whiting similarly showed a large fall in both the
value and volume of landings. However, for
haddock and monkfish, the value of landings
increased, by 6.8% and 11.9% respectively.
For the pelagic, there has been a big increase, in
terms of both volume and value of landings of the
major species, mackerel. The value of landings
increased by £879,000, a proportionate increase of
8.5%. The landings of herring also rose in both
volume and value terms (9.2% and 8.5%
respectively) though there was also a large fall in
the volume and value of landings for blue whiting.
In the case of shellfish, Norway lobsters make up
over a half the total value of landings in this
category. A 4.8% reduction in the value of
landings was experienced for this species, the result
of a 2.6% increase in price accompanied by a 7.4%
reduction in the volume of landings. For other
species there was a 70.7% increase in the value of
scallops landed, almost wholly due to the increased
volume.
Whilst the value of total landings fell as compared
with the same period in 1993, the value of landings
from British boats increased by £1,719,000, an
increase of 1.1%. This means that the share of the
value of landings going to British boats increased
from 91.6% to 93.5%.
MANUFACTURING
FOOD, DRINK AND TOBACCO
The Index of Production for the Food, Drink and
Tobacco (FDT) sector in Scotland fell by 4.3% over
the first quarter of 1994, the largest fall recorded by
any manufacturing sector in Scotland. Both Food
and Tobacco (5%) and Drink (4%) fell, and the fall
in FDT in Scotland is in contrast to the 1% rise in
FDT output recorded across the UK over the same
period. However, the Scottish figure incorporates
revised data, so there is the possibility that the drop
may reflect a one-off adjustment due to this.
Quarterly changes of the magnitude are not
common in FDT. Over the four quarters to Ql
1994, the value of output in Scotland is unchanged,
also the case across the UK.
The more up to date results from the July Scottish
Chambers' Business Survey (SCBS) tend to show
a more optimistic picture than that given by the
Index. A net balance of respondents (20%) felt
more optimistic about immediate prospects than
they did three months previously and 39% of
respondents reported a rising trend in new orders,
compared to only 15% reporting a decrease. While
both Scottish and other UK orders have picked up
(with net positive balances of 14% and 13%
respectively) the largest surge has been in export
markets, where 40% reported an increase in trend
compared to only 8% reporting a decrease. In
addition, a small balance of firms, 9%, had revised
investment intentions upwards, for plant and
equipment, in the three months to July. Despite
this, capacity utilisation remains low at 73% and
67% of firms confirmed to cite lack of orders in the
factor most likely to limit output in the short term.
Food, drink & tobacco industries output
m (1990=100)
1 0 0 / ^
8 0
65
8 0
7 5
-7o - i — \ — i — i — i — i — i — i — i — i — i — i — i — i — i — i — i — i — i — i — i — i — i — i — i 1B68 1060 1000 1001 1002 1 0 M 1004
Elsewhere, the Dundee-based company Watson and Philip has opened a distribution centre in Uddingston, creating 80 new jobs. Watson and Philip supply catering services to hotels, pubs and the public sector and has recently also began to operate its own convenience stores, opening 24 in the first half of this year.
ELECTRONICS
The Index of Production for the electronics sector in Scotland increased by 4% in the first three months of 1994 which, although a larger increase then seen in any other manufacturing sector, is a relatively small increase given the recent past performance of the industry. This is also shown by the fact that output in the sector across the UK increased more than in Scotland, by 5%.
The July results from the Scottish Chambers' Business Survey (SCBS) do, however, show signs of continued growth in the sector, with a positive balance, 8%, of respondents feeling more optimistic about business prospects than three months previously (although it is perhaps more important that a net balance of 35% felt more optimistic than at the same time in 1993). There was also a upward trend in new orders, with 51% of companies reporting an increase in the three months to July compared to 27% reporting a decrease in trend, with the strongest growth coming in the main export markets in Europe. Capacity utilisation is still relatively low at 70%, however, although a net 11% of companies had increased capacity since the same time in 1993.
However, despite the strong growth in output in electronics in Scotland - up 62% since 1990 during high time the output of all manufacturing industry, including electronics, increased by only 3.7% - it still appears to be the case that Scottish companies are unable to take full advantage of the opportunities offered. A recently published survey
by SPEED, shows that the market share of Scottish companies supplying the electronics sector has fallen to only 5%, down from the 1992 figure of
12%. The percentage supplied by the rest of the UK also fell, mostly due to a rise in supplies from the Far East.
CHEMICALS
Chemical and man made fibres output showed a rise during the first quarter which was slightly in excess of the average rise for manufacturing as a whole. The latest Index of Production and Construction showed a 2% increase in the first quarter 1994 compared to the fourth quarter of 1993, and a 5% increase compared to the first quarter of 1993. Compared to the previous four quarters the value of production shows no change. These results are confirmed by the findings of the Scottish Chambers Business Survey which indicates that a net of +26% of Chemical respondents reported being more confident about the general business situation than in the previous quarter whilst a net of +35% indicated that they were more optimistic than in the same quarter of 1993. The upward trend in confidence undoubtedly reflects the continued upward trend in orders/sales.
The upward trends in both orders and sales both strengthened to nets of +30% and orders are forecast to improve further in the current quarter. Export orders and sales accelerated to nets of +47% which compensated for poorer than expected rises in rest of UK orders/sales. Respondents expect this to be the case in the three months to September with poor rest of UK orders/sales offset by strong export activity.
utilisation rose 5% points to 77%, a net of 32%
indicated that they were utilising more capacity than
in the same quarter of 1993.
Investment trends in plant and equipment were
slightly higher than expected and respondents
revised investment intentions in land and buildings
downwards. Investment authorised during the
second quarter was directed towards replacement
[25%], increasing efficiency [25%], introducing new
technology [19%], expanding capacity [12%],
introducing new projects [12%] and reducing labour
[6%].
The decline in employment accelerated to a net of
-9%, however, respondents increased their use of
part time, temporary, sub contracting and
self-employed staffs. The decline is forecast to
weaken during the current quarter and firms intend
to further increase use of part time, temporary, sub
contracting and self-employed staffs.
The pharmaceutical industry increased its trade
surplus by 26% [£1.672 compared to £1.329bn in
1992] last year, the biggest percentage increase
since 1980. Success is based on the industry's
research and development spending which is
essential if it wishes to continue making advances
in health care and new medicines.
In August Smithkline Beecham agreed to pay £1.88
billion to buy Sterling Winthrop in a deal that will
make it the worlds biggest supplier of over the
counter drugs, subject to approval by the US
authorities. This brings together Sterling Health's
big selling brands such as Panadol and Andrews
together with Smithkline's Eno and Turns. It is the
second multi-billion dollar deal for Smithkline since
Mr Jan Leschly became chief executive in April,
the following month it bought the US drugs
distributor Diversified Pharmaceutical Services. This
follows a trend in the pharmaceutical industry at
present of companies merging and consolidating in
attempt to gain control in the market for generic
drugs, a competitive yet growing area. This is a
result of pressure from customers, either employers
who pay health insurance premiums in the US or
governments elsewhere.
Smithkline Beecham faces a court case in the
United States, its rival Wellcome claiming that
Famvir, the drug launched in July by Smithkline,
infringes the patents on the Wellcome's best selling
drug Zovirax, a treatment for Herpes and shingles.
Wellcome hopes to win an injunction against the
sale of Famvir in the US and is claiming
unspecified damages for loss of sales. If Smithkline
Beecham lose the action it is probable that they
would be forced to pay a royalty and withdrawal of
the drug is unlikely.
German pharmaceutical sales appeared to have
recovered from the depression of 1993 which was
mainly attributed to government imposed price cuts
and health spending curbs. Hoechst and Bayer, the
German chemicals giants, both reported an increase
in first half profits, 39% and 30% respectively.
However, both expect to continue to suffer from
healthcare reforms announced in Europe during
August and though the German market is beginning
to recover Hoechst said that product prices
remained too low although raw material costs were
rising.
TEXTILES, FOOTWEAR, LEATHER AND
CLOTHING
The Index of Production for the Textiles, Footwear,
Leather and Clothing (TFLC) sector in Scotland
rose by 1% in the first quarter of 1994 to stand at
97 (1990 = 100) and an examination of the recent
behaviour of output since the first quarter of 1993
shows an increase in output in every quarter since
then. In the year to Ql 1994, the value of output
rose by 3%, compared to no change in the industry
across the UK.
1 0 5 ^
1 0 0
0 5
0 0
8 5
8 0
7 5
-Textiles, footwear, leather & clothing (1990=100)
1068 T98S 1000 1001 1092 1003 1904
is the factor most likely to limit output in the short term, this is low by the standard of other industries and 18% felt that plant capacity was the factor most likely to limit output in the near future. Perhaps most significantly, a net balance of 25% of companies reported an increased trend in total employment in the three months to July.
Recent moves to upgrade standards and provide more effective marketing in the Harris Tweed industry by the formation of a Harris Tweed Promotional Council (see QEC, September 1993) have been thrown into disarray by personal disputes between the islands' two mill owners. The HTPC has now been disbanded and the absence of an industry-wide body means that some of the £10 million of public money promised can not now be committed. Expenditure aimed at upgrading the quality of weaving will still go ahead, but the two mill owners will now be responsible for their own marketing. Some £1 million of money aimed at promoting the industry abroad via the HTPC has now been lost.
Finally, Richard of Aberdeen has announced the closure of its printed carpet factory in Northern Ireland with the loss of 175 jobs, a move which will result in some work being moved to its Scottish factory at Cumnock in Ayrshire.
PAPER, PRINTING AND PUBLISHING
The latest Scottish Index of Production and Construction for the first quarter of 1994 shows a 2% increase in output growth in the paper, printing and publishing sector since the fourth quarter of 1993. Comparing output growth in the last 4 quarters with growth in the preceding 4, annualised growth also stands at 2%. UK Index of Production and Construction figures indicate a 2% increase in growth in the first quarter, with annualised growth of 4%
Figures from the latest Scottish Chambers Business Survey show a consolidation of the increased confidence in the paper, printing and publishing industry. A net 29% of respondent firms feel more optimistic than in the previous 3 months, with a net 48% more optimistic than in the same period in 1993. 53% of firms have experienced an increase in the level of new orders. In Scottish, UK and export markets a majority of respondents report a rise in the number of new orders. A net 29% of firms report a higher volume of new Scottish orders with a net 50% report increases in new export orders. Further improvements are also expected in
the next 3 months, with a net 28% of respondents expecting additional increases in the level of new orders.
Almost 58% of firms state that the total volume of sales have increased in the last quarter. Exports sales, in particular, appear strong, with a net 45% of firms reporting a higher volume of total export sales. Total domestic sales have also increased, with Scottish and UK sales rising for a net 31 % and 3% of respondents respectively. Those surveyed also expect business to improve further in the next quarter, particularly in the export sector. Investment in plant and equipment has risen for a net 29% of firms, with a net 28% expecting further investment in the next quarter. Investment in land and buildings has fallen for a net 8% of firms, with another slight decrease expected in the next 3 months.
1 0 5 1 0 0
0 5
0 0
8 5
8 0
7 5
-Paper, printing & publishing output (1990=100)
1988 1969 1000 1001 1902 1903 1904
The labour market, where caution has prevailed in the recent Business Surveys, appears more positive. A net 11% of respondents have increased levels of employment, with a net 7% of firms reporting an increase in their full time workforce. A slight downturn is expected in the next quarter, however, with a net 2% of firms expecting a fall in their employment levels.
the high quality paper market where prices have
risen, on average by 20%. Paper producers will
inevitably have to pass costs onto the newsprint
sector too, according to chairman of Bridgewater
Paper, Andre Van Hattum. This will spell bad
news for newspaper industry, especially at a time
when many of the quality nationals are waging a
price war.
Industrial action has been threatened by staff at the
Daily Record and Sunday Mail in advance of the
newspaper group's forthcoming move form
Anderson Quay to Cardonald. The Graphical,
Paper and Media Union representatives claim that
the company has planned wage cuts of between
20%- 30%, compulsory redundancies and an
increase in working hours.
Economic recovery in the printing industry has been
described as "erratic" and generally less successful
than had been hoped, according to a survey
conducted by the British Printing Industries
Federation in June. Although most companies
believe that although the "general state of trade is
easier than 3 months ago", there is only guarded
optimism for the next quarter. Reasons for the
poorer than expected performance include the rising
costs of printing papers and increased competition
in the printing industry, which has squeezed profits.
Also exporters are finding it difficult to maintain
their position in the world market, due to strong
international competition.
Alna Group, the printing and office equipment
company based in Broxburn has called in the
receivers. The receivers, Scott Oswald state that
the company, which had an annual turnover of
£6.5m in 1993 were breaking even but were
suffering from a "cash flow problem". Lack of
working capital meant that the firm was unable to
fund additional growth and it instructed company
bankers, the Bank of Scotland to call in receivers.
MECHANICAL ENGINEERING
After six consecutive quarterly falls in output, the
2.4% growth in output in the first quarter this year
as recorded in the latest official index of production
series is particularly welcoming news for the
Scottish mechanical engineering industry. Although
this growth performance is overshadowed by the
4.8% growth enjoyed by the UK mechanical
engineering industry as a whole in the first quarter
this year, it signifies a long-waited upward turning
point in the Scottish industry.
This healthy upturn in the Scottish industry is also
evident from the latest Scottish Business Survey
(SBS). Among the corresponding firms, a net 23%
were more optimistic about the general business
situation, in contrast to a net of 1.4% being less
optimistic as recorded in the previous survey.
Compared with the same period a year ago, a net
31% of corresponding firms expressed increased
business optimism. This upturn in business
confidence is backed by encouraging figures for
new orders and sales. Although new orders from
and sales to the domestic markets remained rather
sluggish in the second quarter, this is expected to
change and considerably more firms expected
increases in new orders from and sales to the
domestic sources in the third quarter. Moreover, a
strong recovery in export orders and sales was
obvious in the second quarter and these are
expected to increase over the third quarter.
There was hardly any change to the trend of
running down on stock of finished goods and raw
materials, and such a trend is expected to persist
over the third quarter. However, the volume of
work in progress is expected to pick up and the
firms' capacity utilisation rate (at 74.4%) was
slightly higher than that recorded in the previous
survey. Employment prospects are also improving
in general, particularly for full-time, male and
temporary employment. The restraint on increases
in wages and salaries is still evident in this industry,
and a net 27.4% of firms are increasing their
provision of training.
WHISKY
surprisingly, production also rose sharply in the second quarter of 1994. In the three months from April to June, 99.95 million LPA of whisky was produced, 3.2% more than in the corresponding period last year. This occurred despite the fact that there were four fewer distilleries producing than in the second quarter of 1993 (80 compared with 84). Output has been falling steadily for the last three years, and this is the first quarterly increase of this type to occur since late 1990. It remains to be seen whether this is merely a blip or a conscious decision by distillers that supply and demand are now in line.
Total whisky production
1 5 0 0 0 0
1 4 0 0 0 0
1 3 0 0 0 0
1 2 0 0 0 0
1 1 0 0 0 0
10OOQ0
0 0 0 0 0
8 0 0 0 0
7 0 0 0 0
0 0 0 0 0
5 0 0 0 0
. 0 0 0 0
Litres of pure alcohol - thousands
in ^
Vi^rrfT
| ii 8 I
107S 16*0 1MZ 1»4 1BM 1MB 1000
. » . ,
i/Vuv
'1
1 9 0 2
Once again a major change in ownership has occurred in the Scotch whisky industry, and once again more of the control of the industry has been lost to Scotland. In July Suntory acquired Morrison Bowmore Distillers, the Glasgow-based company which owns three malt distilleries. Suntory already owned 35% of Morrison, but had always shied away from outright control of a Scotch whisky company; clearly this strategy has now changed. Suntory thus become the third Japanese concern to own distilleries in Scotland outright, the others being the Takara and Okura consortium and Nikka Distilling.
This acquisition has raised a certain amount of speculation about Macallan-Glenlivet, in which Suntory also holds a 25.5% stake. Indeed, Macallan is more than 50% foreign-owned, with a further 26% of the company's share capital indirectly owned by Remy Martin. With the acquisition of Invergordon Distillers by Whyte & Mackay last October, Macallan-Glenlivet is now one of only four (nominally) independent Scottish whisky companies with a stock exchange listing; the others are Burn Stewart, Macdonald Martin Distilleries and Highland Distilleries. These and other non-listed Scottish-controlled firms are now estimated to control 24.5% of malt whisky production capacity and 21.2% of grain whisky
capacity. About half of total Scotch whisky production capacity is owned by UK groups, and the remainder by various European, North American and Japanese concerns.
SERVICES
DISTRIBUTION
The overall business situation for wholesale respondents to the latest SCBS for the second quarter 1994 showed an improvement in the balance of optimism, with a net 12% being more optimistic than they were in the previous quarter. This was an increase of similar strength to that experienced in the first quarter. Year on year confidence continued to rise, with a net 26% seeing an improvement compared with the second quarter of 1993.
Wholesale sales showed a slightly stronger upwards trend than in the previous quarter and it was expected that this upwards trend would continue. The largest restraint to trade was cited as stock shortages with, credit facilities, insufficient floorspace and labour shortages also being reported as problematic. There was an upwards revision of investment intentions, compared with the previous period.
Wholesale employment increased for a balance of respondents, in male, full-time, part-time and temporary respondents. There was a reported fall in overall female employment. Over a third of respondents increased employee remuneration by an average of 3.8%.
In retailing, on the other hand, confidence fell for a net 15% of respondents. The year on year comparison was also negative with 6% being less optimistic than in the previous year. The poor level of sales is without doubt the major factor in these falls.
net 10% of respondents.
The declining trend in employment strengthened in
the second quarter, with a net 14% reducing overall
requirements. Female, full-time, part-time and
temporary employment were all reduced in the
second quarter. More than half of respondents
reported increasing wages and salaries during the
quarter, with an average increase of 5.7%. This
high figure reflects increasing competition amongst
retailers for suitable employees, as reported by
respondents. More than 40% of respondents who
recruited reported difficulties in the securing
suitable professional and managerial, skilled
manual, young people and part-time employees.
Retail sales grew only modestly in July despite
heavy summer discounting, according to the latest
UK figures. The British Retail Consortium, which
represents 90% of retailers, warned that small shops
were facing "very difficult conditions" in spite of
the growth and called for government to hold
interest rates down. Clearly this did not happen.
It is inevitable that the recent interest rate increase
will effect the recovery in the distribution sector
and lead to a tighter squeezing of margins. The high
degree of cut-price competition in this sector, rules
out passing on all of the increase to the customer
and it is likely that some, struggling firms,
especially in the retail sector, will go to the wall as
a result.
John Menzies, Scotland's largest newspaper
distributor and newsagent returned reasonable
profits on the year to April with a 14% increase.
Two thirds of their business is from the distribution
side and they expressed grave concern about the
current price wars in the newspaper trade. This
business is high volume low margin and it is
anticipated that if lower prices are to become the
norm, then it is only a question of time before
margins are correspondingly reduced. This is
something that will be strongly resisted by John
Menzies amongst others.
The Office of Fair Trading's decision to refer the
net book agreement to the restrictive practices court,
poses no threat to W H Smith, whose retail division
also includes Waterstones, Our Price and Virgin,
according to their chief executive Sir Malcolm
Field,. He says that they already face a competitive
book market in the United States and already have
a strategy for prospering without the net book
agreement. Other booksellers however, may not
share his optimism.
Argyll Group, the UK's third largest food retailer
and the largest private sector employer in Scotland,
has sold 151 of its smallest Lo-Cost and Presto
supermarkets for £19.7M to a consortium of 5
companies operating under the Spar banner.
Analysts played down the importance of the deal
and focused on the fate of the remaining 144 stores
still in Argyll's hands, 114 of which are in Scotland.
A £200,000 subsidy from The Scottish Office,
Glasgow District Council and the Healthy
Castlemilk urban project has enabled two cut-price
supermarkets to open in Castlemilk. The two stores
are badly needed by the 19,000 residents on the
city's south eastern estate, which has always been
short of shops. This project is designed to
encourage healthier eating in the area and has been
launched in conjunction with a cook book.
FINANCIAL SECTOR
Term insurance in its most basic form probably represents the closest product in the life industry to resemble a standard, common commodity item. It is available with a host of bells and whistles such as renewable, convertible, decreasing and expanding terms to name a few, but in its most basic, level term form it is a more or less standardised contract which pays out the same amount on death at anytime during the life of the policy. The contract generally has few complications and exclusions so that policies are more or less directly comparable and can be viewed as a standard commodity item, the cost of which may be taken to indicate the competitive position of the companies. Of course, some life companies will argue, quite reasonably, that it is not a market they compete in for a variety of reasons, not least low profit margins, the difficulty of providing value added to such policies and of competing on quality in such a market. Despite such claims it is reasonable to believe that, on the whole, the price of term assurance may be taken as a competitive yardstick. Companies with low expenses and efficient operations will be able to offer term assurance at lower prices than companies with high expenses and inefficient operations. It is possible that they do not choose to do so. Some companies may feel that profit margins are such that it is a business best left to specialists and is merely offered by the company at poor rates as part of a portfolio, a service to clients. Whilst admitting such possibilities and accepting the limitations of any analysis of this kind it remains reasonable to interpret low premiums as a signal that a company is efficient. In the long term the only companies that can offer low premiums will be those that are efficient and have low costs. In the short term a company may offer low premiums to spoil the business for others and gain publicity but in such a basic commodity with little publicity value the possibility appears remote.
Financial Adviser provided data on 46 life assurers including six Scottish companies (five of them independent), for six different policies. All the policies were for a ten year term and offered insurance for males and females aged 30, 45 and 60. For each policy the cost of acquiring £50000 of cover was provided for each combination of sex and age (next birthday). A number of factors stand out in the comparisons. From the client's perspective most important perhaps is the significant variation in cost. Across the 46 companies the cost of basic term assurance for a 30 year old male ranged from the £65 per year initial annual premium of Equitable Life to the £173 per year of Reliance Mutual (although the latter did
provide slightly more cover). For a 60 year old the range was between £419 (Scottish Widows) to £903 (London and Manchester) for a female, and £715 (PPP Lifetime) to £1272 (Scottish Life) for men, a difference of more than £550 or in more prosaic terms, a difference of £10 per week.
Our concern is not with finding the best value for money, important though that is, but rather in identifying the relative competitiveness of the six Scottish Offices in this market against their competitors. One measure of competitiveness of the Scottish companies as a whole is to compare the mean cost of a policy against the mean cost for the other life companies. If we examine the mean premium of the Scottish Offices against their competitors the results are at best mixed, and at worst discouraging. For the policies for men aged 60 the Scottish companies were on average £80 more expensive than their competitors. However, for the younger age groups the Scottish companies were cheaper on average for both males and females aged 30 although the differences, particularly for men, were not large. On average, across all six policies, the Scottish companies were £80 more expensive than their competitors. Consideration of the mean premium is not perhaps the most appropriate way of viewing the relative strength of the companies. An alternative approach is to rank the companies according to their cost for each of the policies with the cheapest company ranked number one and the dearest company ranked number 46. The benefit of this method is that it emphasises the relative position of the companies. Overall, the Scottish life offices as a whole were slightly worse in their mean rank than their competitors. Interestingly though their were enormous differences between the Scottish companies. Their performance was very polarised with the six companies providing both some of the best and some of the worst cost comparisons. Scottish Widows was generally an outstanding performer with the lowest overall costs of any company in the whole survey across all six policies whilst Scottish Life was almost the worst (45th in the rankings out of 46) with the second highest total cost. The differences were substantial. The portfolio of six policies cost £1563 for Scottish Widows, £2833 from Scottish Life (see Table 1).
year old age group might show up very badly.
Unfortunately, the results in the table below do not
suggest that this is a major problem. Poor
companies in one market are often poor in all the
markets. There are exceptions but the overall rank
does not appear to be unfair.
LEVEL TERM LIFE ASSURANCE QUOTATIONS
SELECTED STATISTICS
Scottish Companies
Scottish Amicable Scottish Life Scottish Mutual Scottish Provident Scottish Widows Standard Life
All Companies
Mean Quotation
Minimum Quotation Maximum
Quotation
initial Annual Premiums (£s)
Assuming non-smoker on standard
rates with £50000 initial sum assured Male
30
134 127 102 109
68 89
107
65
173
Male 60
1057 1272 1115 949 721 900
929 715 1272
Female 45
163 197 161 161 110 164
167 76 237
Total (fs) (6 policies)
2436 2833 2261 2196 1563 2083
2157 1563 2888
Kank for each policy and for portfolio of six policies of company
in
Financial Adviser table
Male 30 43
40.5 20 26.5
3 8
Male 60
37
46 44
27.5
2 18
Female 45
23
38
19.5 19.5
2 24
Overall Rank
38 45
29
24 1 18
Source: Raw data from Financial Adviser, August 25 1994
THE LABOUR MARKET
Employment
Recent experience of changes in official estimates
of employment data emphasise the need for caution
amongst those who seek to interpret recent labour
market trends. The quarterly employment
estimates, derived from employer-based surveys, are
beachmarked on the biennial Census of
Employment. Results from the most recent Census
for September 1991, have recently become available
and have necessitated revisions to official
employment estimates for the period after the
previous Census of Employment (September 1989).
Recently a second phase of revisions has been
made, in May 1994, (as was anticipated) following
the selection of a revised panel of employers who
form the basis of the sampling procedures that are
used to estimate total employment. The figures
from September 1992 in Tables 1 and 2 incorporate
these revisions. For September 1993 the effect was
to increase estimated employment by 19 thousand
to 1985 thousands. Of this increase only 5
thousand is attributed to male employment so that
the biggest revision is to female employment
(15,000 or 1.5%). These revisions suggest that, for
the first time, the majority of employees in
employment in Scotland were females in September
1993. This reflects the longer term trend decline in
male employment and rise in female employment.
The upward revisions in estimated employment are
concentrated in part-time female employment, the
estimate of which is raised by 10 thousand in
September 1993 to 445 thousand (a revision of
+2.2%). Note too that, although the numbers of
female employees in employment exceeded the
numbers of males in September (and December)
1993, nearly 45% of female employment is
part-time whereas less than 10% of male employment
falls into that category. The upward revisions to
employment estimates (in September 1993) are
concentrated in Education etc. (+15,000), metal
goods (+7,000) and other manufacturing (+6,000).
Downward revision occurred in Banking (7,000)
and Energy and water (3,000).
The most recent employment data is for March
1994 and these are reported in Tables 1 and 2.
Overall, total employees in employment fell by
around 8,000 (0.4%) in the year to March 1994.
Male employees in employment fell by 13,000
(1.3%), and total female employment rose by 2,000
(0.2%). Part-time female employment rose by
7,000 (1.6%) and part-time male employment rose
by 8,000 or 9.4%.
Over the year to March 1994, the biggest
employment losses occurred in other manufacturing
(10,000 or 5.7%), construction (9,000 or 8.1%) and
energy and water (6,000 or 10.7%). Employment
rose by 4,000 (2.5%) in Banking etc. and by 15,000
(0.7%) in education, health and other services.
Vacancies: stocks and flows
Over the year to July 1994 unfilled vacancies at job
centres in Scotland fluctuated between 18.0 (15.8)
and 20.3 (21.5) thousands on a seasonally adjusted
(unadjusted) basis (Table 3). Vacancies increased
by 2.2 thousand over the year to July 1994 on a
seasonally adjusted basis. The net increase in the
stock of unfilled vacancies conceals much larger
gross inflows and outflows (Table 4). These were
of a similar order of magnitude to the outstanding
stock of vacancies in each month. For example, in
July 1994 inflows of 22.6 thousand were slightly
more than outflows (22 thousand). The short
average duration of vacancies is a sign that
employers on average do not find it difficult to fill
posts because of a continuing slackness in the
labour market (although employers may still find it
difficult to recruit specific skills in particular
locations).
Unemployment: stocks and flows
Recent data on the seasonally adjusted
unemployment stock are presented in Table 5. The
most recent data, of course, reflect the current rules
governing eligibility to claim benefit which have
been in place since September 1988. These reflect
the extension of a guaranteed offer of a YTS place
to all those under 18 who have not found a job,
under the Employment Training Scheme. Under
18s are consequently not entitled to claim benefit
and so are excluded from the unemployment count.
9.9% to 9.3% of the working population. This represents a reduction in the level of unemployment of 5.7%. The aggregate figures reflect a decrease in female unemployment of 3.5 thousand, and a decrease of 10.5 thousand in male unemployment over the year.
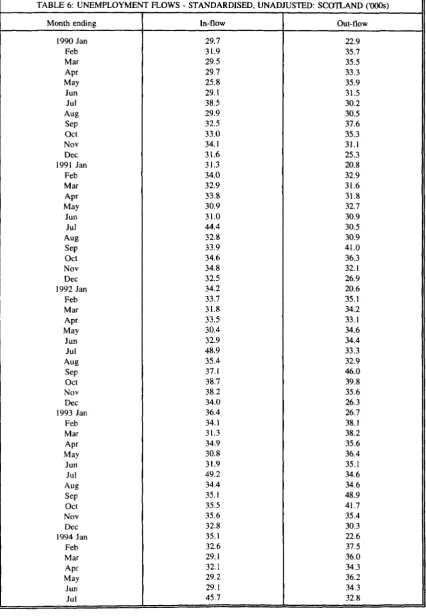
Table 6 presents recent flows into and out of the unemployment stock. In July 1994 inflows were, at 45.7 thousand, about 3.5 thousand less than in the same month of 1993. Outflows were, at 32.8 thousand, 1.8 thousand less than in July 1993. If gross outflows were maintained at their July 1994 level unemployment stocks could turnover in just over 7 months.
BUSINESS SURVEY EVIDENCE
Results from the latest Scottish Chambers' Business Survey indicate a gradual increase in demand for labour in most sectors. Nevertheless, there is much to suggest that the continuing decline in employment reflects people leaving the labour market as well as entering employment.
A net of respondents reported a rise in total employment in Oil, Manufacturing, Wholesale and Tourism, but a decline in employment levels in Construction, Retail and Finance. In the Oil sector the downward trends in employment ended, but the rise is seen as only temporary, and was mainly a result of increased temporary staffs together with a slight rise in the levels of overtime worked.
In Manufacturing a decline in employment had been predicted, but a net of +11% reported an upward trend. This is the largest increase since the revision of the survey in 1990. A net of+6% of respondents expect this rise to continue through the third quarter. The expected upward trend in Construction employment did not occur, and a net of -4% reported a fall in employment. Nevertheless, this fall represents the best second quarter figures since the revision of the survey in 1990. Whilst a slight increase in employment is predicted for the third quarter, overtime levels remain flat.
In Distribution the net of+5% reporting an increase in Wholesale employment was better than had been forecast, and is expected to continue through the third quarter. However, in contrast, the downward trend in Retail employment steepened, and was worse than had been expected. Full time staff were more affected than either part time or temporary. The fall in employment is expected to continue, but to be much reduced in the third quarter.
A net of + 1 % of Tourism respondents reported a rise in employment, lower than had been expected. This rate of increase is expected to increase through quarter three, but as yet there is no increase in the level of overtime working and none is expected for the third quarter.
In Finance the downward trend in employment continued and accelerated, and no improvement is expected. Once again the fall conceals a small rise in part time employment and a larger rise in temporary employment.
The percentages of Manufacturing, Construction, Wholesale and Tourism firms seeking to recruit were the highest second quarter figures since the revision of the survey in 1990. In contrast, the Retail figures were the lowest since 1990. Recruitment activity was generally higher than in the same quarter a year ago, with the exception of trends in Retail and Finance.
70% of Oil respondents sought to recruit. Activity was mainly directed towards the recruitment of suitable technical, managerial and temporary staff. In Manufacturing 52% sought to recruit, an increase over both the previous quarter and the same quarter for 1993. Difficulties were evident in the recruitment of suitable craft and managerial staffs.
47% of Construction respondents sought to recruit, an increase over the previous quarter and the highest second quarter figures. Once again, difficulties were evident in the recruitment of suitable craft and managerial staffs.
In Wholesale Distribution 49% sought to recruit, an increase over previous quarter and the best second quarter figures since 1990. In Retail 45%, and in Finance 18% sought to recruit, in both sectors the lowest quarter two figures since the revision of the survey. 78% of Tourism respondents sought to recruit, the highest quarter two figure since survey started. Difficulties were evident in the recruitment of skilled and managerial staffs.
The decline in the level pay increases appears to be ending. Whilst average increases remain lower than a year ago in Manufacturing and Construction, they are higher than a year ago in the Service sector.
although the average increase in Manufacturing rose
from 3.5% in quarter one to 3.9%. In contrast the
average increases in the Service sector were
generally higher than in either the previous quarter,
or in the second quarter of 1993.
In Wholesale 34% increased pay by an average of
3.8%. In Retail 52% increased pay by an average of
5.7%, an increase over the previous quarter and the
highest rate of increase since the fourth quarter of
1992. A similar pattern was evident in Tourism,
where 3.2% increased pay by an average of 4.5%,
an increase over previous quarter and the highest
quarterly increase since the third quarter of 1992.
The average increase of 2.9% in Finance was down
on the previous quarter but higher than that
recorded in the second quarter of 1993.
TABLE 1 EMPLOYEES IN EMPLOYMENT IN SCOTLAND: INDUSTRY AGGR (Figures in square brackets reflect the 1989 and 1990 LFS. The latest estimates reflect the i
SIC 1980
1979 Jun 1989 Mar
Jun Sep Dec 1990 Mar
Jun Sep Dec 1991 Mar
Jun Sep Dec 1992 Mar
Jun Sep Dec 1993 Mar
Jun Sep Dec 1994 Mar
MALE
All
(1,205) (1,015) [1,016]
[1,018] [1,034] [1,033] [1,027] [1,031] [1,040](1,043) [1,034] (1,043) [1,021] (1,035) [1,015] (1,031) [1,011] (1,026) (1,026) 1,037 (1,020) 1,026 (1,024) 1,023 (1,008) 1,012 (993) 993
980 993 992 982 967
of which P/T
106 103 (105) 85 (112) 87 (123) 92 (119)81 (95) 90
85 91 92 95 93
FEMALE
All
(897) (914) [924]
[941] [934] [939] [930] [942] [943] (943) [946] (949) [936] (941) [944] (953) [947] (954)
(952) 976 (955) 980 (956) 981 (948) 980 (971)984
979 991 994 996 981
of which P/T
(332) (387) [376]
[384] [389] [401] [395] [406] [406] (404) [417] (416) [412] (413) [414] (417) [418] (414)
(416) 427 (418)429 (419)431 (416)432 (436) 442
437 446 450 448 444
TOTAL
(2,102) (1,929) [1,941]
[1,959] [1,968] [1,972] [1,957] [1,974] [1,983] (1,986) [1,980] (1,992) [1,956] (1,978) [1,959] (1,984) [1,958] (1,984) (1.978) 2,013 (1,975) 2,005 (1.979) 2,005 (1,956) 1,992 (1,963) 1,976
1959 1984 1985 1975 1947
Prod/Const
1-5
(831) (587) [601]
[599] [594] [595] [591] [591] [597] (594) [591] (589) [573] (571) [562] (561) [560] (567)
(543) 560 (535) 551 (528) 544 (519) 543 (520) 529
525 525 519 513 501
Source: Department of Employment Gazette
SIC 1979 1989 1990 1991 1992 1993 1994 1980 Jun Sep Dec Mar Jun Sep Dec Mar Jun Sep Dec Mar Jun Sep Dec Mar Jun Sep Dec Mar AgricV forestry/ fishing 0 48 [29] [30] [28] [28] [30] [30] 29 [27] 27 [28] 28 [29] 28 [29] 28 28 28 27 27 26 26 27 27 25 25
TABLE 2 EMPLOYMENT: SCOTLAND EMPLOYEES IN EMPLOYMENT (
Energy & Water 1 72 [58] [59] [60] [61] [61] [63] 59 [61] 59 [61] 60 [60] 59 [60] 59 58 58 58 58 57 56 53 52 50 50 Metal Man. & chemicals 2 82 [47] [48] [49] [49] [47] [47] 43 [44] 41 [43] 39 [42] 38 [42] 38 41 40 39 37 36 36 35 36 35 36 Metal goods, Eng. & vehicles 3 258 [166] [168] [169] [168] [170] [172] (167) [169] (164) [165](158) [161] (153) [161](153) (153) 163 (153) 160 (147) 154 (143) 155 (147) 153 150 154 151 152 148 Other Man. 4 265 [202] [207] [206] [203] [207] [212] (195) [189] (197) [181] (193) [180] (194) [180] (194) (184) 173 (183) 172 (185) 174 (182) 176 (165) 171 176 175 175 172 166 Const. 5 155 [125] [124] [122] [121] [120] [120] (130) [129] (127) [123] (121) [120](117) [116] (114) (109) 125 (105) 121 (103) 119 (101) 118 (115) 113 111 108 106 103 102 Distribution Hotels & Catering: repairs 6 [391] [385] [387] [384] [374] [387] [392] (416) [412] (417) [404] (410) [408] (415) [408] (415) (418)416 (411)409 (419) 416 (416) 414 (417)418 403 413 421 415 406
See notes to Table 1
1990 Jan Feb Mar Apr May Jun Jul Aug Sep Oct Nov Dec 1991 Jan Feb Mar Apr May Jun Jul Aug Sep Oct Nov Dec 1992 Jan Feb Mar Apr May Jun Jul Aug Sep Oct Nov Dec 1993 Jan Feb Mar Apr May Jun Jul Aug Sep Oct Nov Dec 1994 Jan Feb Mar Apr May Jun Jul
TABLE 3 UNFILLED VACANCIES AT JOBCENTRES
-Number 22.8 22.3 22.3 23.0 22.7 22.4 22.2 22.4 22.4 21.8 18.7 16.6 19.1 22.6 23.9 19.3 17.7 17.2 16.2 15.6 15.9 17.0 17.4 17.5 17.8 18.6 18.5 19.5 19.7 19.2 18.8 18.7 18.3 18.7 19.9 19.8 19.5 19.5 19.5 18.1 17.9 17.5 18.1 18.5 18.3 18.0 18.8 18.9 19.2 18.4 18.3 18.3 19.3 20.0 20.3 Seasonally adjusted Change since previous month -0.3 -0.5 0.0 0.7 -0.3 -0.3 -0.2 0.2 0.0 -0.2 -3.1 -2.0 2.5 3.6 1.3 -4.6 -1.6 -0.5 -1.1 -0.6 0.3 0.5 0.4 0.1 0.3 0.8 -0.1 1.0 0.2 -0.5 -0.7 -0.1 -0.4 0.4 1.2 -0.1 -0.3 0.0 0.0 -1.3 -0.2 -0.4 0.6 0.4 -0.2 -0.3 0.8 0.1 0.3 -0.8 -0.1 0.0 1.0 0.7 0.3 Aver.change over 3 months ending
-0.1 -0.7 -0.3 0.1 0.1 0.0 -0.3 0.1 0.0 -0.2 -1.3 -1.8 -0.9 1.3 2.4 0.1 -1.6 -2.1 -1.1 -0.7 -0.5 0.2 0.5 0.3 0.3 0.4 0.6 0.6 0.4 0.2 -0.2 -0.4 -0.4 0.0 0.4 0.5 0.3 -0.1 -0.1 -0.4 -0.5 -0.6 0.0 0.2 0.3 0.0 0.1 0.2 0.4 -0.1 -0.2 -0.3 0.3 0.6 0.7 SCOTLAND COOOs)
Vacancies at Careers Offices
Sour
c
2
3
1
rtment
o •-*
Lim
p
o
me
n
Ju
l
to
t o
b\
6
~
tO NJ
©
© io
^
•p
^ j
— 1 • 1-^
VO ^O _ ^O
f 2 > 2 " ' i v£ O Z oM> ,- ^ 2 > 2-^ , v^ O Z o </ ,>,^ ^ 2 > 2 ' " n ; S O Z o i z l> ' - : = ' 2 > 2
5 ? -a » £ -^ ra o JrfJ e c = f f l » » u « o ? n c c c f . J J n « t i o f T " c c c £• T> »
Bi 03 K 3 3 3
t O t J N M M W W N N W W U t J N U t J W W t O t O M W t O W W W M t O U t O I O f - t g t O - t O t O t J W U * » W W - W U U f r W W « K ) W - ^ W p W N ^ - ^ O p W ^ ^ - p p - \ O W O * p O W W ^ i-~ '— vovo'tjv'— L ^ i ^ b o o j ^ j — p Ln L/i c> vo ~ ^ b v l / i b \ ^ j - * i - ! ^ ^ ^ j w w t o \ o b b > u > b ' - * - w ^ o
o o o o o o o — o o p p o p p o p p p p p p p p p p p p p p p p p p ^ - p p p p p b o t o - w ^ - ^ b w ^ " W t o t o u - - w u f j ) ^ i o w t M ' ^ ^ U M \ o i o b ^ t o b b o ^ b » - k )
W t O W t J W S ) W U N M W M W U W K ) t O W M W W W N t O W W M M - t O U - M t O W W W W W I O U W K ) W U U W U W W » - W W M W - j O W O p » p p | 0 - - i > - i ' O p p « - p p p p » J « p w o o ^ ^ w b o ^ o w k i ^ w ^ A ^ ^ b o b ^ w b ^ b v ^ w w ^ ^ o b N - J ^ ' ^ b ^ w b b o b o
• i i i i i i i i
o p p p p p p p p p p p p p p p p p p p p p p p p p p p p p p p p p M ^ p t O H - ' p j i W W t O — t o k ) ^ ^ b ^ W ^ k j ^ t O ^ ^ ^ ^ W W ^ K ) W L A t O ^ ^ W t O W w b b ^ t O ^ C » W
O O O ^ o o ^ p ^ ^ p o o o o o x p o o o a i o o o o ( 3 > p i ^ j p v ^ p o ^ ^ x p \ ^ ^ y i p o a o ^ p v ^ - - - * v j { 3 o w - t ^ b w A w b b b w w L f t w b « ^ ^ ^ ^ b v ^ w b o N i u w ^ w ^ b b o ^ ^ ^ ^ a ' ^
I I I I I I i i i I I I I I i
M
VO Tl O
n —
3
S ) t o t o —
L/> \o
P P to i—
— to
00 P
^ Ln
to p
* . bo
Ln o*
to b\
De
c
t o
i — •
U-p
U )
to
bo
p
U i
-o
TABLE 5 Date 1990 Jan Feb Mar Apr May Jun Jul Aug Sep Oct Nov Dec 1991 Jan Feb Mar Apr May Jun Jul Aug Sep Oct Nov Dec 1992 Jan Feb Mar Apr May Jun Jul Aug Sep Oct Nov Dec 1993 Jan Feb Mar Apr May Jun Jul Aug Sep Oct Nov Dec 1994 Jan Feb Mar Apr May Jun Jul
: SCOTLAND - UNEMPLOYMENT - SEASONALLY ADJUSTED (excluding school leavers (000s) (Figures in Male 151.1 150.8 149.6 148.5 147.1 147.0 147.9 147.6 147.6 146.9 147.8 149.6 150.3 153.0 157.0 160.4 163.9 166.5 169.4 170.9 170.4 171.0 172.6 173.6 176.0 176.2 175.5 177.7 179.1 180.1 183.0 186.4 186.2 187.8 189.4 192.3 192.5 190.7 188.4 188.9 188.9 189.1 190.0 189.4 187.1 184.2 182.9 181.6 184.6 183.3 182.0 181.3 180.4 179.4 179.5
parentheses reflect estimates on September 1988 basis - see text for details)
Female 56.8 56.2 55.4 55.3 54.3 54.1 53.6 52.8 51.6 51.0 50.8 51.2 51.2 51.7 52.3 54.0 55.2 55.4 56.2 56.1 55.3 54.7 54.5 54.3 54.9 55.3 55.8 56.2 56.1 56.4 57.5 57.0 56.4 56.5 56.6 57.1 57.0 56.9 56.1 56.6 56.0 55.5 56.4 56.5 55.6 54.5 53.8 53.1 53.8 53.5 52.7 52.1 51.9 51.4 52.9 Total 207.9 207.0 205.0 203.8 201.3 201.1 201.5 200.4 199.2 197.9 198.6 200.8 201.5 204.7 209.3 214.4 219.8 221.9 225.6 227.0 225.7 225.7 227.1 227.9 230.9 231.5 231.3 233.9 235.2 236.5 240.5 243.4 242.6 244.3 246.0 249.4 249.5 247.6 244.5 245.5 244.9 244.6 246.4 245.9 242.7 238.7 236.7 234.7 238.4 236.8 234.7 233.4 232.3 230.8 232.4 Change since previous month -3.3 -0.9 -2.0 -1.2 -2.4 -0.3 0.4 -1.1 -1.2 -1.3 0.7 2.2 0.7 3.2 4.6 4.8 4.7 2.8 3.7 1.4 -1.3 0.0 1.2 1.4 3.0 0.6 -0.2 2.6 1.3 1.3 4.6 2.9 -0.8 1.7 1.7 3.4 0.1 -1.9 -3.1 1.0 -0.6 -0.3 1.8 -0.5 -3.2 -4.0 -2.0 -2.0 3.7 -1.6 -2.1 -1.3 -1.1 -1.5 1.6
Ave. change over 6 months ending
-3.8 -3.6 -3.1 -2.6 -2.2 -1.7 -1.1 -1.1 -1.0 -1.0 -0.5 -0.1 0.0 0.7 1.7 2.6 3.3 3.3 3.8 3.5 2.7 1.9 1.3 0.9 0.9 0.9 0.9 1.4 1.4 1.4 1.5 1.9 1.9 1.8 1.9 2.3 1.5 0.7 0.3 0.1 -0.2 -0.8 -0.3 -0.3 -0.3 -1.1 -1.4 -1.7 -1.3 -1.5 -1.3 -0.9 -0.7 -0.7 -1.0
Unemp. rate % of working pop. 8.3 8.2 8.2 8.1 8.0 8.0 8.0 8.0 7.9 7.9 7.9 8.0 8.1 8.2 8.4 8.5 8.7 8.8 8 9 9.0 9.0 9.0 9 0 9.0 9.2 9.2 9.2 9.3 9.3 9.4 9.5 9.6 9.6 9.6 9.7 9.8 9.8 9.8 9.6 9.8 9.8 9.8 9.9 9.8 9.7 9.6 9.5 9.4 9.5 9.5 9.4 9.3 9.3 9.2 9.3
TABLE 6: UNEMPLOYMENT FLOWS - STANDARDISED, UNADJUSTED: SCOTLAND ('000s)
Month ending
1990 Jan Feb Mar Apr May
Jun Jul Aug Sep Oct Nov Dec 1991 Jan
Feb Mar Apr May Jun Jul Aug Sep Oct Nov Dec 1992 Jan
Feb Mar Apr May Jun
Jul Aug Sep Oct Nov Dec 1993 Jan
Feb Mar Apr May Jun Jul Aug Sep Oct Nov Dec 1994 Jan
Feb Mar Apr May
Jun Jul
In-flow
29.7 31.9 29.5 29.7 25.8 29.1 38.5 29.9 32.5 33.0 34.1 31.6 31.3 34.0 32.9 33.8 30.9 31.0 44.4 32.8 33.9 34.6 34.8 32.5 34.2 33.7 31.8 33.5 30.4 32.9 48.9 35.4 37.1 38.7 38.2 34.0 36.4 34.1 31.3 34.9 30.8 31.9 49.2 34.4 35.1 35.5 35.6 32.8 35.1 32.6 29.1 32.1 29.2 29.1 45.7
Out-flow
22.9 35.7 35.5 33.3 35.9 31.5 30.2 30.5 37.6 35.3 31.1 25.3 20.8 32.9 31.6 31.8 32.7 30.9 30.5 30.9 41.0 36.3 32.1 26.9 20.6 35.1 34.2 33.1 34.6 34.4 33.3 32.9 46.0 39.8 35.6 26.3 26.7 38.1 38.2 35.6 36.4 35.1 34.6 34.6 48.9 41.7 35.4 30.3 22.6 37.5 36.0 34.3 36.2 34.3 32.8