Int. J. Electrochem. Sci., 12 (2017) 5636 – 5645, doi: 10.20964/2017.06.32
International Journal of
ELECTROCHEMICAL
SCIENCE
www.electrochemsci.org
Effects of Lithium Content on Structure and Electrochemical
Properties of Li-rich Cathode Material Li
1.2+xMn
0.54Ni
0.13Co
0.13O
2Xin Wei, Shichao Zhang*, Puheng Yang, Honglei Li, Shengbin Wang, Yanbiao Ren, Yalan Xing, Juan Meng
School of Materials Science and Engineering, Beihang University, Beijing 100191, PR China
*
E-mail: [email protected]
Received: 11 March 2017 / Accepted: 9 April 2017 / Published: 12 May 2017
Lithium content is one of crucial factors for the electrochemical properties of Li-rich cathode materials. The effects on crystalline structure and electrochemical properties are thoroughly investigated by Rietveld refinement, characterization and electrochemical tests. With the increasing of Li content, cation disorder is alleviated and the redox reaction of Mn4+/Mn3+ gets obvious. The sample with 10% extra-lithium exhibits highest discharge capacity, best cyclic stability and smallest charge transfer resistance.
Keywords: Gel-combustion method; Li-rich cathode material; Lithium content; Rietveld refinement; electrochemical performance.
1. INTRODUCTION
Considering energy source and environment, lithium-ion batteries (LIBs) with high energy and power density have attracted great research interest for application in plug-in hybrid electric vehicles (PHEV), electric vehicles (EV) and other large-scale energy storage equipment in recent years [1]. Exploring high-performance cathode material is one of the crucial issues to improve the energy and power density of LIBs. In recent years, Li-rich cathode materials xLi2MnO3·(1-x)LiNi1/3Co1/3Mn1/3O2
Except for surface modification and element doping, optimizing the composition is also an available approach to improve the performance by constructing perfect crystalline structure and reducing transition metal migration with cycling [5]. For Li-rich cathode materials, high capacity is associated with the extraction of Li ions from Li2MnO3 and the concomitant release of oxygen atoms
when charging above 4.5 V [6]. The lithium content is one of significant factors for the electrochemical properties of such materials. Extra lithium should be added in most synthesis methods to compensate lithium loss during high-temperature heating process. Some works were reported the effect of lithium content on structure and electrochemical properties, which is synthesized by various methods, such as co-precipitation [5, 7, 8], spray pyrolysis process [9], conventional solid-state reaction [10].
Gel-combustion method is prone to obtain the materials with homogenous element distribution [11], which is crucial to improve the performance of the Li-rich cathode material with multiple transition metals. In this work, Li-rich cathode materials Li1.2+xMn0.54Ni0.13Co0.13O2 have been
synthesized by gel-combustion method with different lithium content. The effects of Li content on crystalline, hexagonal ordering, ion arrangement, element valence and electrochemical properties are thoroughly characterized and discussed.
2. EXPERIMENTAL
Li-rich cathode materials Li1.2Mn0.54Ni0.13Co0.13O2 were synthesized by a typical
gel-combustion method followed by calcination. The stoichiometric amount of Co(NO3)2·6H2O,
Ni(NO3)2·6H2O, Mn(NO3)2·4H2O (50% water solution) were dissolved in 100 mL distilled water, and
citric acid and the sucrose were added to the solution as chelating agent and incendiary agent. The gel obtained after slow evaporation of the solution was heated up to burn concomitant with a flame and finally formed brown ash. After added LiNO3 with the extra amount of 5%, 10% and 15%
respectively, the mixtures were presintered and calcined at 900 °C 12 h. The final products were obtained after washed by ethanol in order to confirm that the exceed lithium is incorporated in the crystalline of the material, and noted as GC5, GC10 and GC15 respectively.
The structures of the materials were characterized by X-ray diffraction (XRD, Rigaku D/Max-2400, Japan) with the scan rate of 1°/min. The XRD profiles were fitted through Rietveld refinement to calculate cell parameters and atomic occupation by using the Rietveld program (GSAS). Chemical stoichiometry was confirmed by Inductively coupled plasma (ICP, PROFILESPEC, Leeman). The morphology, size and distribution were observed by Field-emission scanning electron microscopy (SEM, Hitachi S-4800, Japan) and Transmission electron microscopy (TEM, JEOL 2010 F). Raman tests were carried out by using LabRam HR 800. The chemical valence was determined by X-ray photoelectron spectroscopy (XPS, ESCALAB250).
foil was used as negative and counter electrode. The electrolyte was formed by 1 M LiPF6 dissolved in
a mixture of ethylene carbonate (EC), diethyl carbonate (DEC) and dimethyl carbonate (DMC) with the volume ratio of 1:1:1. Galvanostatic charge-discharge tests were carried out by Neware system with cut-off voltage of 2.0-4.8 V at 1 C (250 mAh g-1). The cyclic voltammograms (CV) tests were conducted by using an electrochemical station (CHI660a) in the voltage range of 2.0-4.8 V at a scan rate of 0.1 mV/s. The electrochemical impedance spectra (EIS) measurements were engaged by using an electrochemical station (CHI660a) with amplitude of 5 mV and the frequencies from 100 kHz to 10 mHz. All measurements were carried out at room temperature.
3. RESULTS AND DISCUSSION
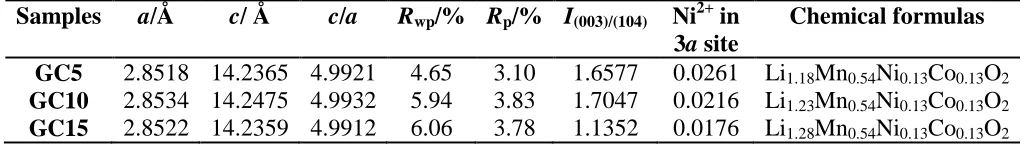
The Rietveld refinement results of the as-prepared Li-rich cathode materials GC5, GC10 and GC15 are shown in Figure 1 and the data are listed in Table 1. In Figure 1, the “Calc” refers to the refinement results obtained by GSAS and “Diff” refers to the difference between experimental and refined data. All the diffraction peaks could be indexed well by a hexagonal α-NaFeO2 structure with
the R-3m space group, except for several weak peaks in the 2θ range of 20-25°. Those weak peaks are associated with the monoclinic Li2MnO3 phase (C2/m) and (020)/(110) peaks are marked in the
figures, which is demonstrated the existence of Li-rich phase [12]. The distinct splitting of (006)/(012) and (018)/(110) peaks manifests the good structure of layered oxides [13]. As is known to all, the relative intensity ratio of I(003)/I(104) is an important factor to evaluate the ordering of oxide structure,
[image:3.596.42.554.667.740.2]and it is considered that a desired structure is formed when the value is greater than 1.2 [14]. According to Table 1, the ratios of GC5 and GC10 are much more than 1.2, indicating the well oxide structure. The value c/a is also an important factor to evaluate the structure of Li-rich oxides. It is believed that a well crystalline layered structure is formed when the c/a value is more than 4.9, and the larger the value is, the better channel for Li-ion transfer forms. It can be seen in Table 1 that the c/a values for all the samples more than 4.9 and the value of GC10 is the largest, indicating that all the samples exhibits good crystalline structure and the GC10 is the best of all. In addition, the results of Rietveld refinement also present the ion mixing, particularly between Ni2+ and Li+ due to their similar ion radii [15]. If the Ni2+ occupies the 3a site of Li+, the transfer of Li+ will be blocked during charge and discharge. As is shown in Table 1, the ion mixing between Ni2+ and Li+ is alleviated with the increasing of Li content.
Table 1. Results of Rietveld refinement for XRD patterns of GC5, GC10 and GC15.
Samples a/Å c/ Å c/a Rwp/% Rp/% I(003)/(104) Ni2+ in 3a site
Chemical formulas GC5 2.8518 14.2365 4.9921 4.65 3.10 1.6577 0.0261 Li1.18Mn0.54Ni0.13Co0.13O2
GC10 2.8534 14.2475 4.9932 5.94 3.83 1.7047 0.0216 Li1.23Mn0.54Ni0.13Co0.13O2
Figure 1. Rietveld refinement results for XRD patterns of GC5 (a), GC10 (b) and GC15 (c).
[image:4.596.172.417.69.650.2][image:5.596.132.462.115.437.2]
[16]. In addition, chemical formulas of GC5, GC10 and GC15 ascertained by ICP are also listed in Table 1.
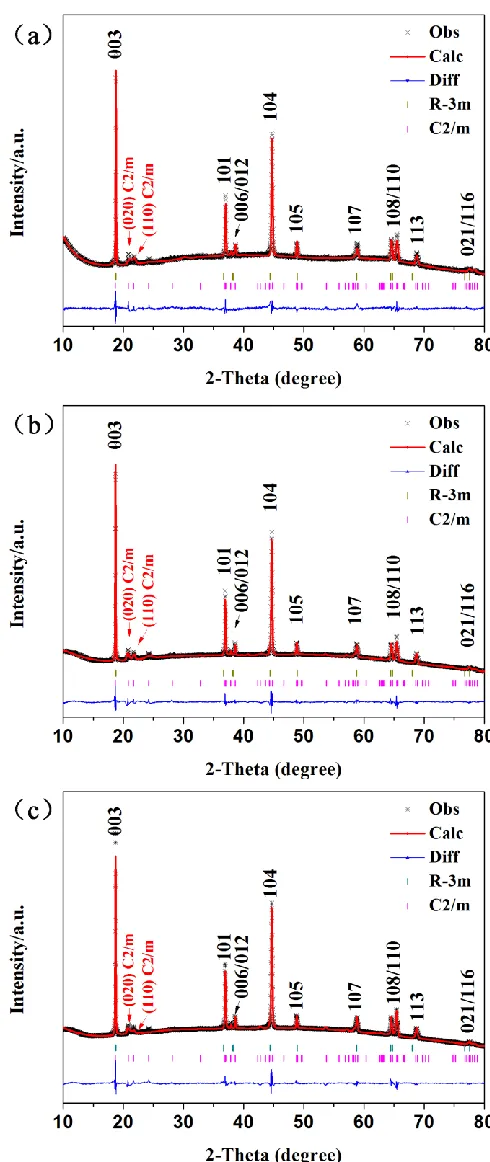
Figure 2. SEM and TEM images of GC5 (a, d), GC10 (b, e) and GC15 (c, f).
The XPS spectra of Co 2p, Ni 2p and Mn 2p of samples GC5, GC10, and GC15 are shown in Figure 2. For all the samples, four signals are detected for both Co 2p and Ni 2p spectra, consisting of two pairs of main peaks and corresponding satellite peaks. The positions of Co 2p1/2 and Co 2p3/2 are
around 795.3 and 780.2 eV, respectively. The values of the difference between the binding energies of Co 2p1/2 and Co 2p3/2 is ∆ = 15.1 eV for all the samples, indicating that Co ions for all the samples are
in an oxidation state of +3. The peaks for Ni 2p1/2 and Ni 2p3/2 of all the samples are located at about
872.7 and 855.0 eV, and the values of ∆ are around 17.7 eV, indicating that the valences state of Ni ions are +2 [17]. The XPS spectra of Mn 2p for all the samples exhibit two peaks of Mn 2p1/2 and Mn
2p3/2. According to the data fitting results, each peak for the Mn 2p1/2 and Mn 2p3/2 respectively
consists of two fitting peaks, the peaks about 654.3 and 653.3 eV for Mn 2p1/2, and the peaks are
around 643.0 and 641.9 eV for Mn 2p3/2. It is indicated that a small amount of Mn3+ exists besides
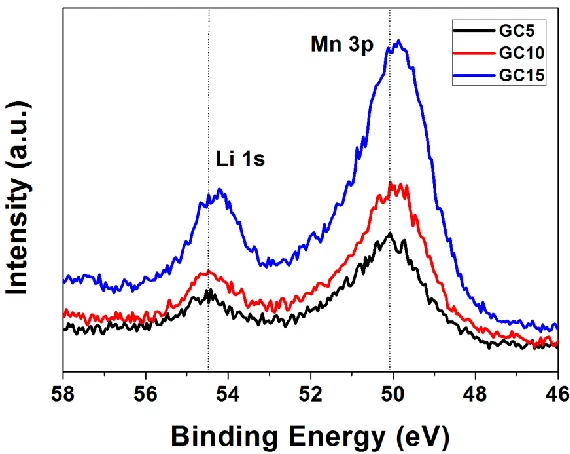
Mn4+ [18]. Furthermore, the XPS spectra of Li 1s and Mn 3p for samples GC5, GC10 and GC15 are exhibited in Figure 4. It is reported that the binding energy of Li 1s for spinel-LiMn2O4 is 53.6 eV,
lower than that for layered LiNiO2 (54.3 eV) [19]. It can be seen in Figure 4 that the peaks of both Li
increase of Li content. Therefore, based on the above analysis of XPS results, it is suggested that Mn3+ exists on the surface of all the samples and the amount increases with the ascent of Li content.
Figure 3. XPS spectra of Co 2p, Ni 2p and Mn 2p for the Li-rich cathode materials GC5, GC10 and GC15.
[image:6.596.86.507.95.451.2] [image:6.596.154.439.511.738.2]
Figure 5. Raman spectra of GC5, GC10 and GC15.
[image:7.596.133.464.338.714.2]
Figure 5 displays the Raman spectra of GC5, GC10 and GC15. Three major peaks in the Raman spectrum were observed at ca. 604, 487 and 430 cm-1 for each as-prepared materials, consistent with the value given for a hexagonal (R-3m) and a monoclinic (C2/m) crystals [8, 20]. Two relative sharp Raman peaks near 607 cm-1 and 498 cm-1 are ascribed to layered lithium transition metal oxide with R-3m symmetry. An additional small Raman band at around 415-430 cm-1 originated from the Li2MnO3 short-range superlattice ordering. A weak peak about 560 cm-1 was attributed to the
formation of spinel phase [21]. However, it cannot be observed evident diffraction peaks of spinel phase in the XRD patterns as illustrated in Figure 1. Combined with the results of XPS, it is indicated that there is a small amount of spinel nanodomains for each sample.
Figure 6a-c displays the cyclic voltammetry (CV) curves of Li-rich cathode materials GC5 (a), GC10 (b) and GC15 (c) to investigate the redox reactions during the charge-discharge processes. For sample GC5 (Figure 6a), there are two high anodic peaks and one cathodic peak in the initial cycle. The first anodic peak around 4.0 V is associated with the oxidation of Ni2+/Ni4+ and partial Co3+/Co4+ [22]. The second anodic peak at about 4.6 V is mainly associated with the electrochemical activation of Li2MnO3, corresponding to the extraction of Li+ and the concomitant release of oxygen atoms. This
anodic peak disappears in the subsequent positive scanning, implying the irreversible electrochemical activation process. The cathodic peak at approximately 3.75 V is ascribed to the reduction of Co4+/Co3+ and Ni4+/Ni2+ [22]. The redox peaks at around 3.3 V become obvious with the increasing lithium content, which is associated with the redox reaction of Mn4+/Mn3+ [23].
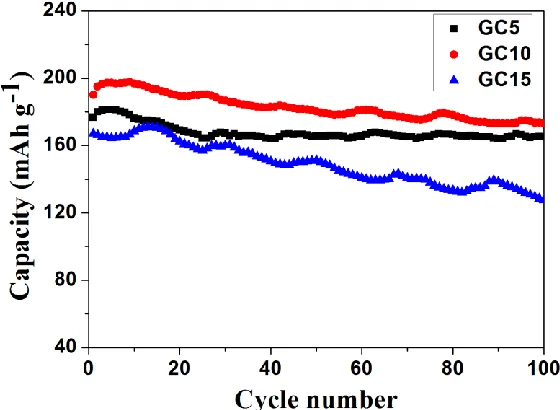
Figure 7. Cyclic stability of the Li-rich cathode materials GC5, GC10 and GC15.
[image:8.596.159.439.423.628.2][image:9.596.145.454.207.431.2]
initial charge and discharge capacities for samples GC5, GC10 and GC15 are 240.5/176.7 mAh g-1, 254.0/190.1 mAh g-1, 233.3/167.1 mAh g-1 with the coulombic efficiencies of 73.4%, 74.8% and 71.6%, respectively. Cyclic stability curves of samples GC5, GC10 and GC15 for 100 cycles are depicted in Figure 7. Samples GC5, GC10 and GC15 deliver the discharge capacities of 176.7, 190.1 and 167.1 mAh g-1 in the first cycle and maintain 165, 173, and 127.6 mAh g-1 in 100th cycle. According to above mentioned, GC10 displays the highest initial capacity, the best initial coulombic efficiency and cycle performance.
Figure 8. EIS spectra of the Li-rich cathode materials GC5, GC10 and GC15.
Electrochemical impedance spectroscopy (EIS) measurements of sample GC5, GC10 and GC15 were carried out after fully initial charged to 4.8 V. Nyquist plots and relevant equivalent circuit are shown in Figure 8. In the equivalent circuit, Rs represents the resistance of the transportation of Li+
through the interfacial film, Rct refers to the charge transfer resistance, CPE means the constant
phase-angle element relating to the nonideal characteristic of the double layer, Zw indicates the Warburg
impedance associated with Li+ diffusion in the bulk material. As shown in Figure 8, Nyquist plots include a semicircle at high frequency and a slope line at low frequency. The diameter of the semicircle refers to the value of charge transfer resistance (Rct) [18]. The Rct value of samples GC5,
GC10 and GC15 respectively are 445.3 Ω, 301.9 Ω and 671.9 Ω. The results show that sample GC10 exhibits the smallest charge transfer resistance, indicating the smallest electrode polarization and the most easily redox reaction.
4. CONCLUSION
properties. The appropriate extra lithium content is significant to optimize the performance of Li-rich cathode materials.
ACKNOWLEDGEMENTS
This work was supported by the National Basic Research Program of China (973 Program) (2013CB934001), National Natural Science Foundation of China (51274017), International S&T Cooperation Program of China (2012DFR60530), Shanghai Academy of Space Technology (SAST201467), the Innovation Foundation of Beihang University for Ph.D. graduates (No. YWF-14-YJSY-004).
References
1. H.B. He, L. Zan, Y.X. Zhang, J. Alloy Compd., 680 (2016) 95.
2. K.A. Jarvis, Z. Deng, L.F. Allard, A. Manthiram, P.J. Ferreira, Chem. Mater., 23 (2011) (16) 3614. 3. Z.H. Lu, Z.H. Chen, J.R. Dahn, Chem. Mater., 15 (2003) (16) 3214.
4. T. Ohzuku, M. Nagayama, K. Tsuji, K. Ariyoshi, J. Mater. Chem., 21 (2011) (27) 10179. 5. B. Choi, J. Song, D. Yeon, J.H. Kim, S. Park, H.E. Kim, J.H. Park, S. Doo, K. Park, Solid State
Ionics, 293 (2016) 77.
6. J.M. Zheng, X.B. Wu, Y. Yang, Electrochim. Acta., 56 (2011) (8) 3071.
7. S.H. Park, S.H. Kang, I. Belharouak, Y.K. Sun, K. Amine, J. Power Sources, 177 (2008) (1) 177. 8. J. Liu, Yang, J., Guo, S., Wang, Y., Wang, C., Liu, H., Xu, Q., Xia, Y., Surface technology, 44
(2015) (1) 15.
9. M. Lengyel, G. Atlas, D. Elhassid, X.F. Zhang, I. Belharouak, R.L. Axelbaum, J. Electrochem. Soc., 161 (2014) (6) A1023.
10. Z.H. Tang, Z.X. Wang, X.H. Li, W.J. Peng, J. Power Sources, 208 (2012) 237.
11. H.L. Li, S.C. Zhang, X. Wei, P.H. Yang, Z.X. Jian, J. Meng, Rsc Advances, 6 (2016) (82) 79050. 12. D. Luo, S.H. Fang, L. Yang, S. Hirano, J. Mater. Chem. A, 4 (2016) (14) 5184.
13. Z.Y. Wang, S.H. Luo, J. Ren, D. Wang, X.W. Qi, Appl. Surf. Sci., 370 (2016) 437. 14. R.R. Zhao, Z.J. Chen, Y. Zhang, P. Du, H.Y. Chen, Mater. Lett., 136 (2014) 160.
15. S.J. Shi, T. Wang, M. Cao, J.W. Wang, M.X. Zhao, G. Yang, Acs Appl. Mater. Interfaces, 8 (2016) (18) 11476.
16. M.M. Thackeray, S.H. Kang, C.S. Johnson, J.T. Vaughey, R. Benedek, S.A. Hackney, J. Mater. Chem., 17 (2007) (30) 3112.
17. X. Zhang, D. Luo, G. Li, J. Zheng, C. Yu, X. Guan, C. Fu, X. Huang, L. Li, J. Mater. Chem. A, 1 (2013) (34) 9721.
18. J. Meng, S.C. Zhang, X. Wei, P.H. Yang, S.B. Wang, J. Wang, H.L. Li, Y.L. Xing, G.R. Liu, Rsc Advances, 5 (2015) (99) 81565.
19. B. Song, M.O. Lai, Z. Liu, H. Liu, L. Lu, J. Mater. Chem. A, 1 (2013) (34) 9954.
20. E. Proietti, F. Jaouen, M. Lefevre, N. Larouche, J. Tian, J. Herranz, J.P. Dodelet, Nat. Commun., 2 (2011).
21. J. Hong, D.-H. Seo, S.-W. Kim, H. Gwon, S.-T. Oh, K. Kang, J. Mater. Chem., 20 (2010) (45) 10179.
22. P. Manikandan, P. Periasamy, R. Jagannathan, Rsc Advances, 4 (2014) (76) 40359. 23. J.R. Croy, D. Kim, M. Balasubramanian, K. Gallagher, S.H. Kang, M.M. Thackeray, J.
Electrochem. Soc., 159 (2012) (6) A781.