Developing LCA-based benchmarks for sustainable consumption – for and with users
Nissinen, A.1, Heiskanen, E.2, Grönroos, J.1, Honkanen, A.3, Katajajuuri, J.-M.4, Kurppa, S.4, Mäkinen, T.3, Seppälä, J.1, Timonen, P.2, Usva, K.4, Virtanen, Y.4, Voutilainen, P.4.
1) Finnish Environment Institute, P.O.Box 140, 00251 Helsinki, Finland 2) National Consumer Research Centre, P.O.Box 5, 00531 Helsinki, Finland
3) Finnish Game and Fisheries Research Institute, P.O.Box 6, 00721 Helsinki, Finland 4) MTT Agrifood Research Finland, 31600 Jokioinen, Finland
Corresponding author: Eva Heiskanen
National Consumer Research Centre
P.O. Box 5
FIN- 00531 Helsinki
Developing LCA-based benchmarks for sustainable consumption – for and with users
Nissinen, A.1, Heiskanen, E.2, Grönroos, J.1, Honkanen, A.3, Katajajuuri, J.-M.4, Kurppa, S.4, Mäkinen, T.3, Seppälä, J.1, Timonen, P.2, Usva, K.4, Virtanen, Y.4, Voutilainen, P.4.
1) Finnish Environment Institute, P.O.Box 140, 00251 Helsinki, Finland 2) National Consumer Research Centre, P.O.Box 5, 00531 Helsinki, Finland
3) Finnish Game and Fisheries Research Institute, P.O.Box 6, 00721 Helsinki, Finland 4) MTT Agrifood Research Finland, 31600 Jokioinen, Finland
Abstract
This article presents the development process of a consumer-oriented, illustrative
benchmarking tool enabling consumers to use the results of environmental life cycle
assessment (LCA) to make informed decisions. Active and environmentally conscious
consumers and environmental communicators were identified as key target groups for this
type of information. A brochure presenting the benchmarking tool was developed as an
participatory, iterative process involving consumer focus groups, stakeholder workshops and
questionnaire-based feedback. In addition to learning what works and what does not, detailed
suggestions on improved wording and figures were obtained, as well as a wealth of ideas for
future applications.
Keywords
LCA, communication, sustainable consumption, user participation
1. Introduction
Life cycle assessment (LCA) is a systematic method for assessing the environmental impacts
of a product from cradle to grave, i.e., from the extraction of raw materials from nature to the
final deposition of waste substances to nature [1]. Besides being the most comprehensive
available analytical method for assessing products, endorsed by e.g. the World Summit [2]
and the EU Commission [3], it also has the potential to reshape relations in the supply chain.
Small choices made by customers can have far-reaching impacts throughout the product life
cycle. For example, selecting an energy-efficient appliance influences carbon dioxide
emissions for years to come. By placing pressure on suppliers, customers can indirectly
China [4]. LCA thus has the potential to reveal the “world behind the product” [5] and
empower consumers to make more responsible decisions.
There are also sound arguments for not saddling consumers with too much responsibility for
the environmental impacts of products, such as information asymmetry [6] and the limited
impact of individual decisions [7,8]. Collective solutions are needed to protect the
environmental commons. Yet – while waiting for better forms of global environmental
governance to emerge – there are many choices in which consumers can make a difference
and catalyze positive developments [9]. Unfortunately, many suggestions for greener
consumption swiftly become controversial. As the amount of advice provided proliferates, it
is also difficult for consumers to distinguish which decisions are really important.
Environmental LCA holds the potential to help environmentally-conscious consumers to sort
out the available advice and find suitable and relevant environmental improvement options for
their own lives. With time, it may also help consumers to assume a more powerful role in
influencing global supply chains. More and more LCA results are becoming available, but the
reports are extremely technical, featuring long lists of environmental pollutants and unfamiliar
terms. They are not directed at lay people who need to get a quick overview and make
decisions on a day-to-day basis. There have been some efforts to develop illustrative
presentation formats in the LCA community. It is common to benchmark the various effects
against the total effects in an area or country; e.g., in the Eco-indicator method the
environmental effects are normalized by the effects caused by the average European during a
year [10]. The normalized results can also be weighted according to the assumed seriousness
of each effect: in Eco-indicator, these weights are determined by a panel method. After
normalization and weighting, the resulting 'ecopoints' can be shown in illustrative forms, e.g.,
using the common column format. In addition, quite sophisticated presentation methods,
using e.g. spheroids and addressing both the values and uncertainty of the various impacts,
have also been used to increase the effectiveness of visualization [11].
Despite previous efforts there still is an obvious need to develop methods to interpret and
present LCA results to consumers. Surveys indicate that ordinary consumers’ environmental
literacy is relatively low: for example, the main causes and effects of climate change are not
well known [6,12]. In this situation, one starting point for developing usable information
“Anchoring” means that new concepts are adopted by constructing continuities to familiar
things from the past. Thus, we assume that LCA results would be easier to understand if they
were linked to a familiar frame of reference. Everyday consumer products and activities may
offer benchmarks which bring the frame of reference close to one’s own life. This paper
presents a Finnish effort to develop an illustrative benchmarking tool enabling consumers to
use LCA results and make informed decisions on everyday consumer issues.
The benchmarking tool was developed as an iterative process involving LCA experts from
several Finnish research institutes, as well as consumer researchers and consumers from the
National Consumer Research Centre’s Consumer Panel, and also feedback gained from other
stakeholders such as professional environmental communicators [15]. This paper describes
the development process applied in the project. We analyse how the “benchmark tool”
evolved during this iterative process, and how users and experts interacted to create the
current format of the benchmarks and to identify future development tasks.
2. Benchmark tool project: creating the benchmarks and developing the communication format
The aim of the project was (a) to develop benchmarks allowing consumers to make sense of
and utilize LCA-based information (b) to find suitable applications, presentation formats and
information channels for such benchmarks and (c) to develop an information brochure
launching the benchmark idea to consumers and other stakeholders. The project was
conducted as an iterative process involving a group of researchers with different backgrounds,
two rounds of feedback from ordinary consumers, as well as feedback seminars for
professional users such as environmental communicators (Figure 1). This section first
presents the arguments for user involvement and the specific type of user involvement process
applied. Next, the development of the first versions of the benchmarks is described in detail.
figure 1 here
2.1 The role of users and experts in the iterative development of the benchmarks
From the start, the project aimed to create an LCA-based tool for ordinary consumers – who
While lay people often lack knowledge on “scientific facts” about the environment, they have
their own local understandings and interpretation frames [16,17]. In order to integrate these
lay understandings into the communications development process, recent studies have
adopted a participatory approach to developing environmental communications [18, 19, 20,
21]. Interaction with information users has enabled the designers to identify the users’ beliefs,
knowledge and concerns, as well as their perceived information needs. It has also helped to
customize the language used to accommodate the users’ own concepts and images, and to
develop useful examples and analogies. When successful, such co-design approaches allow
communicators to combine research on target audiences’ perceptions with more specific input
into the communication design itself.
At the start of the process, the idea of creating “benchmarks” was fairly diffuse. It was
informed by research in, e.g., social representation theory [13, 14], which suggests that new
concepts are adopted through "anchoring", i.e., understanding new information by
constructing continuities to familiar things from the past. Thus, we assumed that LCA results
would be easier to understand if they were linked to a familiar everyday object. You could,
for example, state the environmental impact of a new product using a familiar product (such
as a loaf of bread or a 10-mile drive) as a reference: “the damage is equivalent to that of two
loaves of bread”. Yet it was not clear at this phase what products would be best as
benchmarks, what would be appropriate presentation formats, and where and how consumers
might like to receive this information. We thus opted for starting with a relatively open-ended
form of user involvement, which is described below.
2.2 Creating benchmarks for sustainable consumption: the first phase
In the first phase of the project, two different kinds of benchmark alternatives were first
developed. In addition, six different presentation types (both figures and verbal) were
developed, in which comparisons were demonstrated between the environmental impacts of a
product and the benchmarks. The benchmarks and presentation types were described in a
“draft brochure”, which aimed to both serve as the first stage of a brochure about this
methodology and to provide material for the evaluation by the consumer panel. This 20-page
information package also included an illustration of how the benchmarks could be applied to a
consumer decision, as well as provided a brief account of the LCA studies and other data
(both those involved and those not accounted for at this stage). Feedback on the first versions
of benchmarks and presentation formats was obtained from potential users of the information,
including both ordinary consumers and other stakeholders such as professionals providing
environmental advice and counselling. After this, the presentation formats were refined, and
more feedback was obtained on the revised presentation formats.
Alternative benchmarks
In order to develop a benchmark that could serve as a proxy measure of a person’s “total daily
impact”, we calculated the average daily per capita environmental impacts of the whole
Finnish economy. This benchmark was based on three factors, namely 1) the environmental
effects of the whole economy of Finland in a year, including industry, agriculture, silviculture
and communities (Table 1), 2) the population of Finland which was 5.206 million at the end
of 2002 [22] and 3) the number of days per year (365).
table 1 here
The second type of benchmark was based on a number of common products. We thought they
would serve as a useful comparison point and allow consumer to “anchor” the novel
information to a familiar context. Two conditions were set for these products: 1) there must be
an existing LCA of the product which is of good quality, and can be updated and modified (if
needed) to be relevant to the conditions of Finnish consumers, and 2) the product must be a
familiar everyday product for Finnish consumers. In order to screen suitable LCA-studies, a
survey was conducted of existing studies, using literature databases (e.g., Cambridge
Scientific Abstracts). Tens of LCA-studies were pre-evaluated, and more than ten studies
were thoroughly assessed. The assessments focused on the re-applicability of the study, so
that the results of the selected LCA studies could serve as reliable benchmarks. It was
important that the results should correspond to the environmental impacts of similar products
in current Finnish conditions, or that the study could be modified to provide relevant results
for Finnish consumers. Finally, five LCA-studies were selected for further development
(Table 2). Rye bread and cheese were the food products selected as benchmarks, largely due
to the importance of food in everyday consumption and data availability considerations. Both
environmental loads of commonly used products. Other benchmark products included were a
wash of laundry, a two-bedroom apartment and a car trip.
table 2 here
All of the selected LCA-studies required some modifications and updating (Table 2). A
typical modification was to use new data for the environmental effects of electricity and
district heating, representing the year 2003 and average values for whole Finland, also taking
into account imported electricity on the basis of country-specific values. The products are
described briefly below and in more detail in Nissinen et al.[15], and the new inventory
results are shown in Table 3.
Rye bread is a staple food in Finland. The benchmark was calculated for the average daily consumption of rye bread (83 g) among regular users of this food (80% of the population).
This amount corresponds to approximately two slices of bread. The benchmark for rye bread
is based on a Finnish LCA-study [23,24,25] of bread made of rye grown in Finland.
Cheese represents an animal-based product with a high nutritional energy content. The benchmark was calculated for the average daily consumption of cheese (30 g) among regular
cheese users (80% of the population). This amount corresponds to approximately four thin
slices of cheese. The LCA was made for Emmental cheese [26], which is popular in Finland.
The results pertain to conditions in 2000-2001, and represent one-third of the total production
of Emmental cheese in Finland.
Laundry was selected to represent an everyday, familiar activity at home. A two-person family was assumed to do one wash of laundry per day. Finnish families currently wash their
laundry almost on a daily basis: 25 washing machine cycles are run every month, on an
average. Of these washes, 55 % are cold (40°C) and 35 % warm (60°C), while the remaining
10 % are either hotter or colder. The LCA data are based on a European study [27], case
Sweden 1998. We updated the data pertaining to energy consumption at the use stage and to
waste water treatment to correspond to Finnish conditions [28], and based our calculations on
a washing temperature of 40°C. The washing machine performance data represent a relatively
A two-bedroom apartment was selected to represent housing, and the benchmark for housing is “one day of living in a warm apartment” per person. Many Finnish households
(44%) live in apartment houses (blocks of flats), and the average living space per person is 36
m2. Thus the benchmark apartment of 83 m2was selected as a fairly common housing type for 2 persons, with a living space per person of 41 m2. The apartment benchmark is based on an LCA of a three-floor prefabricated apartment building [29,30], with supplementary data
gained through personal communication from Koskela. The useful life of the building was
calculated as 100 years. The energy consumption of the building includes space heating using
district heating (combined heat and power production) and the electricity use of the facility
(i.e., electricity used in common spaces of the house). Thus, the housing benchmark does not
include electricity used at home for lighting, laundering, kitchen or other appliances.
A car trip represents mobility, and the benchmark corresponds driving 20 km alone. The average daily travel by car in the metropolitan area is 21 km (which is also close to the
national average 19 km), the average number of persons in the car being close to 1 (i.e. 1.2).
The data for fuel use and emissions in Finland of a typical car fulfilling EURO3 standards are
based on the Liisa database maintained by the VTT Technical Research Centre of Finland
(www.lipasto.fi). In addition, the environmental impacts of fuel production [31] were
included in the calculation. The data on car manufacturing and maintenance were calculated
on the basis of a relatively new LCA on the VW Golf A4 [32], with the most recent data
dating from summer 2000.
table 3 here
Life cycle impact assessment
In the study, the impact assessment methodology is based on the general phases of life cycle
impact assessment (LCIA): selection of impact categories, classification, characterization,
normalization and weighting [33]. The selected impact categories and contributing emissions
were:
1) climate change (CO2, N2O, CH4),
2) acidification (SO2, NOx, NH3)
3) tropospheric ozone formation (NOx, VOC/HC, CH4)
5) aquatic eutrophication (NOx, NH3, N(w), P(w)).
The other impact categories such as human toxicity, ecotoxicity, particulate matter and effects
of land use were not modeled or shown in the presentation formats at this stage of the project.
Characterisation factors for Finland were used for acidification [34], tropospheric ozone
formation [35] and aquatic eutrophication [36] (thus the impacts were calculated as if all the
emissions had occurred in Finland) (Table 4). For normalization (and at the same time for the
first benchmark), the reference values for each impact category were calculated on the basis
of the total Finnish emissions and energy use (Table 1). Finland-specific weighting factors
were available from an earlier study [37], following the principles presented by [38].
table 4 here
2.3 Presentation formats
Six different presentation formats were developed, as well as a background information
package explaining what LCA is and explaining the environmental impacts considered in the
benchmarks (climate change, acidification, eutrophication, tropospheric ozone formation and
primary energy use) as well as those not considered (e.g., impacts on biodiversity,
ecotoxicity). The presentation formats focused on different levels of aggregation of the data,
as well as on visual vs. verbal presentation [15]. The “draft brochure”, a 20-page information
package, also included an illustration of how the benchmarks could be applied to a consumer
decision (Figure 2), and provided a brief account of the studies and data sources referenced as
well as on the calculation rules. This “draft brochure” was used as the first version on which
feedback was solicited.
Figure 2 here
3. User feedback on the first versions
Active and environmentally conscious consumers and environmental communicators were
identified as key target groups for this type of information. We thus considered volunteer
appropriate user group to involve as user representatives. We solicited help from 300
members of this panel, and obtained 57 volunteers for the co-design process consisting of (1)
inspecting the information package, (2) participating in a focus group interview, and (3)
participating in a second questionnaire-based round of feedback on the improved brochure.
3.1 Gaining user feedback
As expected, those who volunteered to provide us feedback on the benchmarks were, on
average, somewhat more environmentally concerned than the general population, and they
were more attentive to environmental media communications. Most were middle-aged, many
with a professional education and an active interest in consumer issues. The participants could
also be identified as central sources of advice in their own social networks, cf. [40], who
would be the first to use and diffuse this kind of information. The first round of consumer
input was gained using focus group interviews [41]. Consumers were sent out the “draft
brochure” in advance, and invited to discuss the following issues at the focus group sessions:
(a) comments on the overall idea of using LCA-based benchmarks, (b) comments on
presentation formats and (c) ideas on useful applications and future prospects of the
benchmark tool. Altogether, 10 focus groups were conducted, resulting in a wide range of
viewpoints – but also some clear indications for further development.
The consumers, in general, welcomed the development of reliable and unbiased
environmental information. The “draft brochure” had provided them with a new perspective
on the environmental impacts of consumption: for example, many were surprised about the
significance of housing compared with, e.g., a car-trip, which was a more familiar cause of
environmental concern. They were apprehensive, however, that the information was too
complex for ordinary consumers to understand – and the single application demonstrated did
not fully convince the consumers about its usability in everyday life. The consumers also
doubted the potential of this type of information to alter consumer behavior on a large scale.
Many discussants argued that the information should be provided to policy makers, who could
then develop regulations or economic instruments to alter the behavior of companies
producing the products. Even though consumers were sceptical about the impact of the
information as an environmental policy measure, they did welcome it as consumer policy
The presentation format of the “draft brochure”, however, evoked a lot of criticism. The
research group’s idea of where and how the benchmarks would actually be applied was vague
– and this was evident in the draft brochure. “You’re just presenting a bunch of statistics – a
kind of ‘nice-to-know’ thing”, one consumer summarized. These discussions helped us
understand that we need to think more about the kind of questions that the benchmark can be
used to answer, and also need to explain the figures in more detail. Visual and verbal
presentation formats were given as alternatives in the “draft brochure”, but it was evident that
they need to be combined. The focus group feedback alerted the research group to the
consumers’ need for guidance and “spelling things out”– even informed consumers who like
to draw their own conclusions. We were encouraged to seek for a new balance between
“presenting data for consumer empowerment” and “providing advice”.
As to future applications, a number of different suggestions were obtained. Comparisons
between products within the same product group were the first application that came to mind,
but during the discussions, many problems in this kind of application were identified. LCA
information is too data-intensive for making quick comparisons in shops, and the figures
developed are not easy to print on packages. Some consumers also questioned whether LCA
can really discriminate between the environmental impacts of different brands of cheese, for
example. A more feasible application could be of the type demonstrated in Figure 2:
comparing alternative consumption patterns. Some participants felt that the information
provided in the “draft brochure” was more in the category of “general education” – which
would be useful for policy makers and product designers, as well. Finally, some consumers
greeted the benchmark tool as a step toward a personal environmental profile, and suggested
developing an Internet site allowing consumers to calculate their own environmental impact.
We also sought feedback from professional environmental communicators from the public
administration (e.g., waste prevention counselors), from business (e.g., environmental
managers) and from NGOS (e.g., counselors, campaigners) by organizing two seminars: the
first to introduce the project, and the second to obtain systematic feedback. This was done by
organizing groupwork sessions asking the participants to identify ways in which they could
use the benchmarks in their work and suggest future application that they might find useful.
We gained a wealth of input from the different consultations– some encouraging, some
discouraging, some clear-cut and some confusing. As opinions differed on many issues (not
the least, the alternative presentation formats), there was seldom a clear majority view to
follow. All suggestions could not be integrated in a single development project, but the
research group picked out some that suggested the following lines of development:
• Many potential users of the benchmarks preferred aggregated and weighted results, as they considered them most usable in actual decision situations. Yet some users were not
prepared to leave the weighting of environmental impacts to anonymous experts, so there
is reason to retain the unweighted data (i.e., separately for each environmental problem)
alongside the weighted results in public communications. Even with aggregated data,
many of the users considered the information too complex and undiscriminating to be
used as a “proxy ecolabel” on product packaging. Moreover, there are existing
eco-labeling schemes to serve this purpose.
• In contrast, many users considered the information might be extremely useful in comparing broader alternative behavioral patterns such as alternative forms of
transportation – or “make-or-buy” decisions such as home cooking vs. ready meals. One
of the most important strengths of the benchmarks was their quantitative nature, enabling
consumers to identify large and important decision, such as housing and space heating.
• Many alternative suggestions for presentation formats were received – ranging from color-coding to awarding points similar to those used by Weight Watchers. The most
useful suggestion, however, was obtained from a professional communicator at one of the
workshops. She suggested using a “ruler” as a scale on which different products could be
placed according to their environmental impacts.
• All the different benchmarks were considered useful, and users were not prepared to select a single product as a suitable “anchor” for understanding the environmental impacts of
other products. Thus, we were encouraged to develop a benchmark format combining the
weighted environmental impacts into a single meta-benchmark, and integrating this with
the “ruler” idea.
Inspired by the feedback gained, the basic benchmark was given the form of a ruler, which
aims to serve as a yardstick for the environmental impacts of different products, services or
activities (Figure 3). The backbone of the benchmark-ruler is based on the average daily per
capita environmental impacts of the whole Finnish economy. This ruler also integrates the
different benchmark products, which serve as additional – more down-to-earth – benchmarks.
In addition to the aggregated presentation, it can be worthwhile to show the values for each
environmental impact class. When using ordinary A4 paper, the first page could present the
aggregated results and the second page show the results for each impact class. This
combination of presentation types would cater to the needs of both those who prefer
aggregated data, and those who prefer to draw their own conclusions on the importance of
different environmental impacts.
We also reduced the brochure to eight pages, with more focus on questions and answers and
practical applications – including verbal explanations of the figures (Figure 3). The second
feedback round, conducted using questionnaires (N= 39), provided encouraging results. Even
though we were unable to accommodate all the (partly conflicting) suggestions into the new
version of the brochure, most respondents were pleased with the new benchmark format.
Almost all agreed that the overall appearance and language of the brochure had improved
significantly. Typical suggestions for further improvements included more examples and
more opportunities to personalize the information. The next foreseen task of the research
group will thus be the construction of an interactive website enabling consumers to use the
benchmark to make their own calculations (see Figure 1).
5. Evaluation: project evolution and the users’ role
The process of developing the benchmarks was highly iterative, and some original
assumptions and plans were revised during the course of the process. In the end, we decided
to use the environmental effects of the whole economy of Finland as the basis of the scale in
the benchmark. This 'economy-based approach' has often been used in the normalising of the
various environmental effects [42]. Feedback obtained in the user consultation processes,
however, helped to turn this normalization factor into a new presentation format and
The benchmark developed here has benefits that were welcomed by the consumers and other
stakeholders consulted. The ability to address multiple environmental impacts in a
quantitative form provides users with much-sought information on priorities and the relative
importance of various decisions. Thus, it may help to move discussions on sustainable
consumption away from marginal issues such as recycling discarded packaging or choosing
eco-product variants. The feedback obtained, however, identified many challenges in the
utilization of this information: who will use it, where, and how? One of the challenges is that
most individual decisions are fairly small on this kind of a scale. Thus, one of the future
directions for improving the benchmark is to develop it into an interactive website allowing
consumers to model, e.g., the combined effects of multiple environmental improvements of
their choice. We will also work toward obtaining more product benchmarks from different
product groups, and look forward to applications of the method in other countries, see [15].
One of the obvious benefits of involving consumers was that the research group obtained
feedback on the language and presentation format – what people understand and what they
don’t. What was specific to the interactive and iterative nature of the process, however, was
the possibility to get detailed suggestions on improved wording and figures – as well as a
wealth of ideas for future applications. The participants naturally represent a small vanguard
of future “lead users” of the LCA-based benchmark tool, and other efforts are needed to
provide straightforward environmental advice to the general population.
We were not able to integrate all the innovative suggestions and all the divergent viewpoints
into the final version of the benchmark brochure. This experience echoes those of Magnusson
[43]: the suggestions obtained from ordinary users are highly divergent and often not directly
implementable. They are an input and a source of inspiration for the development process,
and need further processing by the developers themselves. As such, however, both the users’
suggestions and the process through which they are obtained are an invaluable way for
designers to get closer to their users. In the present study, the interaction with users helped the
LCA experts to gradually focus more and more on the usability on the information, and
develop new conceptualizations and visualizations for communicating LCA to non-expert
References
[1] ISO (1997) . ISO 14040:1997 Environmental management - Life cycle assessment – Principles and Framework. International Organization for Standardization, Geneva.
[2] World Summit 2002. World Summit on sustainable development. Plan of implementations. http://www.un.org/esa/sustdev/index.html (visited 20.1.2005).
[3] EU Commission 2003. Communication from the Commission to the Council and the European Parliament – Integrated Product Policy. Brussels, COM (2003) 302.
[4] Heiskanen, E. (2002). The Institutional Logic of Life Cycle Thinking. Journal of Cleaner Production 10 (5): 427-437.
[5] de Leeuw, B: (2005). The World Behind the Product. Journal of Industrial Ecology 9 (1/2): 7-10. [6] Niva, M., Heiskanen, E. & Timonen, P. (1997). Consumers’ Environmental Sophistication – Knowledge, Motivation and Behaviour. European Advances in Consumer Research 3: 1-6.
[7] Uusitalo, L. (1990). Are environmental attitudes and behaviour inconsistent? Findings from a Finnish study. Scandinavian Political Studies 13: 211-226.
[8] Stagl, S. & Hubacek, K. (2002) A Framework for a Community-based Comparison of Consumption Patterns. pp. 241-245. Lifecycle Approaches to Sustainable Consumption. Workshop Proceedings 22 November 2002. Laxenburg: International Institute for Applied Systems Analysis. Interim Report IR 02-073.
[9] Brower, M., Leon, W., 1999, The Consumer's Guide to Effective Environmental Choices, New York: Three Rivers Press.
[10] Goedkoop, M. & Spriensma, R. 2001. The Eco-Indicator 99 – A damage oriented method for life cycle impact assessment. Methodology report. Third edition 22 June 2001. PRé Consultants B.V., Amersfoort, The Netherlands. www.pre.nl/download/ EI99_methodology_v3.pdf (visited 20.1.2005) [11] Otto, H.E., Mueller, K.G. and Kimura, F 2003. Efficient information visualization in LCA. International Journal of LCA 8 (4) 183-189.
[12] Dunlap, R.E. (1998). Lay Perceptions of Global Risk. Public Views of Global Warming in Cross-National Context. International Sociology 13 (4): 473-498.
[13] Joffe, H. (2003). Risk: From perception to social representation. British Journal of Social Psychology 42 (1).
[14] Wagner, W., Kronenberg, N. & Seifert, F. (2002). Collective symbolic coping with new technology: Knowledge, images and public discourse. British Journal of Social Psychology 41 (3). [15] Nissinen, A., Grönroos, J., Heiskanen, E., Honkanen, A., Katajajuuri, J.-M., Kettunen, J., Kurppa, S., Mäkinen, T., Seppälä, J., Silvenius, F., Timonen, P., Virtanen, Y., Voutilainen, P. (2005). Development of benchmarking for the environmental impacts of different products, services and consumption patterns. p. 98-114. In: Sustainable Consumption: The Contribution of Research, Workshop 10-12 February 2005, Oslo, Norwegian University for Science and Technology (NTNU), Report 1/2005, Trondheim, Norway.
[16] Wynne, B. (1996). Misunderstood misunderstandings: social identities and public uptake of science. (pp. 19-46) In: Irwin, A. & Wynne, B. (1996). Misunderstanding science? The public reconstruction of sceince and technology. Cambridge: Cambridge University Press:
[17] Hobson, K. (2003). Thinking Habits into Action: the role of knowledge and process in questioning household consumption practices. Local Environment 8 (1). 95-112.
[19] Eisenhauer, B.W. & Nicholson, B. (2005). Using Stakeholders' Views: A Social Science Methodology for the Inclusive Design of Environmental Communications. Applied Environmental Education and Communication 4 (1): 19-30.
[20] Latowsky, G. (2003). Report: Community-based, Participatory Research in Lawrence, Massachusetts, Flags Environmental Health Hazards and Fuels Education and Action. Science Communication 25: 204-208.
[21] Leonard, K. J. (2004). The Role of Patients in Designing Health Information Systems: The Case of Applying Simulation Techniques to Design an Electronic Patient Record (EPR) Interface. Health Care Management Science 7 (4): 275-284.
[22] Statistics Finland 2004. www.stat.fi, visited 22.12.2004.
[23] Grönroos, J. & Seppälä, J. (Eds.) 2000. Maatalouden tuotantotavat ja ympäristö (Agricultural production systems and the environment, in Finnish with executive summary in English). Finnish Environment 431. Finnish Environment Institute, Helsinki. 244 p.
[24] Grönroos, J. & Voutilainen, P. 2001. Maatalouden tuotantotavat ja ympäristö. Inventaarioanalyysin tulokset (Agricultural production systems and the environment. Results of inventory analysis, in Finnish). Mimeograph series of the Finnish Environment Institute 231. Helsinki. 64 p. Also available on the Internet:
[25] Grönroos, J., Seppälä, J., Seuri, P. & Voutilainen, P. 2001. Agricultural production systems and the environment. In: Proceedings of the International Conference on LCA in Foods (Gothenburg, Sweden 26-27 April 2001). SIK-Dokument 143. Pp. 131-135.
[26] Voutilainen, P., Tuhkanen, H.-R., Katajajuuri, J.-M., Nousiainen, J. & Honkasalo, N. 2003. Environmental impacts and improvement possibilities of Emmental blue-label cheese. Maa- ja elintarviketalous 35: 91 p. In Finnish, abstract in English. http://www.mtt.fi/met/pdf/met35.pdf
[27] Saouter, E., van Hoof, G., Feijtel, T.C.J., Owens, J.W. 2002. The effect of compact formulations on the environmental profile of northern European granular laundry detergents. Part II: Life cycle assessment. Int. J LCA 7 (1) 27-38.
[28] Tenhunen, J, Oinonen, J. & Seppälä, J. 2000. Life cycle assessment of a water supply and wastewater treatment system – A case study of Tampere Water Works. The Finnish Environment 434. Finnish Environment Institute, Helsinki. 107 p. (In Finnish, abstract in English).
[29] Vares, S. 2001. Environmental impacts of materials in an apartment building (translation by authors of the article). VTT Research Notes 2108. 49 p. VTT Technical Research Centre of Finland, Espoo.
[30] Koskela, S., Seppälä, J. & Leivonen, J. 2002. Environmental impacts in assessing the ecoefficiency of buildings. The Finnish Environment 585, p. 1-54. Finnish Environment Institute, Helsinki. (Only abstract in English).
[31] Fortum 2002. Fortum Eco-Inventory, Oil Products, 1.3.2002. Data-sheet from Fortum Oil & Gas, P.O.Box 310, 06101 Porvoo, Finland.
[32] Schweimer and Levin. Life cycle inventory for the Golf A4. 40 p. Downloaded from www.volkswagen.-environment.de in August 2004.
[33] ISO (International Organization for Standardization) 2000. ISO 14042: Environmental management - Life cycle assessment - Life cycle impact assessment. International Organization for Standardization, Geneva.
[35] Hauschild, M., Bastrup-Birk, A., Hertel, O., Schöpp W., and Potting, J. 2004. Photochemical ozone formation. In Potting, J. and Hauschild, M. (eds.), Background for spatial differentiation in life cycle assessment – the EDIP 2003 methodology. Institute of Product Development, Copenhagen. [36] Seppälä, J., Knuuttila S. & Silvo, K. 2004. Eutrophication of Aquatic Ecosystems. A New Method for Calculating the Potential Contributions of Nitrogen and Phosphorus. Int J LCA 9 (2) 90-100.
[37] Seppälä, J., Silvenius, F., Grönroos, J., Mäkinen, T., Silvo, K. & Storhammar, E. 2001. Rainbow trout production and the environment (an LCA study). Helsinki, Finnish Environment institute. The Finnish Environment 529. 164 p. (In Finnish with an extended English summary).
[38] Seppälä, J. 1999. Decision analysis as a tool for life cycle assessment. LCA Documents, Vol. 4. Eci-Informa Press, Bayreuth Germany.
[39] NCRC (2005). Presentation of the National Consumer Research Centre’s Consumer Panel at: http://www.ncrc.fi/english/panel/index.html [referenced June 30, 2005]
[40] Walsh G.; Gwinner K.P.; Swanson S.R. (2004). What makes mavens tick? Exploring the motives of market mavens' initiation of information diffusion. Journal of Consumer Marketing 21 (2) 109-122. [41] Kitzinger, J. & Barbour, R.S. (2001). Introduction: the challenge and promise of focus groups. In. Barbour, R.S. & Kitzinger, J. (Eds.): Developing Focus Group Research. Politics, Theory and Practice. London, Thousand Oaks, New Delhi: Sage Publications.
[42] Finnveden, G., Hofstetter, P., Bare, J.C., Basson, L., Ciroth, A., Mettier, T., Seppälä, J., Johansson, J., Norris, G. & Volkwein, S. 2002. Normalisation, grouping, and weighting in life-cycle impact assessment. In: Udo de Haes, H.A., Finnveden, G., Goedkoop, M., Hauschild, M., Hertwich, E.G., Hofstetter, P., Jollit, O., Klöpfer, W., Krewitt, W., Lindeijer, E., Muller-Wenk, R., Olsen, S.I., Pennington, D.W., Potting, J. & Steen, B. (eds.) 2002. Life-Cycle Impact Assessment: Striving towards Best Practise, p. 177-. SETAC, Brussels, 250 s., ISBN 1-880611-54-6.
ILLUSTRATIONS
Figure 1. The iterative process of developing the benchmarks and the presentation types for consumer communications.
Figure 2. Excerpt from the first version of the brochure: illustration of how the benchmark can be applied.
Alternative benchmarks:
- scale - product LCAs
Alternative presentation
formats
A seminar for environmental communicators: - groupwork sessions Refinements for the presentation formats New presentation formats and brochure Draft brochure, first version Consumer panel: Focus group interviews A seminar First phase Consumer panel: Questionnaire by email Refinements for the brochure New www-site
Design of a new project for developing internet-tool for consumers
Second phase
Third phase Next project
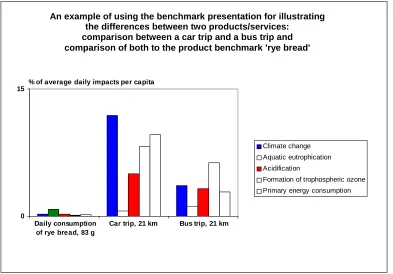
% of average daily impacts per capita
0 15
Ruisleivän päiväkulutus 83 g
Automatka 21 km Bussimatka 21 km
Climate change Aquatic eutrophication Acidification
Formation of trophospheric ozone Primary energy consumption
Daily consumption of rye bread, 83 g
Car trip, 21 km Bus trip, 21 km
An example of using the benchmark presentation for illustrating the differences between two products/services:
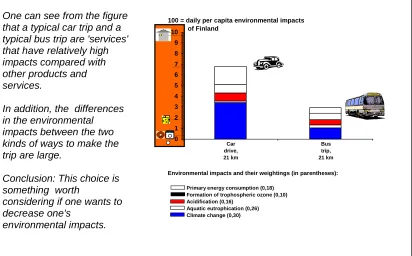
[image:18.595.73.466.416.690.2]Figure 3. Excerpt from the revised brochure: illustration of how the benchmark can be applied.
One can see from the figure that a typical car trip and a typical bus trip are 'services' that have relatively high impacts compared with other products and services.
In addition, the differences in the environmental impacts between the two kinds of ways to make the trip are large.
Conclusion: This choice is something worth
considering if one wants to decrease one's
environmental impacts.
How can the Benchmark be used?
An example of comparing two products or services
Does it matter how one makes one’s daily trips?
– How large is the difference between using a car and going by bus?
Bus trip, 21 km Car
drive, 21 km
100 = daily per capita environmental impacts of Finland
0 1 2 3 4 5 6 7 8 9 10
Primary energy consumption (0,18) Formation of trophospheric ozone (0,10) Acidification (0,16)
Aquatic eutrophication (0,26) Climate change (0,30)
TABLES
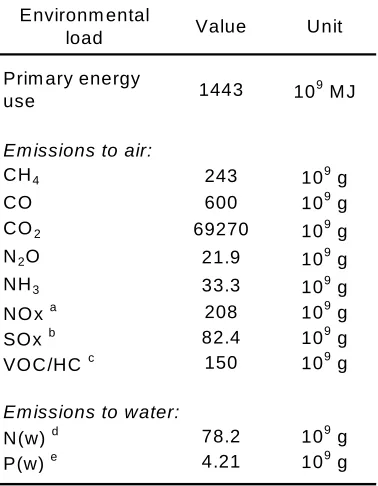
[image:20.595.68.257.155.398.2]Table 1. Environmental loads of the Finnish Economy in 2002. Data source: Finnish Environment Institute 2004.
Table 2. Product-benchmarks and their main LCA-information sources
Environm ental
load Value Unit Prim ary energy
use 1443 10
9
M J
Em issions to air:
CH4 243 109g
CO 600 109g
CO2 69270 109g
N2O 21.9 109g
NH3 33.3 109g
NO xa 208 109g SOxb 82.4 109g VOC/HC c 150 109g
Em issions to water:
N(w)d 78.2 109g P(w)e 4.21 109g
a
calculated as NO2 b
calculated as SO2 c
calculated as non-m ethane C
d
calculated as total N
e
calculated as total P
Product/service Main LCA and other main references Modifications and updating to Finnish conditions
Grönroos and Seppälä 2000. Agricultural
Rye bread production systems and the environment. Updated nutrient leaching & eutrophication
The Finnish Environment 431. of waters, electricity in Finland.
(Only abstract in English).
Voutilainen et al. 2003. Environmental
Emmental cheese impacts and improvement possibilities Updated nutrient leaching & eutrophication of Emmental blue-label cheese. Maa ja of waters, electricity in Finland.
elintarviketalous 35. (Only abstract in English). Saouter, van Hoof, Feijtel, Owens 2002.
Laundry The effect of compact formulations on the Consumption of electricity and water of typical environmental profile of northern European washing machine, 40 C,
granular laundry detergents. Part II: LCA Electricity and wastewater treatment in Finland. Int J LCA 7 (1) 27-38.
Koskela et al. 2002.
Apartment Environmental impacts in assessing the Updated electricity and district heating in Finland, ecoefficiency of buildings. The Finnish electricity of appliances in the appartment not included. Environment 585. (Only abstract in English).
Schweimer and Levin, Energy consumption and emissions of vehicles from a
Car drive Life cycle inventory for the Golf A4. national model (www.lipasto.fi, made by VTT Technical
downloaded from Research Centre of Finland), EURO 3 norm.
[image:20.595.66.502.540.788.2]Table 3. Inventory results of the benchmark products
Table 4. Characterisation factors. See text for references.
Emission Coefficient value
Unit
Climate change
CO2 1 g CO2eq g-1 N2O 296 g CO2eq g-1 CH4 23 g CO2eq g-1
Tropospheric ozone formationa
NO2 0.35 pers*ppb*hours g-1 VOC/HC 0.27 pers*ppb*hours g-1 CH4 0.33 pers*ppb*hours g-1
Acidification
SO2 0.463 AE meq g-1 NO2 0.186 AE meq g-1 NH3 0.535 AE meq g-1
Aquatic eutrophicationb
NO2 0.015 g PO4 eq g-1 NH3 0.038 g PO4 eq g-1 Tot P (w) 1.192 g PO4 eq g-1 PO4as P(w) 3.060 g PO4 eq g-1 Tot N (w) 0.215 g PO4 eq g-1 NH4, NH3as N(w) 0.420 g PO4 eq g-1 NO2, NO3as N(w) 0.420 g PO4 eq g-1
a
Effects on vegetation (AOT 40).
bThese are average values for Finnish emissions. However, in the calculations sector-specific values have been used, derived from Seppälä et al. 2004.
Rye bread Laundry Cheese Car drive Apartment
Functional unit: 83 g 0,5 wash 30 g 20 km 41 m2
Unit:
Primary energy MJ 1.25 1.97 a 69.6 87.3
CH4 g 0.080 0.419 6.09 0.400 15.1
CO g 0.055 0.135 0.090 33.2 9.24
CO2 g 62.1 130 112 4684 5686
N2O g 0.140 0.016 0.48 0.6 0.75
NH3 g 0.092 b 1.86 b b
NOx g 0.163 0.398 0.480 4.67 10.2
SOx g 0.078 0.356 0.210 3.07 10.5
VOC/HC g 0.006 0.206 0.030 10.8 0.375
N(w) g 0.181 0.005 1.11 0.004 c
P(w) g 0.016 0.008 0.063 0.001 c
a
Value so far confidential. b
No data for NH3emission in the original inventories of laundry, car drive and appartment. c
[image:21.595.68.229.421.723.2]