www.atmos-meas-tech.net/9/3999/2016/ doi:10.5194/amt-9-3999-2016
© Author(s) 2016. CC Attribution 3.0 License.
Validation and analysis of MOPITT CO observations
of the Amazon Basin
M. N. Deeter1, S. Martínez-Alonso1, L. V. Gatti2, M. Gloor3, J. B. Miller4,5, L. G. Domingues2, and C. S. C. Correia2 1Atmospheric Chemistry Observations and Modeling Laboratory, National Center for
Atmospheric Research, Boulder, CO, USA
2Instituto de Pesquisas Energéticas e Nucleares (IPEN)–Comissao Nacional de Energia Nuclear (CNEN)–Atmospheric Chemistry Laboratory, 2242 Avenida Professor Lineu Prestes, Cidade Universitaria, Sao Paulo CEP 05508-000, Brazil 3School of Geography, University of Leeds, Woodhouse Lane, Leeds LS9 2JT, UK
4Global Monitoring Division, Earth System Research Laboratory, National Oceanic and Atmospheric Administration, 325 Broadway, Boulder, CO 80305, USA
5Cooperative Institute for Research in Environmental Sciences (CIRES), University of Colorado, Boulder, CO 80309, USA
Correspondence to:M. N. Deeter ([email protected])
Received: 20 April 2016 – Published in Atmos. Meas. Tech. Discuss.: 26 April 2016 Revised: 29 July 2016 – Accepted: 2 August 2016 – Published: 23 August 2016
Abstract.We analyze satellite retrievals of carbon monoxide from the MOPITT (Measurements of Pollution in the Tro-posphere) instrument over the Amazon Basin, focusing on the MOPITT Version 6 “multispectral” retrieval product (ex-ploiting both thermal-infrared and near-infrared channels). Validation results based on in situ vertical profiles measured between 2010 and 2013 are presented for four sites in the Amazon Basin. Results indicate a significant negative bias in retrieved lower-tropospheric CO concentrations. The possi-ble influence of smoke aerosol as a source of retrieval bias is investigated using collocated Aerosol Robotic Network (AERONET) aerosol optical depth (AOD) measurements at two sites but does not appear to be significant. Finally, we exploit the MOPITT record to analyze both the mean annual cycle and the interannual variability of CO over the Amazon Basin since 2002.
1 Introduction
Seasonal biomass burning in the Amazon Basin profoundly affects atmospheric composition, both regionally and glob-ally. Amazonian emissions include a wide range of trace gases and aerosols (Andreae et al., 2001, 2012). With respect to climate change, future emissions from the Amazon Basin could play a significant role in determining the trajectory of
global temperatures (Gullison et al., 2007). Biomass burning emissions in Amazonia are the result of deforestation prac-tices (Malhi et al., 2008) and understory fires, i.e., acciden-tal fires that spread into intact rainforest (Cochrane, 2003). Accurately quantifying emissions from Amazonia from all sources will be increasingly important as policies are enacted to reduce emissions of greenhouse gases associated with de-forestation and degradation (Miles and Kapos, 2008; Aragão and Shimabukuro, 2010).
with relatively high (weekly or better) sampling frequency and spatial density.
However, the optimal use of satellite retrievals for trace-gas concentrations in inverse modeling systems requires that (1) the vertical sensitivity of the retrieved profiles and the inclusion of a priori information be properly represented (Kopacz et al., 2010) and (2) any retrieval biases be com-pensated (Hooghiemstra et al., 2012). The geographical vari-ability of retrieval properties (i.e., vertical sensitivity and re-trieval biases) for some satellite products highlights the im-portance of thoroughly analyzing retrieval performance prior to the use of such products in inverse modeling studies.
In the following, we analyze retrievals of carbon monox-ide (CO) from the MOPITT (Measurements of Pollution in the Troposphere) satellite instrument (Drummond et al., 2010; Deeter et al., 2014) to investigate the utility of MO-PITT products for estimating emissions from the Amazon Basin. We first characterize the vertical sensitivity of MO-PITT CO retrieval products over Amazonia through an anal-ysis of the MOPITT retrieval averaging kernels. Next, we present new MOPITT validation results by exploiting a set of in situ CO profiles measured from aircraft at four sites in Amazonia between 2010 and 2013. The influence of smoke aerosols on MOPITT retrievals is then studied by compar-ing MOPITT retrieval biases with ground-based aerosol op-tical depth measurements from two Amazonian sites in the Aerosol Robotic Network (AERONET). Finally, we present and interpret the recent history of CO concentrations over Amazonia (2002–2015) based on the MOPITT record.
2 Satellite retrieval properties 2.1 MOPITT retrieval products
MOPITT is a gas-filter correlation radiometer instrument on the NASA Terra polar-orbiting satellite. MOPITT observa-tions enable retrievals of tropospheric vertical profiles and total column amounts of carbon monoxide (CO) based on si-multaneous thermal-infrared (TIR) and near-infrared (NIR) observations (Drummond et al., 2010). The MOPITT instru-ment has been operating nearly continuously since 2000, pro-viding the longest available satellite record for CO. MO-PITT retrieval products have progressively improved as the result of accumulated knowledge regarding the instrument, forward-modeling methods, and geophysical variables (Wor-den et al., 2014). Results presented in this manuscript ex-ploit the MOPITT Version 6 (V6) TIR-only and “multispec-tral” TIR-NIR products (Deeter et al., 2014). The TIR-NIR product offers the greatest vertical resolution, and particu-larly the greatest sensitivity to CO in the lower troposphere. However, the improved sensitivity of this product is only achieved in daytime MOPITT observations over land. The TIR-only product offers the highest temporal stability and
similar performance in variable observing situations (day and night, land and ocean).
Typically, TIR-based satellite retrieval products (includ-ing those from the AIRS, TES, and IASI instruments) ex-hibit relatively low sensitivity to CO concentrations near the earth’s surface except in situations with high thermal con-trast (Deeter et al., 2007). Thus, CO molecules emitted at the surface may only become “visible” to TIR-based instru-ments after they ascend into the free troposphere through vertical mixing and may be advected large distances hori-zontally. The combined effects of instrumental vertical res-olution and atmospheric dynamics thus limit both the spa-tial and temporal resolution of estimated CO emissions based on inverse modeling. Similar limitations affect the estimation of CO2emissions using TIR satellite observations (Cheval-lier et al., 2005). To maximize the sensitivity to near-surface CO, the MOPITT instrument uniquely incorporates both TIR and NIR gas correlation radiometers. For daytime observa-tions over land, the added information provided by the NIR channels can substantially enhance the sensitivity to CO near the surface compared to TIR-only retrievals (Worden et al., 2010). This enhancement is illustrated below in an analysis of the MOPITT averaging kernels.
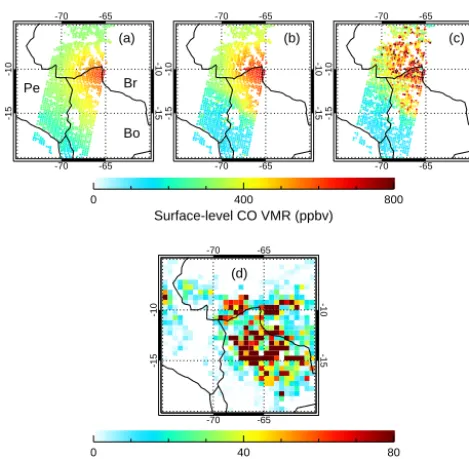
An example of the difference in TIR-only and TIR-NIR re-trievals of surface-level CO concentrations for a single MO-PITT overpass of the western Amazon Basin on 17 Septem-ber 2010 is shown in Fig. 1. The selected date represents a day approximately in the middle of the dry season when fire emissions affect much of the southern Amazon Basin. Maps of the CO a priori, V6 TIR-only, and V6 TIR-NIR products are presented along with a map of gridded Moderate Resolu-tion Imaging Spectroradiometer (MODIS) Aqua fire counts for the 8-day period from 15 to 22 September 2010. Fires during this period were observed in southwestern Brazil and north-central Bolivia. As described in the following section, the a priori represents the background (or default) CO con-centration for the retrieval algorithm. The a priori map indi-cates the highest surface-level CO concentrations in north-ern Bolivia, with CO concentrations decreasing towards the north, west, and south. V6 TIR-only surface-level retrievals exhibit a pattern very similar to the a priori but with some-what lower CO concentrations in Peru and southwestern Bo-livia, and somewhat higher CO concentrations in Brazil. In contrast, the map of V6 TIR-NIR surface-level retrievals re-veals a visibly different pattern compared to the a priori, with the region of highest CO concentrations including much of western Brazil.
2.2 Averaging kernel variability
-70 -65 -70 -65
-15
-10
-15
-10
-70 -65 -70 -65
-15
-10
-15
-10
-70 -65 -70 -65
-15
-10
-15
-10
0 400 800
Surface-level CO VMR (ppbv)
(a) (b) (c)
Pe Br
Bo
-70 -65
-70 -65
-15
-10
-15
-10
(d)
0 40 80
[image:3.612.50.285.63.293.2]Fire counts (MODIS/Aqua)
Figure 1.Comparison of(a)climatological MOPITT surface-level
CO a priori concentrations,(b)V6 TIR-only retrieved surface-level
CO, and(c)V6 TIR-NIR retrieved surface-level CO for a daytime
MOPITT overpass of the western Amazon Basin on 17 September
2010. Country abbreviations in(a)include “Pe” for Peru, “Br” for
Brazil, and “Bo” for Bolivia. Gridded fire counts based on MODIS Aqua observations for the 8-day period from 15 to 22 September
2010 are shown in(d). The map of V6 TIR-NIR surface-level
re-trievals reveals a region of high CO concentrations over much of western Brazil, whereas the V6 TIR-only retrievals tend more to-wards the a priori.
above that level (Deeter et al., 2013). Internally, CO concen-trations in the retrieval state vector are represented in terms of the logarithm of the VMR. For each retrieved log(VMR) profile resulting from a single MOPITT observation, the re-trieval averaging kernel matrixAis produced simultaneously and is provided as a diagnostic in the MOPITT Level 2 and Level 3 data files. Acharacterizes the sensitivity of the re-trieved log(VMR) profile to both the true log(VMR) profile
xtrueand a priori log(VMR) profilexathrough the relation
xrt v=xa+A(xtrue−xa). (1)
In the V6 retrieval algorithm,xa profiles vary seasonally and geographically according to a multi-year model-based CO climatology (Lamarque et al., 2012; Deeter et al., 2014). This global climatology was produced from a 10-year Com-munity Atmosphere Model with Chemistry (CAM-chem) run (2000–2009) and incorporated CO emissions from the GFED2 emissions database (van der Werf et al., 2006). The climatology is gridded at 1◦(latitude and longitude) horizon-tal resolution and monthly temporal resolution. Spatial and temporal interpolation are used to generate a priori values at a specific location and day. Each row ofAcorresponds to one
level in the retrieved profile, whereas each column ofA cor-responds to one level in the “true” CO profile. Each element ofAdescribes the sensitivity of the log(VMR) value at one level in the retrieved profile to the log(VMR) value at one level in the true profile.Adepends on the weighting function matrixK, a priori covariance matrixCa, and observation er-ror covariance matrixCeaccording to the relation (Rodgers, 2000)
A=(KTC−e1K+Ca−1)−1KTC−e1K. (2) Elements ofK(also known as the “Jacobian” matrix) de-scribe the vertical sensitivity of the measured radiances to ap-plied perturbations to individual levels in the CO vertical pro-file. As implied by Eq. (2), the features ofKlargely dictate the features ofA. MOPITT averaging kernels are strongly sensitive to both instrumental variables and geophysical pa-rameters (Worden et al., 2013; Deeter et al., 2015).
Analysis of the averaging kernels enables an understand-ing of the vertical resolution and information content of the MOPITT retrieved profiles. The width of each averaging ker-nel provides a measure of the vertical resolution associated with a specific level of the retrieved profile, whereas the area under the averaging kernel (i.e., the sum of the elements) in-dicates the integrated sensitivity of the retrieval to the true profile (Rodgers, 2000). Averaging kernels characterized by a small area (e.g., much less than one) indicate a retrieval level heavily weighted by the a priori. The trace ofA(i.e., the sum of the diagonal elements) defines the “degrees of freedom for signal”, or DFS, and is often interpreted as the number of independent pieces of information in the retrieval from the measurement. Properties of the averaging kernel for the retrieved surface-level CO concentration are particularly important since the primary sources of CO are located at the surface, and tropospheric concentrations of CO often peak at or near the surface.
2.3 Averaging kernel comparisons
-0.2 0.0 0.2 0.4 0.6 TIR-only Averaging Kernels
1000 100
Pressure (hPa)
1000 700 400
Surface 800
600
400 200 hPa
<DFS> = 1.51
-0.2 0.0 0.2 0.4 0.6 TIR-NIR Averaging Kernels
1000 100
Pressure (hPa)
1000 700 400
[image:4.612.63.277.64.385.2]<DFS> = 1.89 7/01/2010
Figure 2.Comparison of mean retrieval averaging kernels for the MOPITT Version 6 TIR-only (top panel) and TIR-NIR (bottom
panel) products for the western Amazon Basin (within 10–5◦S, 70–
65◦W) on 1 July 2010. For clarity, only the averaging kernels for
al-ternating levels in the MOPITT retrieval grid (i.e., surface, 800 hPa, 600 hPa, etc.) are actually plotted.
431 and 512 ppbv, in comparison with an a priori value of 380 ppbv.
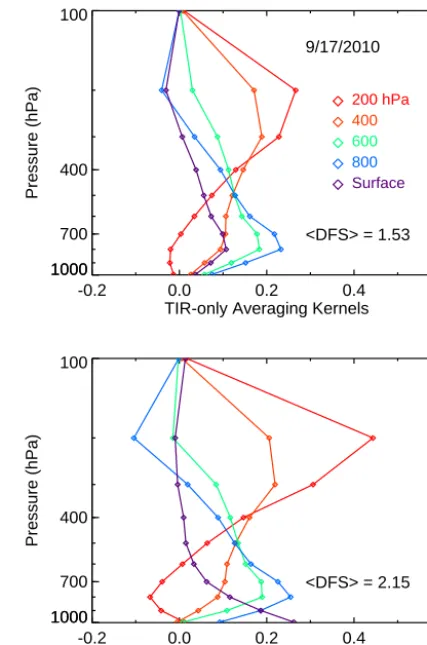
Mean averaging kernels for the TIR-only product for the high-CO overpass on 17 September 2010 (depicted in the top panel of Fig. 3) are considered first. For the selected scene, the mean TIR-only surface-level averaging kernel peaks at 800 hPa and decreases sharply at the surface, revealing that the TIR-only surface-level retrievals exhibit poor sensitiv-ity to CO at the surface. Also, the strong similarsensitiv-ity in the shape of the surface-level and 800 hPa averaging kernels il-lustrates the lack of independent information in the retrieved profile at these two levels. In contrast, for the TIR-NIR av-eraging kernels shown in the bottom panel of Fig. 3, the mean surface-level averaging kernel peaks at the surface and rapidly decreases at higher levels. Based on the full width at half maximum of this averaging kernel, the sensitivity of the TIR-NIR surface-level retrieval is dominated by the layer between the surface and about 800 hPa. Moreover, it is clear from the TIR-NIR averaging kernels that the retrieved
con--0.2 0.0 0.2 0.4 0.6 TIR-only Averaging Kernels
1000 100
Pressure (hPa)
1000 700 400
Surface 800
600
400 200 hPa
<DFS> = 1.53
-0.2 0.0 0.2 0.4 0.6 TIR-NIR Averaging Kernels
1000 100
Pressure (hPa)
1000 700 400
<DFS> = 2.15 9/17/2010
Figure 3.Comparison of mean retrieval averaging kernels for the MOPITT Version 6 TIR-only (top panel) and TIR-NIR (bottom panel) products for the western Amazon Basin on 17 September 2010.
centrations at the surface and at 800 hPa contain independent information with respect to the CO profile. This enhancement in the retrieval information content is also consistent with the higher mean DFS value observed for the TIR-NIR retrievals (2.15) compared to the TIR-only retrievals (1.53).
[image:4.612.321.535.66.389.2]3 Validation
Retrieval validation involves the rigorous analysis of differ-ences between retrieval products and independent measuments with well-characterized uncertainties. MOPITT re-trievals have been validated with a variety of in situ datasets from which CO vertical profiles have been produced (Em-mons et al., 2009; Deeter et al., 2014). For validating optimal estimation-based retrievals, the standard measure of retrieval error excludes the known smoothing effect of the retrieval process (as represented by the averaging kernel matrix) and the dependence on the a priori profile. Thus, rather than di-rect comparisons of retrieval products with in situ data, vali-dation involves comparisons of retrieved profiles with simu-lated profiles calcusimu-lated according to Eq. (1). For such com-parisons,Aandxaare extracted from the MOPITT Level 2 data files and then applied to thextrueprofile which is based on the in situ data.
Because of the variety of sources of retrieval error, and the geographical and temporal variability of such errors, val-idation of the MOPITT CO product is an ongoing activity. Below, we present validation results for MOPITT retrieval products for the Amazon Basin for the first time. At least two potential challenges for MOPITT retrievals occur in this region during the biomass burning season. First, extreme CO concentrations could conceivably exceed the valid range of CO concentrations for the MOPITT radiative transfer model. This was found to be an issue for the MOPITT Version 3 product, which was addressed in the development of the Ver-sion 4 product (Deeter et al., 2010). Second, the effects of highly concentrated smoke aerosols could also degrade the quality of MOPITT retrievals. This topic is addressed in Sect. 3.3.
3.1 Review of V6 validation results
Validation results for the MOPITT V6 product were previ-ously reported in Deeter et al. (2014). Those results were based on in situ profiles acquired during the HIPPO (HI-APER Pole-to-Pole Observations) field campaign (2009– 2011) and through a long-term NOAA monitoring program mostly over North America. One significant finding from the HIPPO validation results was the apparent latitude depen-dence of observed retrieval biases in the V6 TIR-only prod-uct. For example, for the 800 hPa retrieval level, there ap-peared to be a significant negative bias in the tropics which was absent in midlatitude and polar regions. The underly-ing cause of the observed latitude dependence of the bias has not been explained. Moreover, since nearly all HIPPO flights were over the open ocean, it is unclear if the observed lati-tude dependence would be expected over land scenes as well as ocean scenes.
3.2 Aircraft-based in situ CO measurements in the Amazon
Below, we exploit a set of in situ CO vertical profiles de-rived from a trace-gas sampling program over the Amazon Basin that began in 2010 (Gatti et al., 2014). Profiles are based on air samples acquired approximately biweekly from aircraft at four sites: Alta Floresta (ALF, 9◦S, 57◦W), Rio Branco (RBA, 9◦S, 68◦W), Tabatinga (TAB, 6◦S, 60◦W), and Santarém (SAN, 3◦S, 55◦W). The primary objective of the program is to observe and analyze the state, changes, and climate sensitivity of the Amazon carbon pools. In addition to CO, concentrations of CO2, CH4, N2O, and SF6are also measured for each air sample. Precision and accuracy of the in situ CO dry-air mole fraction (DMF) measurements are re-ported to be less than 1 ppb (http://www.esrl.noaa.gov/gmd/ ccgg/aircraft/qc.html). The wide geographical distribution of the four sites permits the compositional analysis of airmasses as they first enter the Amazon Basin and as they become pro-gressively affected by regional biomass burning emissions.
For most flights, the maximum sampling altitude attained by the aircraft flying over the Amazon Basin was approxi-mately 4.4 km, corresponding to a pressure of about 580 hPa. This altitude is substantially less than the altitude required to produce a complete 10-level vertical profile (from the sur-face to 100 hPa) suitable for MOPITT validation. Aircraft measurements of CO DMF were transformed into MOPITT VMR “validation profiles” in a process requiring several steps and two distinct pressure grids. First, in situ data for each profile were interpolated onto the standard 35-level fine grid used internally in the MOPITT retrieval algorithm (Ed-wards et al., 1999). Since this step is limited to grid levels only up to 600 hPa, the interpolated DMF value at 600 hPa was extended vertically up to 250 hPa. In situ DMF values were then converted to moist-air VMR values using water vapor mixing ratios included in the CAM-chem-based cli-matology described above (Lamarque et al., 2012). Maxi-mum differences between CO DMF and VMR values were about 3 %; differences generally peak at the surface. For lev-els in the fine grid at and above 100 hPa (the approximate altitude of the tropical tropopause), CO VMR values were taken from the CAM-chem climatology. VMR values for grid between 250 and 100 hPa were obtained by interpolation. Fi-nally, resulting fine-grid VMR validation profiles were re-gridded into coarse 10-level validation profiles (for consis-tency with the actual MOPITT retrieval grid) by averaging the fine-grid VMR values in the layers immediately above the corresponding levels in the retrieval grid (Deeter et al., 2013).
10 100 1000 CO VMR, in situ (ppbv)
10 100 1000
CO VMR, MOPITT (ppbv)
TIR-only: 600 hPa
ALF
RBA
SAN
TAB
r = 0.86 bias = -13. % SD = 15. %
<AΣ> = 0.86
10 100 1000
CO VMR, in situ (ppbv) 10
100 1000
CO VMR, MOPITT (ppbv)
TIR-only: 800 hPa
r = 0.94 bias = -16. % SD = 14. %
<AΣ> = 0.68
10 100 1000
CO VMR, in situ (ppbv) 10
100 1000
CO VMR, MOPITT (ppbv)
TIR-only: Surface
r = 0.98 bias = -9.8 % SD = 8.2 %
[image:6.612.49.286.64.377.2]<AΣ> = 0.27
Figure 4.MOPITT Version 6 TIR-only validation results for MO-PITT mid- and lower-tropospheric CO retrievals based on aircraft profiles acquired at four Amazonian sites: Alta Floresta (ALF), Rio Branco (RBA), Tabatinga (TAB), and Santarém SAN). Validation statistics are based on log(VMR), to be consistent with the retrieval state vector. Vertical error bars indicate the variability (standard de-viation) of the MOPITT data used to calculate each of the plot-ted mean values. Each panel shows the least-squares best-fit line (dashed) as well as boundaries around the ideal one-to-one line
cor-responding to±10 % errors (indicated by the dotted lines).
Sum-mary statistics (bias, standard deviation, and correlation coefficient)
are listed on each panel in addition to the mean kernel area (A6);
this diagnostic provides a useful index for a priori dependence.
For example, for the TIR-only mean averaging kernel for the 800 hPa retrieval level on 17 September 2010, we find that 80 % of the kernel area corresponds to levels within the in situ measured altitude range from the surface to 600 hPa. For the 600 hPa retrieval level, 66 % of the kernel area is as-sociated with levels within the measured altitude range. This diagnostic decreases to less than 50 % for higher retrieval lev-els. Thus, the lack of in situ data above 4.4 km suggests that validation results will be most meaningful for retrieval levels from the surface to 600 hPa.
10 100 1000
CO VMR, in situ (ppbv) 10
100 1000
CO VMR, MOPITT (ppbv)
TIR-NIR: 600 hPa
ALF
RBA
SAN
TAB
r = 0.82 bias = -25. % SD = 18. %
<AΣ> = 0.90
10 100 1000
CO VMR, in situ (ppbv) 10
100 1000
CO VMR, MOPITT (ppbv)
TIR-NIR: 800 hPa
r = 0.91 bias = -27. % SD = 18. %
<AΣ> = 0.73
10 100 1000
CO VMR, in situ (ppbv) 10
100 1000
CO VMR, MOPITT (ppbv)
TIR-NIR: Surface
r = 0.94 bias = -4.6 % SD = 17. %
<AΣ> = 0.38
Figure 5.MOPITT Version 6 TIR-NIR validation results for MO-PITT mid- and lower-tropospheric CO retrievals based on aircraft profiles acquired at four Amazonian sites. See caption to Fig. 4.
3.2.1 V6 TIR-only
[image:6.612.308.545.66.378.2]Mean TIR-only biases at the surface, 800, and 600 hPa re-trieval levels are −9.8, −16, and −13 %, respectively, in-dicating that MOPITT TIR retrievals underestimate surface and lower-tropospheric CO concentrations. For the HIPPO validation results, observed mean TIR-only biases for mea-surements acquired between 30◦S and the Equator for the surface, 800, and 600 hPa retrieval levels were−1,−2, and
−2 %, respectively. However, the HIPPO validation results were based on relatively few in situ profiles in the same lati-tude range as the Amazonian profiles (i.e., between 20◦S and the Equator), possibly because prevailing cloudiness near the ITCZ (Intertropical Convergence Zone) resulted in fewer MOPITT retrievals. Statistically, therefore, the HIPPO re-sults for this latitude range might not be as robust as for other regions. In the latitude range between the Equator and 30◦N, HIPPO mean biases for the surface, 800, and 600 hPa re-trieval levels were−6,−11, and−12 %, respectively. Thus, relative to the HIPPO results, observed mean TIR-only re-trieval biases for the Amazon appear to be more consistent with the observed biases in the northern tropics than the southern tropics.
As shown in Fig. 4, surface-level in situ CO concentra-tions (smoothed with the TIR-only averaging kernels) vary from about 100 ppbv to over 500 ppbv. In previous MOPITT validation papers (e.g., Deeter et al., 2014), the highest CO concentrations included in the in situ profiles were less than 400 ppbv. Inspection of Fig. 4 indicates that the retrieval bi-ases do not visibly increase at the upper range of CO con-centrations. For example, in the results for the surface and 800 hPa, the best-fit line appears to fit the data equally well at low and high CO concentrations. Thus, for the range of CO concentrations presented by the Amazonian profiles, the quality of MOPITT TIR-only retrievals appears to be unaf-fected by high CO concentrations.
The correlation coefficients for the three retrieval levels decrease with increasing altitude, from 0.98 at the surface to 0.86 at 600 hPa. This trend likely reflects both (1) the in-creasing role of errors associated with the lack of in situ data above 4.4 km and (2) the stronger a priori weighting for the surface-level retrieval, as indicated by the listed mean ker-nel area values. The influence of a priori variability on the correlation coefficients is discussed in Sect. 3.2.3.
3.2.2 V6 TIR-NIR
As indicated in Fig. 5, mean TIR-NIR biases at the sur-face, 800, and 600 hPa retrieval levels are−4.6, −27, and
[image:7.612.316.536.128.218.2]−25 %, respectively. Thus, compared to the TIR-only results, the negative bias at the surface is smaller, while the nega-tive biases at 800 and 600 hPa are substantially larger. Like the TIR-only results, the least-squares best-fit lines appear to fit the data equally well at low and high CO concentra-tions. Thus, the quality of MOPITT TIR-NIR retrievals also appears to be unaffected by high CO concentrations.
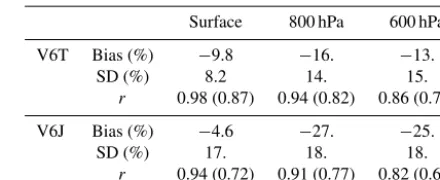
Table 1.MOPITT validation results based on in situ CO verti-cal profiles acquired at four sites in the Amazon Basin from 2010 to 2013. Correlation coefficients shown in parentheses indicate re-sults obtained when a priori influence is excluded, as described in Sect. 3.2.3.
Surface 800 hPa 600 hPa
V6T Bias (%) −9.8 −16. −13.
SD (%) 8.2 14. 15.
r 0.98 (0.87) 0.94 (0.82) 0.86 (0.75)
V6J Bias (%) −4.6 −27. −25.
SD (%) 17. 18. 18.
r 0.94 (0.72) 0.91 (0.77) 0.82 (0.69)
As indicated by both the residual standard deviation val-ues and correlation coefficients listed in Figs. 4 and 5 (and in Table 1), errors for the TIR-NIR product generally ap-pear to be larger than for the TIR-only product. This effect is most evident at the surface, where the standard deviation is 17 % for the TIR-NIR product, compared to 8 % for the TIR-only product. To some extent, larger biases and variable retrieval errors are evident in the TIR-NIR product due to the use of a “gain enhancement factor” to amplify the influ-ence of the NIR radiances in the TIR-NIR product (Deeter et al., 2011). This strategy reduces the retrieval “smoothing er-ror” but also magnifies random retrieval errors due to errors in both the TIR and NIR radiances. However, because of the greater CO sensitivity of the TIR-NIR retrievals (as indicated by the larger mean kernel areaA6), larger standard
devia-tions would also be expected due to potential CO horizontal gradients within the 200 km radius used to match MOPITT retrievals with the in situ profiles. Therefore, the larger stan-dard deviation associated with the TIR-NIR product does not by itself necessarily indicate lower retrieval quality.
3.2.3 Influence of a priori on validation results
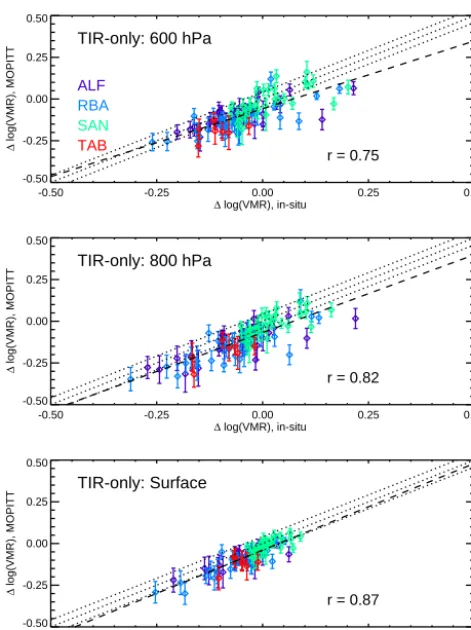
In part, the strong correlations evident in Figs. 4 and 5 are the result of the variability of the a priori, rather than variabil-ity of atmospheric CO. As the averaging kernels decrease in magnitude, Eq. (1) indicates that the MOPITT retrieved CO profile (and simulated retrieval based on the in situ profile) should tend toward the a priori profile. To analyze the corre-lation resulting strictly from actual CO variability, validation results may be presented in terms of the departure of the re-trieved log(VMR) value from the a priori value, i.e.,
1x=xrt v−xa=A(xtrue−xa). (3)
demon--0.50 -0.25 0.00 0.25 0.50
Δ log(VMR), in-situ
-0.50 -0.25 0.00 0.25 0.50
Δ
log(VMR), MOPITT
TIR-only: 600 hPa
ALF
RBA
SAN
TAB
r = 0.75
-0.50 -0.25 0.00 0.25 0.50
Δ log(VMR), in-situ
-0.50 -0.25 0.00 0.25 0.50
Δ
log(VMR), MOPITT
TIR-only: 800 hPa
r = 0.82
-0.50 -0.25 0.00 0.25 0.50
Δ log(VMR), in-situ
-0.50 -0.25 0.00 0.25 0.50
Δ
log(VMR), MOPITT
TIR-only: Surface
[image:8.612.49.285.63.378.2]r = 0.87
Figure 6.MOPITT Version 6 TIR-only validation results (as pre-sented in Fig. 4), with a priori influence removed from both the MO-PITT retrieved values and simulated retrievals based on the in situ data. As discussed in Sect. 3.2.3, plotted values correspond to the difference of retrieved (or simulated) log(VMR) values and the a priori log(VMR) value.
strate robust correlations between the retrievals and in situ values, separate from the effects of a priori variability.
3.2.4 Effects of limited aircraft altitude range
The set of aircraft in situ profiles used for MOPITT valida-tion include a small subset for which the CO VMR in the extrapolated section of the validation profiles (between 600 and 250 hPa) was at least 120 ppbv. While even higher CO concentrations have recently been observed in the Amazo-nian upper troposphere during the dry season (Wendisch et al., 2016), it is plausible that the occurrence of biomass burn-ing plumes at altitudes near 580 hPa (i.e., the altitude of the highest in situ sample) might yield some validation profiles containing overestimated CO concentrations in the upper tro-posphere. A simple sensitivity experiment was therefore per-formed to recalculate the validation statistics after discarding all profiles where the extrapolated mixing ratio was greater than 120 ppbv. Overall, this eliminated about one-sixth of the profiles. For both the TIR-only and TIR-NIR products, the
-0.50 -0.25 0.00 0.25 0.50
Δ log(VMR), in-situ
-0.50 -0.25 0.00 0.25 0.50
Δ
log(VMR), MOPITT
TIR-NIR: 600 hPa
ALF
RBA
SAN
TAB
r = 0.69
-0.50 -0.25 0.00 0.25 0.50
Δ log(VMR), in-situ
-0.50 -0.25 0.00 0.25 0.50
Δ
log(VMR), MOPITT
TIR-NIR: 800 hPa
r = 0.77
-0.50 -0.25 0.00 0.25 0.50
Δ log(VMR), in-situ
-0.50 -0.25 0.00 0.25 0.50
Δ
log(VMR), MOPITT
TIR-NIR: Surface
[image:8.612.311.545.66.376.2]r = 0.72
Figure 7.MOPITT Version 6 TIR-NIR validation results (as pre-sented in Fig. 5), with a priori influence removed from both the MO-PITT retrieved values and simulated retrievals based on the in situ data. As discussed in Sect. 3.2.3, plotted values correspond to the difference of retrieved (or simulated) log(VMR) values and the a priori log(VMR) value.
maximum resulting change in the overall retrieval bias was 3 %. Thus, the MOPITT validation results for the surface, 800, and 600 hPa are not strongly affected by the inclusion of profiles with extrapolated VMR values above 120 ppbv. This finding is consistent with the properties of the MOPITT av-eraging kernels and provides further evidence that the lack of in situ data above 4.4 km does not severely affect the valida-tion of the MOPITT retrieval levels in the lower troposphere.
on MOPITT retrieval error. However, MOPITT validation re-sults have never previously been reported for regions strongly affected by biomass burning emissions, where AODs of one or greater are often observed (Eck et al., 1999).
For MOPITT CO retrievals, dense smoke aerosols pro-duced by biomass burning could conceivably cause retrieval errors through at least two mechanisms. For MOPITT’s NIR channels, scattering from aerosol particles could potentially alter the effective optical path length through the atmosphere. This effect is explicitly represented in retrieval algorithms for carbon dioxide and methane using satellite observations in spectral bands near 1.6 and 2.0 µm (Butz et al., 2011; Yoshida et al., 2013). Alternatively, extreme aerosol concen-trations might locally affect meteorological conditions, either by reducing insolation at the surface or through atmospheric heating caused by absorbing aerosols such as black carbon (Ramanathan and Carmichael, 2008). This effect could in-directly result in retrieval error for both the TIR-only and TIR-NIR retrievals if it caused a significant error in the assumed atmospheric temperature profile. Temperature and water vapor profiles used in MOPITT V6 retrieval processing are extracted from the MERRA (Modern-Era Retrospective Analysis for Research and Applications) reanalysis product (http://gmao.gsfc.nasa.gov/merra/).
Two of the four Amazonian sites for which aircraft CO profiles were exploited for MOPITT validation in Sect. 3.2 also host AERONET stations (Holben et al., 2001). This co-incidence permits the analysis of the dependence of MO-PITT retrieval biases on AOD. Possible MOMO-PITT aerosol-dependent retrieval biases were studied by comparing MO-PITT retrieval biases at 800 hPa from Sect. 3.2 with ground-based AOD measurements at 500 nm from the Alta Floresta and Rio Branco AERONET sites. The 800 hPa retrieval level was selected for this comparison because (1) the averaging kernel area for this level typically indicates a weak depen-dence on the a priori for both the TIR-only and TIR-NIR products and (2) calculated retrieval biases at this level are not strongly affected by the lack of in situ data for the up-per troposphere (as described above). AOD values at 500 nm were extracted from AERONET daily-mean data files for the same dates on which the aircraft in situ data were acquired.
The dependence of MOPITT retrieval bias at 800 hPa on AOD for both the TIR-only and TIR-NIR products is pre-sented in Fig. 8. Each plotted point indicates the mean MO-PITT retrieval bias and daily-mean AOD for a single daytime MOPITT overpass of one of the two AERONET sites. While there are relatively few data points indicating high AOD val-ues, the plotted data do not appear to demonstrate a clear AOD dependence for the retrieval bias for either type of MO-PITT product. To analyze the relationship further, mean and standard deviation retrieval bias values were calculated sep-arately for data subsets where AOD < 0.5 (a total of 28 over-passes) and AOD >=0.5 (nine overpasses). Presumably, if aerosols did produce a systematic retrieval bias, it would be revealed by comparing the means and standard deviations for
0.0 0.5 1.0 1.5 2.0 AERONET AOD
-80 -60 -40 -20 0 20 40
800 hPa Retrieval Bias (%)
ALF RBA
V6 TIR-only
0.0 0.5 1.0 1.5 2.0 AERONET AOD
-80 -60 -40 -20 0 20 40
800 hPa Retrieval Bias (%)
[image:9.612.322.533.64.399.2]V6 TIR-NIR
Figure 8.Comparison of observed MOPITT only and TIR-NIR retrieval biases at 800 hPa at two Amazonian sites with ground-based measurements of aerosol optical depth at 500 nm from the AERONET network. Each plotted point indicates the mean PITT retrieval bias and daily-mean AOD for a single daytime MO-PITT overpass of one of the two AERONET sites. While there are relatively few data points at high AOD values, the plotted data do not indicate a clear AOD dependence for the retrieval bias for either type of MOPITT product.
4 Observed CO variability over the Amazon Basin Significant interannual variability in CO concentrations over the Amazon Basin primarily results from two sources: deforestation and understory fires. Annual deforestation rates in the “Legal Amazon” region estimated by Brazil’s PRODES (Program to Calculate Deforestation in the Ama-zon) satellite-based monitoring system (www.obt.inpe.br/ prodes/index.php) plummeted from 27 772 km2yr−1in 2004 to 4571 km2yr−1in 2012. Suggested causes of falling defor-estation rates in Brazil include (1) the expansion of protected areas in Brazil; (2) increased monitoring and law enforce-ment; and (3) market forces, including declining soy prices and economic disincentives for landholders implicated in de-forestation (Nepstad et al., 2009; Macedo et al., 2012). While much of the biomass burning activity in Amazonia relates directly to land use practices, human-initiated fires often es-cape from deforested areas into neighboring standing forests (Cochrane, 2003; Morton et al., 2013). These fires typically spread slowly in the forest understory, mainly consuming leaf litter, yet cause substantial long-term damage to the tropical forest ecosystem (Peres, 1999; Cochrane, 1999). Regionally, areas burned in understory fires may be comparable to or larger than clear-cut areas (Morton et al., 2013; Alencar et al., 2006; Aragão et al., 2007). Areas burned in understory fires are particularly extensive during droughts, indicating some degree of climate influence (Alencar et al., 2006).
The MOPITT data record enables the analysis of evolving CO concentrations over the Amazon Basin. In the follow-ing, we examine the CO record based on the MOPITT V6 TIR-NIR Level 3 monthly-mean product. MOPITT Level 3 products are gridded at 1◦resolution (latitude and longitude)
and are gridded separately for daytime and nighttime over-passes; the following analysis only exploits daytime Level 3 data. For analyzing CO variability over a relatively large re-gion and over multiple years, analyzing Level 3 monthly-mean products is much more efficient than for Level 2 data. MOPITT records of basin-averaged CO total column are an-alyzed in addition to retrieved CO concentrations at the sur-face and at 400 hPa. While no new validation results are pre-sented in this manuscript for 400 hPa, TIR-NIR averaging kernels for this level (shown in Figs. 2 and 3) demonstrate its usefulness as a retrieval of upper-tropospheric CO con-centrations with very weak sensitivity to CO in the lower troposphere.
In the following analysis, no attempt was made to correct the MOPITT data for retrieval bias or bias drift. For inter-preting the mean CO annual cycle, validation results pre-sented above imply that TIR-NIR long-term monthly means shown in Sect. 4.1 likely underestimate both true CO con-centrations at the surface and CO total column values. For the upper troposphere, the retrieval bias over the Amazon Basin is not well characterized, although HIPPO TIR-NIR validation results for the tropics indicate biases at 400 hPa be-tween−10 and 0 %. Temporally fixed retrieval biases would
Jan Feb Mar Apr May Jun Jul Aug Sep Oct Nov Dec 0
1•1018 2•1018 3•1018 4•1018
CO
total
column
(mol cm
)
-2
A Priori
Jan Feb Mar Apr May Jun Jul Aug Sep Oct Nov Dec 0
50 100 150
CO VMR @ 400 hPa (ppbv)
Jan Feb Mar Apr May Jun Jul Aug Sep Oct Nov Dec 0
100 200 300 400
[image:10.612.313.544.66.373.2]CO VMR @ surface (ppbv)
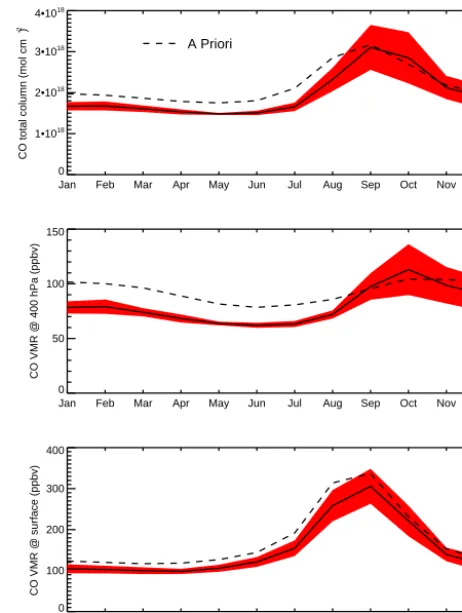
Figure 9.MOPITT TIR-NIR long-term monthly means of retrieved CO total column and CO concentrations for the Amazon Basin, based on observations from 2002 to 2015. Shaded red area indicates variability (standard deviation) of monthly means. Monthly-mean a priori values are also indicated for comparison.
not necessarily affect the interpretation of interannual vari-ability presented in Sect. 4.2, although the bias long-term trend (or “bias drift”) should be considered in that case. Previous TIR-NIR validation results based on CO vertical profiles measured over North America (Deeter et al., 2014) indicated a bias drift for the 400 hPa level of 1.08 % yr−1 and for the surface of−0.48 % yr−1 but only a very weak bias drift for CO total column (0.003×10¹⁸mol cm−2yr−1). However, the geographical variability of bias drift has not yet been investigated.
Exper-Jan Feb Mar Apr May Jun Jul Aug Sep Oct Nov Dec -2•1018
-1•1018 0 1•1018 2•1018
CO
total
column
anomaly
(mol cm
)
-2
2002 2003 2004
2005 2006 2007
2008 2010 2011
2012 2013 2014
2015
Jan Feb Mar Apr May Jun Jul Aug Sep Oct Nov Dec -60
-40 -20 0 20 40 60
CO 400 hPa VMR anomaly (ppbv)
Jan Feb Mar Apr May Jun Jul Aug Sep Oct Nov Dec -100
-50 0 50 100
[image:11.612.64.273.65.343.2]CO surface-level VMR anomaly (ppbv)
Figure 10. Monthly-mean anomalies of MOPITT TIR-NIR CO products for each of the years used to generate the long-term monthly means shown in Fig. 9.
iment in Amazonia” field campaign (https://daac.ornl.gov/ LBA/lba.shtml). Grid cells with no data (due to persistent cloudiness) were excluded from the long-term monthly-mean basin averages. Thus, during the Amazonian wet season from January to May, the presented monthly-mean basin averages may reflect CO concentrations only over some fraction of the entire Amazon Basin. Separate panels in Fig. 9 indi-cate MOPITT long-term monthly means for CO total col-umn, 400 hPa CO, and surface-level CO concentrations. The interannual variability (standard deviation) of the monthly means used to calculate the long-term monthly means is in-dicated by the red shaded area. Mean a priori values were also calculated from the Level 3 data files and are shown as dashed lines. V6 a priori CO concentrations are derived from a model-based climatology for the years 2000–2009, using the CAM-chem chemical transport model and GFED2 emis-sions.
In all three panels, long-term mean CO concentrations ap-pear generally stable from January to June. As the dry season develops, mean CO concentrations then increase along with the CO interannual variability (as indicated by the width of the red shaded area). At the surface, mean CO concentrations begin to increase in June, followed by a larger increase in July. Mean surface-level CO concentrations peak in Septem-ber, for which the long-term monthly mean is approximately 3 times the mean for the wet-season months. Mean CO
con-centrations at the surface follow the annual cycle indicated by the a priori but are generally smaller by 10–20 %. (This difference would be somewhat smaller if we accounted for the observed retrieval bias of−4.6 % found in Sect. 3.2.) At 400 hPa, increased CO concentrations are generally not ob-served until August, and mean concentrations peak in Oc-tober. The delayed peak in CO concentrations at 400 hPa (compared to the surface) likely reflects the characteristic time required for CO produced at the surface to ascend into the upper troposphere. Observed mean CO concentrations at 400 hPa exhibit a stronger annual cycle compared to the a pri-ori and are about 20 % smaller during the wet-season months.
4.2 Interannual variability
CO monthly anomalies for the Amazon Basin were calcu-lated by subtracting the long-term monthly means (shown in Fig. 9) from the monthly means for each individual year of MOPITT observations. The resulting anomaly time series for CO total column, CO VMR at 400 hPa, and surface-level VMR are shown in Fig. 10. Monthly-mean anomalies dur-ing the period from January to June exhibit little interannual variability for CO total column and at 400 hPa, but exhibit significant interannual variability for surface-level CO. How-ever, for this period, the apparent interannual variability at the surface is qualitatively consistent with the expected result of bias drift as described above; i.e., monthly-mean anoma-lies exhibit an overall decreasing trend. Thus, the apparent interannual variability of surface-level CO for the months be-tween January and June might not be significant.
5 Conclusions
Biomass burning emissions inventories such as GFED and FINN are widely used in modeling simulations, despite their large uncertainties. Satellite observations of CO might be useful for refining such inventories. This work demonstrates the utility of MOPITT products for analyzing CO emissions from the Amazon Basin. Comparisons of retrieval averag-ing kernels and values of degrees of freedom for signal for MOPITT TIR-only and TIR-NIR products indicate enhanced sensitivity to CO in the lower troposphere for the TIR-NIR product, particularly during the Amazonian dry season. Val-idation results based on routine sampling flights at four sites in the Amazon Basin exhibit a negative bias in MOPITT V6 retrievals of CO in the lower troposphere but do not in-dicate degraded performance in high-CO scenes. Likewise, comparisons with ground-based AOD measurements do not reveal retrieval biases associated with dense smoke from biomass burning. Over the MOPITT mission, observed long-term monthly-mean surface-level CO concentrations aver-aged over the Amazon Basin are generally similar to the CO climatology used as the retrieval a priori, whereas ob-served long-term mean CO concentrations at 400 hPa exhibit a much stronger annual cycle. A brief analysis of the his-tory of monthly-mean anomalies for the Amazon Basin indi-cates that the largest CO emissions occurred in years when drought-driven understory fires burned exceptionally large areas.
6 Data availability
MOPITT Version 6 Level 2 and Level 3 data used for this research are available at the NASA Atmospheric Sciences Data Center (ASDC) datapool at https://eosweb.larc.nasa. gov/datapool. MODIS Collection 5 fire count data were ob-tained from http://modis-fire.umd.edu.
Acknowledgements. The authors thank Brent Holben and the AERONET team for making the AERONET data publicly avail-able. The NCAR MOPITT project is supported by the National Aeronautics and Space Administration (NASA) Earth Observing System (EOS) program. The National Center for Atmospheric Re-search (NCAR) is sponsored by the National Science Foundation. We thank Louis Giglio for making the MODIS fire count data available.
Edited by: T. Röckmann
Reviewed by: two anonymous referees
References
Alencar, A., D. Nepstad, and M. Diaz: Forest Understory Fire in the Brazilian Amazon in ENSO and Non-ENSO Years: Area
Burned and Committed Carbon Emissions, Earth Interact., 10, 1–17, doi:10.1175/EI150.1, 2006.
Andreae, M. O. and P. Merlet: Emission of trace gases and aerosols from biomass burning, Global Biogeochem. Cy., 15, 955–966, doi:10.1029/2000GB001382, 2001.
Andreae, M. O., Artaxo, P., Beck, V., Bela, M., Freitas, S., Gerbig, C., Longo, K., Munger, J. W., Wiedemann, K. T., and Wofsy, S. C.: Carbon monoxide and related trace gases and aerosols over the Amazon Basin during the wet and dry seasons, Atmos. Chem. Phys., 12, 6041–6065, doi:10.5194/acp-12-6041-2012, 2012. Aragão, L. E. O. C. and Y. E. Shimabukuro: The incidence of fire
in Amazonian forests with implications for REDD, Science, 328, 1275–1278, doi:10.1126/science.1186925, 2010.
Aragão, L. E. O. C., Malhi, Y., Roman-Cuesta, R. M., Saatchi, S., Anderson, L. O., and Shimabukuro, Y. E.: Spatial patterns and fire response of recent Amazonian drought, Geophys. Res. Lett., 34, L07701, doi:10.1029/2006GL028946, 2007.
Arellano, A. F., Jr., Kasibhatla, P. S., Giglio, L., van der Werf, G. R., Randerson, J. T., and Collatz, G. J.: Time-dependent inversion es-timates of global biomass-burning CO emissions using Measure-ment of Pollution in the Troposphere (MOPITT) measureMeasure-ments, J. Geophys. Res., 111, D09303, doi:10.1029/2005JD006613, 2006.
Bloom, A. A., Worden, J., Jiang, Z., Worden, H., Kurosu, T., Frankenberg, C., and Schimel, D.: Remote-sensing constraints on South America fire traits by Bayesian fusion of atmo-spheric and surface data, Geophys. Res. Lett., 42, 1268–1274, doi:10.1002/2014GL062584, 2015.
Butz, A., Guerlet, S., Hasekamp, O., Schepers, D., Galli, A., Aben, I., Frankenberg, C., Hartmann, J.-M., Tran, H., Kuze, A., Keppel-Aleks, G., Toon, G., Wunch, D., Wennberg, P., Deutscher, N., Griffith, D., Macatangay, R., Messerschmidt, J.,
Notholt, J., and Warneke, T.: Toward accurate CO2 and CH4
observations from GOSAT, Geophys. Res. Lett., 38, L14812, doi:10.1029/2011GL047888, 2011.
Chevallier, F., R. J. Engelen, and P. Peylin: The contribution of AIRS data to the estimation of CO2 sources and sinks, Geophys. Res. Lett., 32, L23801, doi:10.1029/2005GL024229, 2005. Cochrane, M.: Fire science for rainforests, Nature, 421, 913–919,
doi:10.1038/nature01437, 2003.
Cochrane, M. A.: Positive Feedbacks in the Fire Dynamic of Closed Canopy Tropical Forests, Science, 284, 1832–1834, 1999. Deeter, M. N., Emmons, L. K., Francis, G. L., Edwards, D. P., Gille,
J. C., Warner, J. X., Khattatov, B., Ziskin, D., Lamarque, J.-F., Ho, S.-P., Yudin, Attié, J.-L., Packman, D., Chen, J., Mao, D., and Drummond, J. R.: Operational carbon monoxide retrieval al-gorithm and selected results for the MOPITT instrument, J. Geo-phys. Res., 108, 4399, doi:10.1029/2002JD003186, 2003. Deeter, M. N., Edwards, D. P., Gille, J. C., and Drummond,
J. R.: Sensitivity of MOPITT observations to carbon monox-ide in the lower troposphere, J. Geophys. Res., 112, D24306, doi:10.1029/2007JD008929, 2007.
Origins and effects of geophysical radiance errors, J. Geophys. Res., 116, D15303, doi:10.1029/2011JD015703, 2011.
Deeter, M. N., Martínez-Alonso, S., Edwards, D. P., Emmons, L. K., Gille, J. C., Worden, H. M., Pittman, J. V., Daube, B. C., and Wofsy, S. C.: Validation of MOPITT Version 5 thermal-infrared, near-thermal-infrared, and multispectral carbon monoxide pro-file retrievals for 2000–2011, J. Geophys. Res., 118, 6710–6725, doi:10.1002/jgrd.50272, 2013.
Deeter, M. N., Martínez-Alonso, S., Edwards, D. P., Emmons, L. K., Gille, J. C., Worden, H. M., Sweeney, C., Pittman, J. V., Daube, B. C., and Wofsy, S. C.: The MOPITT Version 6 product: al-gorithm enhancements and validation, Atmos. Meas. Tech., 7, 3623–3632, doi:10.5194/amt-7-3623-2014, 2014.
Deeter, M. N., Edwards, D. P., Gille, J. C., and Worden, H. M.: Information content of MOPITT CO profile retrievals: Tempo-ral and geographical variability. J. Geophys. Res., 120, 12723– 12738, doi:10.1002/2015JD024024, 2015.
Drummond, J., Zou, J., Nichitiu, F., Kar, J., Deschambaut, R., and Hackett, J.: A review of 9-year performance and opera-tion of the MOPITT instrument, Adv. Space Res., 45, 760–774, doi:10.1016/j.asr.2009.11.019, 2010.
Eck, T. F., Holben, B. N., Reid, J. S., Dubovik, O., Smirnov, A., O’Neill, N. T., Slutsker, I., and Kinne, S.: Wavelength depen-dence of the optical depth of biomass burning, urban, and desert dust aerosols, J. Geophys. Res., 104, 31333–31349, 2006. Edwards, D. P., C. M. Halvorson, and J. C. Gille: Radiative transfer
modeling for the EOS Terra satellite Measurements of Pollution in the Troposphere (MOPITT) instrument, J. Geophys. Res., 104, 16755–16775, 1999.
Edwards, D. P., Emmons, L. K., Gille, J. C., Chu, A., Attié, J.-L., Giglio, L., Wood, S. W., Haywood, J., Deeter, M. N., Massie, S. T., Ziskin, D. C., and Drummond, J. R.: Satellite-observed pol-lution from Southern Hemisphere biomass burning, J. Geophys. Res., 111, D14312, doi:10.1029/2005JD006655, 2006.
Emmons, L. K., Edwards, D. P., Deeter, M. N., Gille, J. C., Cam-pos, T., Nédélec, P., Novelli, P., and Sachse, G.: Measurements of Pollution In The Troposphere (MOPITT) validation through 2006, Atmos. Chem. Phys., 9, 1795–1803, doi:10.5194/acp-9-1795-2009, 2009.
Fortems-Cheiney, A., Chevallier, F., Pison, I., Bousquet, P., Szopa, S., Deeter, M. N., and Clerbaux, C.: Ten years of CO emissions as seen from Measurements of Pollution in the Troposphere MOPITT, J. Geophys. Res., 116, D05304, doi:10.1029/2010JD014416, 2011.
Gatti, L. V., Gloor, M., Miller, J. B., Doughty, C. E., Malhi, Y., Domingues, L. G., Basso, L. S., Martinewski, A., Correia, C. S. C., Borges, V. F., Freitas, S., Braz, R., Anderson, L. O., Rocha, H., Grace, J., Phillips, O. L., and Lloyd, J.: Drought sensitivity of Amazonian carbon balance revealed by atmospheric measure-ments, Nature, 506, 76–80, doi:10.1038/nature12957, 2014. Giglio, L., J. T. Randerson, and G. R. van der Werf: Analysis
of daily, monthly, and annual burned area using the fourth-generation global fire emissions database (GFED4), J. Geophys. Res.Biogeo., 118, 317–328, doi:10.1002/jgrg.20042, 2013. Gullison, R. E., Frumhoff, P. C., Canadell, J. G., Field, C. B.,
Nep-stad, D. C., Hayhoe, K., Avissar, R., Curran, L. M., Friedling-stein, P., Jones, C. D., and Nobre, C.: Tropical forests and climate policy, Science, 316, 985–986, doi:10.1126/science.1136163, 2007.
Holben, B. N., Tanré, D., Smirnov, A., Eck, T. F., Slutsker, I., Abuhassan, N., Newcomb, W. W., Schafer, J. S., Chatenet, B., Lavenu, F., Kaufman, Y. J., Vande Castle, J., Setzer, A., Markham, B., Clark, D., Frouin, R., Halthore, R., Karneli, A., O’Neill, N. T., Pietras, C., Pinker, R. T., Voss, K., and Zibordi, G.: An emerging ground-based aerosol climatology: Aerosol op-tical depth from AERONET, J. Geophys. Res., 106, 12067– 12097, doi:10.1029/2001JD900014, 2001.
Hooghiemstra, P. B., Krol, M. C., vanLeeuwen, T. T., van derWerf, G. R., Novelli, P. C., Deeter, M. N.,Aben, I., and Röckmann, T.: Interannual variability of carbon monoxide emission estimates over South America from 2006 to 2010, J. Geophys. Res., 117, D15308, doi:10.1029/2012JD017758, 2012.
Kopacz, M., Jacob, D. J., Fisher, J. A., Logan, J. A., Zhang, L., Megretskaia, I. A., Yantosca, R. M., Singh, K., Henze, D. K., Burrows, J. P., Buchwitz, M., Khlystova, I., McMillan, W. W., Gille, J. C., Edwards, D. P., Eldering, A., Thouret, V., and Nedelec, P.: Global estimates of CO sources with high resolu-tion by adjoint inversion of multiple satellite datasets (MOPITT, AIRS, SCIAMACHY, TES), Atmos. Chem. Phys., 10, 855–876, doi:10.5194/acp-10-855-2010, 2010.
Lamarque, J.-F., Emmons, L. K., Hess, P. G., Kinnison, D. E., Tilmes, S., Vitt, F., Heald, C. L., Holland, E. A., Lauritzen, P. H., Neu, J., Orlando, J. J., Rasch, P. J., and Tyndall, G. K.: CAM-chem: description and evaluation of interactive at-mospheric chemistry in the Community Earth System Model, Geosci. Model Dev., 5, 369–411, doi:10.5194/gmd-5-369-2012, 2012.
Lewis, S. L., Brando, P. M., Phillips, O. L., van der Heijden, G. M. F., and Nepstad, D.: The 2010 Amazon Drought, Science, 331, p. 554, 2011.
Macedo, M. N., DeFries, R. S., Morton, D. C., Stickler, C. M., Galford, G. L., and Shimabukuro, Y. E.: Decoupling of de-forestation and soy production in the southern Amazon dur-ing the late 2000s, P. Natl. Acad. Sci. USA, 109, 1341–1346, doi:10.1073/pnas.1111374109, 2012.
Malhi, Y., Roberts, J. T., Betts, R. A., Killeen, T. J., Li, W., and Nobre, C. A. : Climate Change, Deforestation, and the Fate of the Amazon, Science, 319, 169–172, doi:10.1126/science.1146961, 2008.
Miles, L. and V. Kapos: Reducing Greenhouse Gas Emissions from Deforestation and Forest Degradation: Global Land-Use Impli-cations, Science, 320, 1454–1455, 2008.
MODIS: MODIS Collection 5 fire count data, available at: http:// modis-fire.umd.edu, last access: August 2016.
Morton, D. C., Le Page, Y., DeFries, R., Collatz, G. J., and Hurtt, G. C.: Understorey fire frequency and the fate of burned forests in southern Amazonia, Philos. T. Roy. Soc. B, 368, doi:10.1098/rstb.2012.0163, 2013.
NASA Atmospheric Sciences Data Center: MOPITT Version 6 Level 2 and Level 3 data, available at: https://eosweb.larc.nasa. gov/datapool, last access: August 2016.
Pan, L., Gille, J. C., Edwards, D. P., Bailey, P. L., and Rodgers. C. D.: Retrieval of carbon monoxide for the MOPITT instrument, J. Geophys. Res., 103, 32277–32290, 1998.
Peres, C. A.: Ground fires as agents of mortality in a Central Ama-zonian forest, J. Trop. Ecol., 15, 535–541, 1999.
Ramanathan, V. and G. Carmichael: Global and regional cli-mate changes due to black carbon, Nat. Geosci., 1, 221–227, doi:10.1038/ngeo156, 2008.
Rodgers, C. D.: Inverse Methods for Atmospheric Sounding, The-ory and Practice, World Scientific, Singapore, 2000.
van der Werf, G. R., Randerson, J. T., Giglio, L., Collatz, G. J., Kasibhatla, P. S., and Arellano Jr., A. F.: Interannual variabil-ity in global biomass burning emissions from 1997 to 2004, At-mos. Chem. Phys., 6, 3423–3441, doi:10.5194/acp-6-3423-2006, 2006.
Wendisch, C., Pöschl, U., Andreae, M. O., Machado, L. A. T., Al-brecht, R., Schlager, H., Rosenfeld, D., Martin, S. T., Abdel-monem, A., Afchine, A., Araùjo, A., Artaxo, P., Aufmhoff, H., Barbosa, H. M. J., Borrmann, S., Braga, R., Buchholz, B., Cec-chini, M. A., Costa, A., Curtius, J., Dollner, M., Dorf, M., Dreil-ing, V., Ebert, V., Ehrlich, A., Ewald, F., Fisch, G., Fix, A., Frank, F., Fütterer, D., Heckl, C., Heidelberg, F., Hüneke, T., Jäkel, E., Järvinen, E., Jurkat, T., Kanter, S., Kästner, U., Kenntner, M., Kesselmeier, J., Klimach, T., Knecht, M., Kohl, R., Kölling, T., Krämer, M., Krüger, M., Krisna, T. C., Lavric, J. V., Longo, K., Mahnke, C., Manzi, A. O., Mayer, B., Mertes, S., Minikin, A., Molleker, S., Münch, S., Nillius, B., Pfeilsticker, K., Pöhlker, C., Roiger, A., Rose, D., Rosenow, D., Sauer, D., Schnaiter, M., Schneider, J.,Schulz, C., de Souza, R. A. F., Spanu, A., Stock, P., Vila, D., Voigt, C., Walser, A., Walter, D., Weigel, R., Weinzierl, B., Werner, F., Yamasoe, M. A., Ziereis, H., Zinner, T., and Zöger, M.: The ACRIDICON-CHUVA campaign: Studying trop-ical deep convective clouds and precipitation over Amazonia us-ing the new German research aircraft HALO, B. Am. Meteorol. Soc., doi:10.1175/BAMS-D-14-00255.1, 2016.
Wiedinmyer, C., Akagi, S. K., Yokelson, R. J., Emmons, L. K., Al-Saadi, J. A., Orlando, J. J., and Soja, A. J.: The Fire INventory from NCAR (FINN): a high resolution global model to estimate the emissions from open burning, Geosci. Model Dev., 4, 625– 641, doi:10.5194/gmd-4-625-2011, 2011.
Worden, H. M., Deeter, M. N., Edwards, D. P., Gille, J. C., Drum-mond, J. R., and Nédélec, P.: Observations of near-surface carbon monoxide from space using MOPITT multispectral retrievals, J. Geophys. Res., 115, D18314, doi:10.1029/2010JD014242, 2010. Worden, H. M., Edwards, D. P., Deeter, M. N., Fu, D., Kulawik, S. S., Worden, J. R., and Arellano, A.: Averaging kernel prediction from atmospheric and surface state parameters based on multi-ple regression for nadir-viewing satellite measurements of car-bon monoxide and ozone, Atmos. Meas. Tech., 6, 1633–1646, doi:10.5194/amt-6-1633-2013, 2013.
Worden, H. M., Deeter, M. N., Edwards, D. P., Gille, J., Drummond, J., Emmons, L. K., Francis, G., Martínez-Alonso, S.: 13 years of MOPITT operations: lessons from MOPITT retrieval algorithm development, Ann. Geophys., 56, doi:10.4401/ag-6330, 2014. Yoshida, Y., Kikuchi, N., Morino, I., Uchino, O., Oshchepkov, S.,
Bril, A., Saeki, T., Schutgens, N., Toon, G. C., Wunch, D., Roehl, C. M., Wennberg, P. O., Griffith, D. W. T., Deutscher, N. M., Warneke, T., Notholt, J., Robinson, J., Sherlock, V., Connor, B., Rettinger, M., Sussmann, R., Ahonen, P., Heikkinen, P., Kyrö, E., Mendonca, J., Strong, K., Hase, F., Dohe, S., and Yokota, T.: Improvement of the retrieval algorithm for GOSAT SWIR
XCO2and XCH4and their validation using TCCON data,