D
DA
FORM
Mrs. G As A (AccredDEVELO
APOXETI
M BY UV
METH
The Ta In part G. ABIRAM ssistant Pro Dep ADHIPAR dited By ’’ NM
OPEMEN
INE IN P
V-VISIB
HODS A
Disser amil Nadu Ch tial fulfillm MAST (Pharm R. V Reg Und I, M. Pharm ofessor partment o RASAKTH AAC’’ with MELMARNT AND
PURE A
BLE SPEC
AND HP
rtation Sub Dr. M.G.Rhennai - 60
ment for the TER OF PH
maceutical Submitted
VELMURU gister No. 26
er the Guid m., Mr. K
of Pharmac
HI COLL a CGPA OF RUVATH MAY 20
D VALID
AND SOL
CTROPH
PTLC ME
bmitted to R. Medical U00 032.
e award of ARMACY Analysis) d by UGAN 6106131 dance of K. ANANDA Associat ceutical A
LEGE OF P F 2.74 on a fo HUR - 603
CERTIFICATE
This is to certify that the research work entitled “DEVELOPEMENT AND
VALIDATION OF DAPOXETINE IN PURE AND SOLID DOSAGE FORM
BY UV-VISIBLE SPECTROPHOTOMETRIC METHODS AND HPTLC”
submitted to The Tamil Nadu Dr. M.G.R. Medical University in partial fulfillment for
the award of the Degree of the MASTER OF PHARMACY (Pharmaceutical
Analysis) was carried out by R.VELMURUGAN (Register No. 26106131) in the
Department of Pharmaceutical Analysis under our direct guidance and supervision
during the academic year 2011-2012.
Mrs. G. ABIRAMI, M. Pharm., Mr. K. ANANDAKUMAR, M. Pharm.,
Assistant Professor, Associate Professor,
Adhiparasakthi College of Pharmacy, Adhiparasakthi College of Pharmacy,
CERTIFICATE
This is to certify that the dissertation entitled “DEVELOPEMENT AND
VALIDATION OF DAPOXETINE IN PURE AND SOLID DOSAGE FORM BY
UV-VISIBLE SPECTROPHOTOMETRIC METHODS AND HPTLC MEYHOD”
is the bonafide research work carried out by R.VELMURUGAN
(Register No. 26106131) in the Department of Pharmaceutical Analysis, Adhiparasakthi College of Pharmacy, Melmaruvathur which is affiliated to The Tamil Nadu Dr. M.G.R.
Medical University under the guidance of Mr. K. ANANDAKUMAR, M. Pharm., and
Mrs. G. ABIRAMI, M.Pharm.,Department of Pharmaceutical Analysis, Adhiparasakthi
College of Pharmacy, during the academic year 2011-2012.
Place: Melmaruvathur Prof. (Dr.) T. VETRICHELVAN, M. Pharm., Ph.D., Date: Principal & Head of Pharmaceutical Analysis,
Department of Pharmaceutical Analysis, Adhiparasakthi College of Pharmacy, Melmaruvathur - 603319.
ACKNOWLEDGEMENT
I honestly acknowledge HIS HOLINESS ARULTHIRU AMMA and
THIRUMATHI AMMA for their sacred blessings to perform and complete my project.
My heartful thanks to Mr. G. B. ANBALAGAN, M.D., Managing Director, MAPIMS, Melmaruvathur for providing all the necessary facilities to carry out this works.
I got inward bound and brainwave to endure experimental investigations in model analytical methods, to this extent, I concede my in most special gratitude and thanks to
Mr. K. ANANDAKUMAR, M. Pharm., Associate Professor and
Mrs. G. ABIRAMI, M. Pharm., Assistant Professor, Department of Pharmaceutical Analysis, Adhiparasakthi College of Pharmacy, for the active guidance, innovative ideas, creative works, infinite helps, indulgent and enthusiastic guidance, valuable suggestions, a source of inspiration where the real treasure of my work.
I owe my sincere thanks with bounteous pleasure to
Prof. (Dr.) T.VETRICHELVAN, M. Pharm., Ph.D., Principal, Adhiparasakthi College of Pharmacy, without his encouragement and supervision it would have been absolutely impossible to bring out the work in this manner.
I conceitedly take the dispensation to present my special wisdom of thanks to Mrs. D. NAGAVALLI, M. Pharm., Associate Professor, Department of Pharmaceutical Analysisfor their persuasive support and timely lend a hand to complete this work.
DEDICATED TO
MY
PARENTS, SISTERS
It’s the precise time for me to convey my profundity thanks to my classmatesfor their support and suggestions during my work.
A special word of thanks to my other Lovable Friends and my Juniors for their timely help during the course of my work.
I am greatly obliged to my mother Mrs. R. MAHALAKSHMI, my father
Mr. V. RAJU, my lovable sister Mrs. R. UMAMAHESWARI AND R. NAGAMANI for their inspiration, guidance, moral support, constant prayers for my successful endeavours.
Above all I dedicate myself and my work to Almighty,
who is the source of knowledge and for showering all his blessings and grace upon me.
R. VELMURUGAN
DEDICATED TO
MY
PARENTS, SISTERS
CONTENTS
SECTION TITLE Page No.
1. INTRODUCTION 1 - 46
1.1 Analytical Chemistry 1
1.2 UV – Spectrophotometric method 10
1.3 Area under curve method 25
1.4 Derivative Spectrophotometric method 26
1.5 Visible Spectrophotometric method 29
1.6 High Performance Thin Layer Chromatography 31
1.7 Validation of Analytical method 35
1.8 Pharmaceutical Statistics 43
2. REVIEW OF LITERATURE 47-51
2.1 Drug profile 47
2.2 Reported methods 52
3. AIM AND PLAN OF WORK 53 - 54
4. MATERIALS AND METHODS 55 - 80
4.1 Materials 55
4.2 Methods 62
4.2.1 UV – Spectrophotometric method 63
4.2.2 Area under curve method 66
4.2.3 Derivative Spectrophotometric method 69
4.2.4 Visible Spectrophotometric method 73
4.2.5 High Performance Thin Layer Chromatography 78
5. RESULTS AND DISCUSSION 81 - 95
5.1 UV – Spectrophotometric method 82
5.2 Area under curve method 85
5.3 Derivative Spectrophotometric method 88
5.4 Visible Spectrophotometric method 91
5.5 High Performance Thin Layer Chromatography 94
6. SUMMARY AND CONCLUSION 96 – 100
6.1 UV – Spectrophotometric method 96
6.2 Area under curve method 97
6.3 Derivative Spectrophotometric method 98
6.4 Visible Spectrophotometric method 98
6.5 High Performance Thin Layer Chromatography 99
LIST OF FIGURES
FIGURE
NO. CONTENTS
1. IR SPECTRUM OF DAPOXETINE
2. UV SPECTRUM OF DAPOXETINE IN DISTILLED WATER
3. AREA UNDER CURVE SPECTRUM OF DAPOXETINE IN DISTILLED WATER
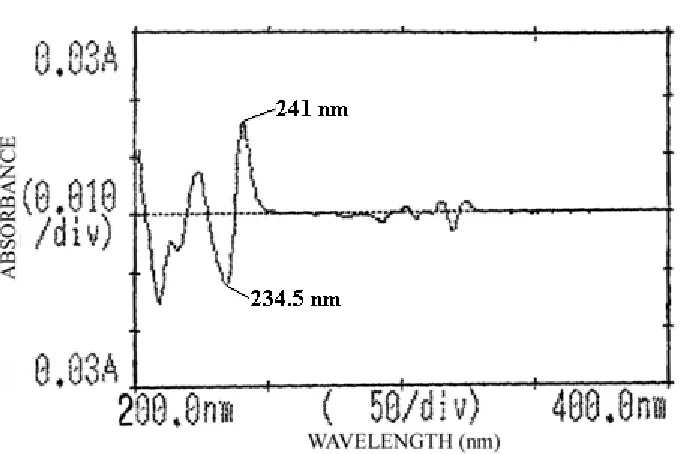
4. DERIVATIVE SPECTRUM OF DAPOXETINE IN DISTILLED WATER
5. VISIBLE SPECTRUM OF DAPOXETINE IN DISTILLED WATER USING MBTH REAGENT
6.
CALIBRATION CURVE OF DAPOXETINE BY UV
SPECTROPHOTOMETRIC METHOD USING DISTILLED WATER AT 292 nm
7.
CALIBRATION CURVE OF DAPOXETINE BY AREA UNDER CURVE METHOD USING DISTILLED WATER AT 281.5 AND 295.5
nm
8.
CALIBRATION CURVE OF DAPOXETINE BY DERIVATIVE SPECTROPHOTOMETRIC METHOD USING DISTILLED WATER
AT 234.5 AND 241.0 nm
9.
CALIBRATION CURVE OF DAPOXETINE BY VISIBLE SPECTROPHOTOMETRIC METHOD USING MBTH REAGENT AT
437 nm
10. UV SPECTRA OF DAPOXETINE IN MOBILE PHASE ACETONITRILE : ETHYL ACETATE (9:1 V/V)
11. SPECTRAL CONFIRMATION OF STANDARD DAPOXETINE WITH FORMULATION
13. LINEARITY CHROMATOGRAM OF DAPOXETINE BY HPTLC METHOD (2 µg/mL)
14. LINEARITY CHROMATOGRAM OF DAPOXETINE BY HPTLC METHOD (3 µg/mL)
15. LINEARITY CHROMATOGRAM OF DAPOXETINE BY HPTLC METHOD (4 µg/mL)
16. LINEARITY CHROMATOGRAM OF DAPOXETINE BY HPTLC METHOD (5 µg/mL)
17. LINEARITY CHROMATOGRAM OF DAPOXETINE BY HPTLC METHOD (6 µg/mL)
18. CALIBRATION CURVE OF DAPOXETINE BY HPTLC METHOD AT 437 nm
19. CHROMATOGRAM OF ANALYSIS OF FORMULATION (PRILIYXET 30)
20. CHROMATOGRAM OF RECOVERY OF FORMULATION (PRILIYXET 30)
LIST OF TABLES
Table
No. CONTENTS
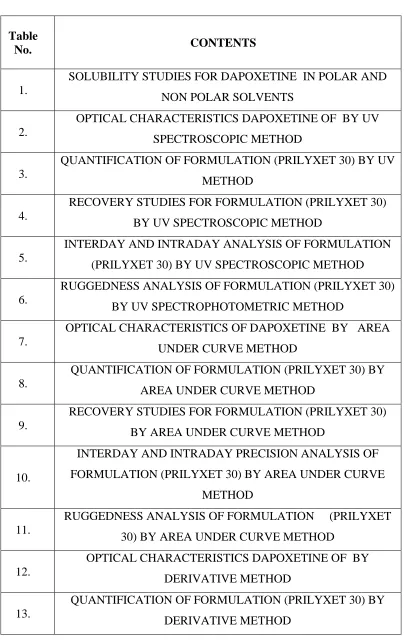
1.
SOLUBILITY STUDIES FOR DAPOXETINE IN POLAR AND NON POLAR SOLVENTS
2.
OPTICAL CHARACTERISTICS DAPOXETINE OF BY UV SPECTROSCOPIC METHOD
3.
QUANTIFICATION OF FORMULATION (PRILYXET 30) BY UV METHOD
4.
RECOVERY STUDIES FOR FORMULATION (PRILYXET 30) BY UV SPECTROSCOPIC METHOD
5.
INTERDAY AND INTRADAY ANALYSIS OF FORMULATION (PRILYXET 30) BY UV SPECTROSCOPIC METHOD
6.
RUGGEDNESS ANALYSIS OF FORMULATION (PRILYXET 30) BY UV SPECTROPHOTOMETRIC METHOD
7.
OPTICAL CHARACTERISTICS OF DAPOXETINE BY AREA UNDER CURVE METHOD
8.
QUANTIFICATION OF FORMULATION (PRILYXET 30) BY AREA UNDER CURVE METHOD
9.
RECOVERY STUDIES FOR FORMULATION (PRILYXET 30) BY AREA UNDER CURVE METHOD
10.
INTERDAY AND INTRADAY PRECISION ANALYSIS OF FORMULATION (PRILYXET 30) BY AREA UNDER CURVE
METHOD
11.
RUGGEDNESS ANALYSIS OF FORMULATION (PRILYXET 30) BY AREA UNDER CURVE METHOD
12.
OPTICAL CHARACTERISTICS DAPOXETINE OF BY DERIVATIVE METHOD
13.
[image:11.612.123.532.84.727.2]14. RECOVERY STUDIES FOR FORMULATION (PRILYXET 30) BY DERIVATIVE METHOD
15.
INTERDAY AND INTRADAY ANALYSIS OF FORMULATION (PRILYXET 30) BY DERIVATIVE METHOD
16.
RUGGEDNESS ANALYSIS OF FORMULATION (PRILYXET 30) BY DERIVATIVE METHOD
17.
OPTICAL CHARACTERISTICS DAPOXETINE OF BY VISIBLE SPECTROPHOTOMETRIC METHOD
18.
QUANTIFICATION OF FORMULATION (PRILYXET 30) BY VISIBLE SPECTROPHOTOMETRIC METHOD
19.
RECOVERY STUDIES FOR FORMULATION (PRILYXET 30) BY VISIBLE SPECTROPHOTOMETRIC METHOD
20.
INTERDAY AND INTRADAY ANALYSIS OF FORMULATION (PRILYXET 30) BY VISIBLE SPECTROPHOTOMETRIC
METHOD
21.
RUGGEDNESS ANALYSIS OF FORMULATION (PRILYXET 30) BY VISIBLE SPECTROPHOTOMETRIC METHOD
22.
OPTICAL CHARACTERISTICS DAPOXETINE OF BY HPTLC METHOD
23.
QUANTIFICATION OF FORMULATION (PRILYXET 30) BY HPTLC METHOD
24.
RECOVERY STUDIES FOR FORMULATION (PRILYXET 30) BY HPTLC METHOD
25.
INTERDAY AND INTRADAY ANALYSIS OF FORMULATION (PRILYXET 30) BY HPTLC METHOD
LIST OF ABBREVIATIONS USED
ICH - International Conference on Harmonization
λ - Lambda
LOD - Limit of Detection
LOQ - Limit of Quantification
μg/ ml - Microgram per Milliliter
mg/ tab - Milligram per tablet
ml - Millilitre
mM - Milli Mole
nm - Nanometer
pH - Negative Logarithm of Hydrogen Ion
% - Percentage
% R.S.D - Percentage Relative Standard Deviation
S.D - Standard Deviation
S.E. - Standard Error
UV - Ultraviolet
HPTLC - High Performance Thin Layer Chromatography
AUC - Area under Curve
°C - Degree Celsius
Gms - Grams
μl - Microlitre
rpm - Rotations per Minute
v/ v - Volume/Volume
IR - Infra Red
USP - United States of Pharmacopoeia
MBTH - 3-Methylbenzthiazolinone-2(3H)-Hydrazone
1. INTRODUCTION
1.1 ANALYTICAL CHEMISTRY (Gary.D.Christian, 2007)
Analytical chemistry is the science that seeks ever improved means of measuring
the chemical composition of natural and artificial materials. Analytical chemistry is a sub
discipline of chemistry has the broad mission of understanding the chemical composition
of all matter and developing the tools to elucidate composition of new compounds.
Types
Traditionally, analytical chemistry split into two types, Quantitative and
Qualitative
Quantitative and Qualitative
Quantitative analysis seeks to establish the amount of a given element or
compound in a sample. Qualitative analysis seeks to establish the presence of a given
element, given functional group or inorganic or organic compound in a sample
CHEMICAL ANALYSIS CLASSIFIED AS (Skoog, 2005)
1. Clinical analysis
2. Industrial analysis
3. Bio chemical analysis
4. Cosmetic analysis
5. Medicinal analysis
MOLECULAR ANALYSIS CLASSIFIED AS (Chatwal, 2006)
1. Nuclear magnetic resonance
2. Intra red spectra copy
3. Ultra violet absorption
4. Ultra violet fluorescence
5. Spectrophotometric analysis
6. X-ray diffraction
7. X-ray absorption
8. Radio tracer techniques
9. Mass spectrometry
10. Thermal analysis
11. Gas chromatography
12. Liquid chromatography
13.Electron microscopy
MORDEN ANALYTICAL CHEMISTRY (Kausture, 2007)
• Involves usage of microprocessor, computers, amplifiers and integrated circuits to
make the process.
• The branches of atomic spectroscopy including optical absorption, optical, emission
and optical fluorescence, spectrometry, atomic mass spectrometry and atomic x-ray
spectrometry.
• The branches of atomic spectroscopy including optical absorption, optical emission,
and optical fluorescence spectrometry, atomic mass spectrometry, and atomic x-ray
• In the field of analysis the most important this impossible makes new idea in the
pharmaceutical development.
• The accuracy of the calculating value by the most of instrument high qualified like
chromatogram, in microgram.
• The tools we need in analytical chemistry to answering the basic knowledge for the
type of question.
METHOD DEVELOPMENT
Analytical methods Development and Validation plays an important role in
the discovery, development, and Manufacture of Pharmaceuticals
Pharmaceutical products formulated with more than one drug, typically referred
to as combination products, are intended to meet previously unmet patients need by
combining the therapeutic effects of two or more drugs in one product. These
combination products can present daunting challenges to the analytical chemist
responsible for the development and Validation of Analytical methods. This presentation
will discuss the development and Validation of Analytical method (Spectrophotometric &
High performance thin layer chromatography for drug products containing more than one
active ingredient. The official test methods that result from these processes are used by
quality control laboratories to ensure the identity, purity, potency, and performance of
drug products.
SELECTION OF ANALYTICAL TECHNIQUES (mendham J et al., 2002)
1. Proximate analysis : Determines the amount of each element in a sample.
3. Trace constituents analysis : Determines specified components present in very
minute quantity.
4. Complete analysis : Determine the portion of each component in the sample.
PHASES IN ANALYTICAL CHEMISTRY (Gary, 2007)
Phase 1: Fast screening phase eg : Immuno assay, gas chromatography and liquid
chromatography.
Phase 2 : Identification phase eg : GC – MS.
Phase 3 : Qualification phase eg : Spectrophotometer and gas chromatography.
IMPORTANT CONSIDERATIONS IN ANALYTICAL METHODS
(Willard, 1986)
The instrument most visible and exciting element of the analytical method, only
one component of the total analysis.
• The analyst should determine the nature of the sample, the end use of the
analytical results, the species to be analyzed.
• Quantitative information may include elemental composition, oxidation state,
functional groups, major components, minor components, complete identification
in the given sample.
• Quantitative data include accuracy and precision, range of expected analyte.
• Methods such as controlling the atmosphere to which the sample is exposed,
SENSITIVITY AND DETECTION LIMITS (Y.R. Sharma, 2009)
TECHNIQUES DETECTION LIMITS IDENTIFICATION LIMITS Gas chromatography Infrared spectrophotometry Ultraviolet spectroscopy N.M.R(time averaged) Mass spectrometry (batch inlet) Mass spectrometry (direct probe )
10-6-1012 10-7 10-7 10-7 10-6 10-12 - 10-6 10-6 10-5 10-5 10-11
FACTORS AFFECTING THE ANALYTICAL METHOD
(mendham J et al., 2002)
• Problems arising from the nature of the material to be investigate (eg) radioactive
substance affected by water.
• Possible interference from components of the material other than those of interest.
• The concentration range to be investigated.
• The accuracy required.
• The facilities available, particularly the instruments.
PHYSICAL PROPERTIES USED IN ANALYTICAL CHEMISTRY (Skoog, 2005)
S. No
Physical Property
Measured
Instrumental methods based on measurement of
property
1. Absorbtion of radiation Spectrophotometry
2. Emission of radiation
Emission spectroscopy, flame photometry, radio
chemical method.
3. Scattering of radiation Turbidometry, nephelometry
4. Refraction of radiation Refractometry, interfero
5. Diffraction of radiation X-ray, electron diffraction
6. Rotation of radiation Polarimetry, optical rotatory dispersion.
7. Electrical potential Potentiometry
8. Electrical conductance Conductivity
9. Quantity of electricity Coulometer
10. Mass-to-charge ratio Mass spectroscopy
11. Electrical current Polargraphy
12. Thermal properties Thermal conductivity
STAGES IN CHEMICAL ANALYSIS (mendham J et al., 2002)
Evaluation of the satisfactory results
The nature of the physical and chemical system may difficult in analytical
chemist. Example, all over the chemist can provide problem of dissolution and separation
amino acids. He may also be asked to analyse polluted air or the insecticides in fish,
birds, plants or animal to measure the rate of reaction, or to determine the number of
electrons and intermediates involved in an electro chemical reaction
Basic criteria for new method development of drug analysis:
• The drug or drug combination may not be official in any Pharmacopoeias
• A proper analytical procedure for the drug may not be available in the literature
due to patent regulations
• Analytical methods may not be available for the drug in the form of a formulation
due to the interference caused by the formulation excipients
• Analytical methods for the quantization of the drug in biological fluids may not
be available
• Analytical methods for a drug in combination with other drugs may not be
available
• The existing analytical procedures may require expensive reagents and solvents. It
may also involve cumbersome extraction and separation procedures and these may not be
SPECTROSCOPY (Sharma Y.R, 2009)
Spectrophotometry is based upon the measurement and interpretation of
electromagnetic radiation absorbed, when the molecules or atoms or ions of a sample
due to electronic transition within the molecule. Every atom, ion or molecule has a
unique characteristic relation with electromagnetic radiation
Introduction to Spectrophotometric Methods of Analysis for Drugs in Combination
Simultaneous estimation of drug combination is generally done by separation
using chromatographic methods like HPLC, GC etc. These methods are accurate and
precise with good reproducibility, but the cost of analysis is quite high owing to
expensive instrumentation, reagent and expertise. Hence it is worthwhile to develop
simpler and cost effective method for simultaneous estimation of drugs for routine
analysis of formulation. Spectrophotometric analysis fulfils such requirement where the
simultaneous estimation of the drug combination can be done with similar effectiveness
as that of chromatographic methods.
The spectrophotometric assay of drugs rarely involves the measurement of
absorbance of samples containing only one absorbing component. The pharmaceutical
analyst frequently encounters the situation where the concentration of one or more
substances is required in samples known to contain other absorbing substances, which
potentially interfere in the assay. If the formula of the samples is known, the identity and
concentration of the interfering substance are known and the extent of interference in the
assay may be determined.
The basis of all the spectrophotometric techniques for multicomponent samples is
• The absorbance of a solution is the sum of absorbance of the individual
components
• The measured absorbance is the difference between the total absorbance of the
solution in the sample cell and that of the solution in the reference cell
• There are various spectrophotometric methods are available which can be used for
the analysis of a combination samples. Following methods can be used Simultaneous
equation method
• Derivative spectrophotometric method
• Absorbance ratio method ( Q-Absorbance method)
• Difference Spectrophotometry
• Solvent extraction method
1.2 ULTRAVIOLET SPECTROSCOPY
INTRODUCTION (Kalsi, 2007; Y.R.Sharma, 2009)
Ultraviolet spectroscopy deals with the measurement of energy absorbed when
electrons are promoted to higher energy levels. On passing electromagnetic radiation in
the ultraviolet and visible regions through a compound with multiple bonds, a portion of
the radiation is normally absorbed by the compound. The amount of absorption depends
on the wavelength of the radiation and the structure of the compound. Absorption of
electromagnetic radiation in the visible and ultraviolet regions of the spectrum resulting
in changes in the electronic structure of ions and molecules.
Ultraviolet spectrum records the wavelength of an absorption maximum, i.e.
λmax and the strength of the absorption, i.e. molar absorptivity (extinction co-efficient
Σmax) as defined by the combined Beer-Lambert law.
The ultraviolet spectrum will be divided into the following region.
1.Far (or vacuum) ultra violet Æ 10 – 200 nm
2.Near or quartz ultraviolet Æ 200 – 380 nm
3.Visible region Æ 380 – 780 nm
INSTRUMENTAL MODULES FOR MEASURING ABSORPTION OF UV
RADIATION (Willard, 1986)
ABSORPTION SPECTROSCOPY DEPENDS UPON THE FOLLOWING
PARAMETERS (A.H.Beckett, and J.B.Stenlake, 2007; Douglas, 2005;
Willard, et.al., 1986)
1) TRANSMITTANCE (T)
It is the ratio of intensity of transmitted light to that of incident light
T = It / Io
2) ABSORBANCE (A)
It is negative logarithm of transmittance to the base 10
A= -log 10 = log 10 Io/ It
A= abc
3) MOLAR ABSORPTIVITY ( ε )
When concentration ‘’c’’in equation A=abc is expressed in mole/lit and cell
length in
Sample
Radiant
source Solvent
Photo
detector Wavelength
selector
‘’cm ‘’ then absorptivity is called as molar absorptivity.
ε =A/bc
4) BEER –LAMBER’S LAW (Jagmohan, 2006)
It can be stated as the intensity of beam of monochromatic light. When passed
through transparent medium decreases exponentially as the thickness and concentration
of absorbing media increases arithmetically.
Log10
⎟
=
∑
=
⎠
⎞
⎜
⎝
⎛
A
cl
I
I
0Where, Io - Intensity of incident light
I - Intensity of emerged light
Σ - Molar absorptivity
c - Concentration of solute in moles/litre
l - Path length (Cm)
A - Absorbance
LIMITATIONS OF BEER-LAMBERT’S LAW
The Beer-Lambert law is rigorously obsessed provided a single species gives
rise to the observed absorption. However the law may not obsessed when,
i) Different forms of the absorbing molecules are in equilibrium.
ii) Solute and solvent from association complexes.
iii) There is a thermal equilibrium between ground electronic state
iv) The compounds are charged by irradiation (fluorescent
compounds).
DEVIATIONS FROM BEER’S LAW (B.K.Sharma, 2007)
According to Beer’s law, a straight line passing through the origin should be
obtained, when a graph is plotted between absorbance (A) and concentration. Deviation
from the law may be positive or negative, according to whether the resulting curve is
concave upwards or concave downwards as shown in the following figure.
The deviations from the Beer’s law may be due to interaction of the solute molecules
with each other or with the solvent or may be due to instrumental factors.
The most important reasons that cause deviations are
1. Negative deviation can always be expected when the illumination is not
monochromatic.
2. The presence of impurities that fluoresces or absorb at the required absorption
wavelength.
4. Chemical factors such as change in pH and chemical equilibrium, presence of
complexing agent, competitive metal ion reactions and concentration
dependence.
5. Refractive index of sample.
6. Instrumental errors such as radiation, stability of radiation source, stability of
slit control and electronics and reliability of the optical parts.
IMPORTANT CHARACTERSTICS OF SPECTROPHOTOMETRIC AND
PHOTOMETRIC METHODS INCLUDE
• Wide applicability to both organic and inorganic systems.
• Typical sensitivities of 10 -4 to 10-5
• Moderate to high selectivity.
• Good accuracy.
• Ease and convenience of data acquisition.
CHOICE OF SOLVENT (Jagmohan, 2006)
• The solvent used should be of high purity, generally referred to as spectro grade
• Care should be taken to keep lint and dust from contaminating the final
solutions
• A good solvent should be transparent over the desired range of wavelengths
• Another factor pertains to the fine structure of an absorption band depends on
the polarity of the solvent
SOLVENT EFFECTS (William Kemp, 1996)
The position and intensity of an absorption band may shift when the spectrum is
recorded in different solvents. For changes to solvents of increased polarity we can
summarize the normal pattern of shifts as follows.
1. Conjugated dienes and aromatic hydrocarbons experience very little solvent
shift.
2. α,β unsaturated carbonyl compounds show two different shifts.
i) The π - π* bond moves to longer wave length (red shift)
ii) The n- π* bond moves to shorter wavelength (blue shift)
FOLLOWING TABLE GIVES A LIST OF COMMON SOLVENTS USED IN UV
SPECTROSCOPY (Jagmohan 2006)
S.NO SOLVENT CUT-OFF WAVELENGTH
(λ max nm) 1. 2. 3. 4. 5. 6. 7. 8. 9. 10. 11. 12. Acetonitrile Acetone Benzene Benzonitrile Chloroform
13. 14. 15. 16. 17. 18. 19. 20. Iso -octane Methanol n- butanol
N-N dimethyl formamide Nitro methane Pyridine Water Xylene 210 215 210 270 380 305 210 295
WAVELENGTH CHOICE (Robert D Braun, 2006)
When choosing a wavelength at which to make an absorbance measurement,
three factors must be considered.
Factor 1
If the solution contains more than one absorbing species, the wavelength that
should be chosen, whenever possible, is that at which the second species in the solution
does not absorb radiation.
Factor 2
It must be considered when a wave length is chosen is the required sensitive of
the assay.
Factor 3
This factor to be considered is the sensitive of the assay to small changes in
wave length it is preferable to choose a wavelength at which the absorbance will not be
DETECTORS (B.K. Sharma, 2007; Willard, 1986)
A detector is a transducer that convert electromagnetic radiation into an electron flow
and subsequently, into a current flow or voltage in the readout circuit. Photoelectric or
photo multiplier tubes are generally used as detectors.
The detector must have the following important requirements.
a) It must respond to radiant energy over a broad wavelength range.
b) It should be sensitive to low levels of radiant power.
c) It should rapidly respond to the radiation and produce an electrical signal that can
be readily amplified.
d) It should have relatively low noise level (for stability).
e) The signal produced is directly proportional to the power of beam striking it.
QUALITATIVE ANALYSIS (A.H.Beckett, and J.B.Stenlake, 2007)
The assay of an absorbing substance may be quickly carried out by preparing a
solution in a transparent solvent and measuring its absorbance at a suitable wavelength.
The wavelength normally selected is a wavelength of maximum absorption (λmax)
where small errors in setting the wavelength scale have little effects on the measured
absorbance.
QUANTITATIVE ANALYSIS
Absorption spectroscopy is one of the most useful tools to access for the
quantitative analysis, the most important characteristics of photometric and
spectrophotometric methods are high selectivity and ease of convenience. Quantitative
1. Use of A (1%, 1cm) values.
2. Use of calibration graph (multiple standard methods).
3. By single or double point standardization method.
USE OF A (1%, 1CM) VALUES
This method can be used for the estimation from formulation or raw material
when reference standard not available. The use of standard A (1%, 1cm) value avoids
the need to prepare a standard solution of the reference substance in order to determine
its absorption.
USE OF CALIBRATION GRAPH
In this method absorbance of a number of standard solutions of reference
substance at concentrations encompassing sample concentrations are measured, and a
calibration graph is constructed. The concentration of analyte in the sample solution
read from the graph as concentration corresponding absorbance of the solution.
Calibration data is essential if absorbance has nonlinear relationship with concentration
if the absorbance values and concentrations bear a linear relationship the regression line
then,
Y= α + βx may be calculated by method of least squares.
Intercept (α) = (Σ y) (Σx2) – (Σ x) (Σ x y)
N Σ x2 – (Σ x) 2
Slope (β) = N Σ x y – (Σ x) (Σ y)
Where,
y = Absorbance value at concentration x.
N = Number of pairs of values.
The data may be further evaluated statistically to confirm a linear relationship
between x and y and provides confidence limits for the slope intercept and estimated
concentration of sample.
SINGLE OR DOUBLE POINT STANDARDIZATION
The procedure involves the measurement of the absorbance of a sample solution
and of a standard of the reference substance. The standard and the sample solution are
prepared in similar manner; ideally the concentration of the standard solution should be
close to that of the sample solution. The concentration of the substance in the sample is
calculated using following formulas
Ctest = Atest / Astd × Cstd
Where,
Ctest and Cstd are the concentration of the sample and standard solutions,
respectively.
Atest and Astd are the absorbance of the sample and standard solutions,
respectively.
In double point standardization, the concentration of one of the standard
solutions is greater than that of the sample while the other standard solution has a lower
concentration than the sample solution. The concentration of the substance in the
(A test – A std1) (C std1-C std2) +C std1 (Astd1-Astd2)
C test = A std1-A std2
Where,
Cstd is the concentration of the standard solution.
Atest and Astd are the absorbance of the sample and standard solutions,
respectively. Std 1 and std 2 are the more concentrated standard and less concentrated
standard solutions, respectively.
VALIDATION OF ANALYTICAL PARAMETERS IN PHARMACEUTICAL
ANALYSIS BY UV SPECTROPHOTOMETRY
1. SENSITIVITY
Knowledge of the sensitivity of the reaction is important and three methods are
commonly employed for expressing sensitivity.
Sandell’s sensitivity
Number of micrograms of drug converted into the colored product is determined;
which in a column solution of cm2/cross-section shows an absorbance of 0.001 or 0.005
(expressed as µg of drug/cm2).
Molar extinction co- efficient (∈)
It is calculated from the equation
∈ = A/IC
Where,
C = Concentration of colored species (Mole/Iit)
I = light path length (cm)
Ringbom plots
Optimum photometric ranges are calculated from the linear portion of the
Ringbom plot between Percent transmission Vs Logarithm of the concentration of the
drug (expressed as µg/ml).
Knowledge of the above mentioned method is necessary, for comparing the sensitivity of
the proposed and reported methods to each drug.
2. CORRELATION COEFFICIENT(r)
When the changes in one variable are associated or followed by changes in the
other, it is called correlation. The numerical measure of correlation is called the
coefficient of correlation and is defined by the relation.
N ε xy - ε x . ε y
r = ---
√ (N ε x2 - ( ε x )2 . N ε y2 - ( ε y )2)
3. REGRESSION EQUATION
Y = mx +c
N ε xy - ε x . ε y
m = slope = ---
ε y . ε x2 - εx . ε xy
c = Intercept = ---
N ε x2 - ( ε x )2
4. PRECISION
The precision (or reproducibility) of the proposed method was ascertained by
analyzing the same concentration (3/4th of the upper Beer's law limit) of the drug in
freshly prepared test solution eight times. The set of absorbance values obtained were
then used to obtain the standard deviation, which is expressed in absorbance units or as a
percentage of mean absorbance.
S = √ (X- X) 2/N – 1
Where,
X = observed values
X = Arithmetic mean = √X/N
N = Number of deviations
For practical interpretation it is more convenient to express ‘S' in terms of percent of the
approximate average of the range of analysis is used in the calculation of 'S'. This is
called co-efficient of variation (C.V.) or percent relative standard deviation (% R.S.D.).
It is customary to use probability limits (P) 0.05 level (95% of the readings will be within
the calculated limits x ± a, where a = t.s/√n, t value is 2.365 from Students table) and
0.01 level (99% of the readings will be within the limits x ± b, where b = t.s/√n, t value
is 3.499 from students Table for eight determinations).
% range of error at p = 0.05 level = ± 100 a/x
5. ACCURACY
The accuracy of the recommended procedure is evaluated by comparing the
values obtained in the proposed and reported methods.
Percent recovery studies
Recovery studies by adding known quantities of drug to previously analyzed
pharmaceutical preparations are followed using proposed procedure. To study percent
recovery, fixed amount of the sample is taken in a series of volumetric flasks and three
different levels of standard solutions are added. Each level of the added drug is repeated
six times. The total amount of the drug is then determined by the proposed method.
The percent recovery is calculated by using the equation:
N. √xy – (√x) (√y)
% Recovery = --- X 100
N √x2 – (√x) 2
Where
x = amount of drug added in mg/g of sample
y = amount of drug found in mg/g of sample
N = total number of observations
6. INTERFERENCE STUDIES
The effects of a wide range of excipients and other additives usually present in
formulations on the determinations under optimum conditions were investigated.
In the initial interference studies, a fixed concentration of the drug was
(1-100 fold) molar excess of the foreign compound under investigation and its effect on
the absorbance of solution was noted. The foreign compound was considered to be not
interfering at these concentrations if it consistently produces an error less than 3% in the
1.3 AREA UNDER CURVE METHOD (Telekone et al., 2010)
The area under curve method is applicable where there is no sharp peak or when
broad spectra are obtained. It involves the calculation of integrated value of absorbance
with respect to the wavelength between the two selected wavelengths λ1 and λ2. Area
calculation processing item calculates the area bound by the curve and the horizontal
axis. The horizontal axis is selected by entering the wavelength range over which area
has to be calculated. This wavelength area is selected on the basis of repeated observation
so as to get the linearity between area under curve and concentration. In combination
drugs λ1 and λ2 denotes the wavelength ranges of the components. The integrated value of
absorbance in the wavelength ranges of both the drugs are substituted in the simultaneous
equation to get the concentration of the drugs.
2 1 1 1 2 1 2 2 y x y x y y x a a a a a A a A c − −
= and
1.4 DERIVATIVE SPECTROSCOPY
(Robert D. Braun, 2006, Beckett et al., 2007, Kenneth A Connors, 2002,)
INTRODUCTION
Derivative spectrophotometry is useful means of resolving two overlapping
spectra and eliminating matrix interference due to an indistinct shoulder on side of an
absorption bands. It involves conversion of normal spectrum [A= f (λ)] to its first [dA/ dλ
= f (λ)], second [d2A/ dλ2 = f (λ)] and higher derivatives spectra where the amplitude in
the derivative spectrum is proportional to the concentration of the analyte provided that
Beer’s law is obeyed by the fundamental spectrum.
dA/ dλ = (dA/dt) / (dλ /dt) = (dA/dt)(1/C)
A first derivative spectrum is a plot of dA/dλ or dT/dλ as a function of wavelength, and
a second derivative spectrum is a plot of d2A/dλ2 as a function of λ. examples of instruments
that are capable of recording derivative spectra include the Baush and Lomb spectronic 2000,
the varian DMS 90 and DMS 100, the Gilford 2600, and Hitachi 100-80.
First and second derivative spectra often show detail that is lacking in conventional
spectra. That detail can be an aid in the qualitative or quantitative analysis of sample.
INSTRUMENTATION (Robert D.Braun, 2006)
Derivative spectra may be generated by any of three techniques. The earliest derivative
monochromators set a small wavelength interval (▲λ, typically 1-3 nm) apart, or with the
facility to oscillate the wavelength over a small range, are required
TYPICAL DIAGRAM OF DERIVATIVE SPECTRA
(http://www.medicinescomplete.com)
In either case the photo detectors generates a signal with amplitude proportional to the
slope of the spectrum over the wavelength interval. Instruments of this type are expensive and
The second technique to generate derivative spectra is electronic differentiation of the
spectrophotometers analog signal resistance capacitance (RC) modules may be incorporated in
series between the spectrophotometer and recorder to provide differentiation of the absorbance,
not with respect to wavelength, but with respect to time, there by producing signal dA/dt.
The third technique is based upon micro computer differentiation. micro computers
incorporated into or interfaced with the spectrophotometer may be programmed to provide
derivative spectra during or after the scan, to measure derivative amplitudes between specified
wavelengths and to calculate concentration and associated statistics from the measured
amplitudes.
DIAGRAM OF ZERO, FIRST AND SECOND ORDER SPECTRAS OF A COMPOUND
1.5 VISIBLE SPECTROPHOTOMETRY
(B.K. Sharma, 2007, Mendham J et al., 2002)
Visible spectrophotometry involves the measurement of the amount of visible
radiation (400 - 800 nm) absorbed by a colour solution. Using this, the quality of an
element present is estimated from the intensity of the colour of the solution due to the
presence of a coloured compound of that element. The more intense colour is the higher
concentration of the element in solution.
Some compounds are self coloured and for other it is necessary to develop colour
by the addition of one or more colour forming reagents (chromogenic reagents) such as
MBTH, NED, FC etc. The absorbing capacity of a coloured system is directly
proportional to the amount of desired constituent.
Colorimetric analysis should satisfy following criteria.
• The colour reaction should be specific
• Proportionality change between colour and concentration
• Colour should be stable to permit an accurate reading
• Reproducible result should be notified
• Solution must be free from precipitate
• The colour reaction should be highly sensitive
In physics colorimetry refers to the measurement of colour and the determination
involves neither the nature of the colourant nor its amounts. In chemistry, a general term
called absorptiometry is used for chemical analysis through measurement of radiation.
Chemical systems which exhibit a selective light absorptive capacity or coloured, and
measurements of such system when the object is to determine the concentration of the
consistutents responsible for the colour. In other words the variation of some component
forms the basis of colorimetric analysis and it is concerned with the determination of the
concentration of a substance by measurement of the relative absorption of light with
respective of a known concentration of substance.
Colours of different wavelength (kasture et al., 2007)
Wavelength (nm) Absorbed color Transmitted color
380-450 Violet Yellow – green
450-495 Blue Yellow
495-570 Green Violet
570-590 Yellow Blue
590-620 Orange Green – blue
620-760 Red Blue – green
Disadvantage of colorimetry
1. These methods always require the availability of a standard or a series of
standards.
2. The eye will not be able to match the colour in presence of a standard colored
substances. If present in the solution.
3. The eye is not sensitive enough to small differences in absorbances as a
photoelectric device.
4. Concentration difference smaller than about 5% relative are difficult to be
1.6 HIGH PERFORMANCE THIN LAYER CHROMATOGRAPHY
(sethi P.D.,1996)
Set the analytical objective first that may be quantification or qualitative
identification or separation of two components/multicomponent mixtures or optimization
of analysis time before starting HPTLC. Method for analyzing drugs in multicomponent
dosage forms by HPTLC demands primary knowledge about the nature of the sample,
namely, structure, polarity, volatility, stability and the solubility parameter.
An exact recipe for HPTLC, however, also same like HPLC cannot be provided
because method development involves considerable trial and error procedures. The most
difficult problem usually is where to start, with what kind of mobile phase.
Various process involved in HPTLC
1. Selection of HPTLC plates and solvent.
2. Sample preparation including prechromatogrphic derivitization.
3. Application of sample.
4. Development (separation)
5. Detection including post chromatographic derivitization.
6. Quantification.
7. Documentation.
Method Development for HPTLC
1. Set your analytical objectives –qualitative identification or quantitative
2. Separation of two components or multi component mixtures
3. Collect information about the sample regarding structure, polarity, solubility
Selection and Optimization of Selection of Stationary Phase;
Mobile phase Prewashing of Layer
In situ Pre Chromatographic Pre Conditioning /saturation of
Derivitisation Layer
UV-Visible /Fluorescent post Chromatographic
Detection Derivatisation
Plates
Plates are classified as two types
1. Hand made plates.
2. Pre-coated plates.
Mobile phase
Poor grade of solvent used in prerparing mobile phase have found ro decrease
resolution, spot definition and Rf reproducibility.
Sample Preparation
Application of Sample
Development of Chromatogram
Detection of Analytes
Activation of precoated plates
Plates exposed to high humidity or kept on hand for long time may have to be
activated by placing in oven at 110-120˚C for 30 minutes.
Sample prepation
The sample preparation is not as demanding as for other chromatographic
techniques, however several steps for sample pre-treatment may be necessary such as
sampling, mechanical crushing, extraction, filtration and enrichment of minor
compounds. Proper sample preparation is an important for success of HPTLC separation.
Application of sample
The sample should be applied through clean upper end of the capillary and for
that filling to marked point, reverse the capillary for applying the sample.
Pre-conditioning (chamber saturation)
If the tank is saturated prior to development, solvent vapours soon get uniformly
distributed throught the chamber. As soon as the plate is placed in such a saturated
chamber, it soon gets pre-loaded with solvent vapours, hence less solvent shall be
required to travel particular distance, resulting lower Rf values.
Development and drying
After development the plate is removed from the chamber and mobile phase is
removed as completely and as quickly as possible. This step should preferably be
performed infume cup board to avoid contamination of laboratory atmosphere. The plates
should always be laid horizontally, so that while mobile phase evaporates the separated
Detection and visualiztiion
Detection sensitivity depends on the reagent employed. Iodine is the universal
detection reagent, the detection usually non-destructive and reversible but certain
substance may be altered through non-reversible derivitization.
Quantification
- Sample and standard should be chromatographed on same plate
- After development chromatogram is scanned
- Camag TLC scanner III scan the chromatogram in reflectance or in transmittance
mode by absorbance or by fluorescent mode
- Scanning speed is selectable up to 100 mm/s
- Spectra recording are fast - 36 tracks with up to 100 peak windows can be
evaluated
- Calibration of single and multiple levels with linear or non-linear regressions are
possible when target values are to be verified such as stability testing and dissolution
profile single level calibration is suitable
- Statistics such as RSD or CI report automatically
- Concentration of analyte in the sample is calculated by considering the sample
initially taken and dilution factors.
1.7 VALIDATION OF ANALYTICAL METHOD
(Code Q2A, 1994; Code Q2B, 1996; ICH Guidelines)
Validation is an act of proving that any procedure, process, equipment, material,
activity or system performs as expected under given set of conditions and also give the
required accuracy, precision, sensitivity, ruggedness, etc.
When extended to an analytical procedure, depending upon the application, it means that
a method works reproducibly, when carried out by same or different persons, in same or
different laboratories, using different reagents, different equipments, etc.
The objective of the analytical procedure should be clearly understood since this will
govern the validation characteristics which need to be evaluated. Typical validation
characteristics which should be considered are listed below
1. Accuracy
2. Precision(Repeatability and Reproducibility),
3. Linearity and range
4. Limit of detection (LOD)/ limit of quantization (LOQ),
5. Selectivity/ specificity
6. Robustness/ ruggedness and
7. Stability and system suitability studies
Advantages of Analytical method Validation:
The biggest advantage of method validation is that it builds a degree of
Although the validation exercise may appear costly and time consuming, it results
inexpensive, eliminates frustrating repetitions and leads to better time management in the
end. Minor changes in the conditions such as reagent supplier or grade, analytical setup
are unavoidable due to obvious reasons but the method validation absorbs the shock of
such conditions and pays for more than invested on the process.
ANALYTICAL METHOD VALIDATION:
Key Parameters of the Analytical Method Validation:-
It is important for one to understand the parameters or characteristics involved in
the validation process. The various Performance parameters, which are addressed in a
validation exercise, are grouped as follows.
(1) Accuracy:
-The accuracy of an analytical method may be defined as the closeness of the test
results obtained by the method to the true value. It is the measure of the exactness of the
analytical method developed. Accuracy may often express as percent recovery by the
assay of a known amount of analyte added.
Accuracy may be determined by applying the method to samples or mixtures of
excipients to which known amount of analyte have been added both above and below the
normal levels expected in the samples. Accuracy is then calculated from the test results as
the percentage of the analyte recovered by the assay. Dosage form assays commonly
(2) Precision: -
The precision of an analytical method is the degree of agreement among
individual test results when the method is applied repeatedly to multiple samplings of
homogenous samples. This is usually expressed as the standard deviation or the relative
standard deviation (coefficient of variation). Precision is a measure of the degree of
reproducibility or of the repeatability of the analytical method under normal operating
circumstances.
Repeatability involves analysis of replicates by the analyst using the same equipment
and method and conducting the precision study over short period of time while
reproducibility involves precision study at
• Different Occasions,
• Different Laboratories,
• Different Batch of Reagent,
• Different Analysts,
• Different Equipments.
Determination of Repeatability:
It defined as the precision of the procedure when repeated by same analyst under
the same operating conditions (same reagents, equipments, settings and laboratory) over a
short interval of time. It is normally expected that at least six replicates be carried out and
a table showing each individual result provided from which the mean, standard deviation
and co-efficient of variation should be calculated for set of n value. The RSD values are
repeated several time in a standard situation. (RSD below 1% for built drugs, RSD below
2% for assays in finished product).
Determination of reproducibility:
It means the precision of the procedure when it is carried out under different
conditions-usually in different laboratories-on separate, putatively identical samples
taken from the same homogenous batch of material. Comparisons of results obtained by
different analysts, by the use of different equipments, or by carrying out the analysis at
different times can also provide valuable information.
(3) Linearity and range:
The linearity of an analytical method is its ability to elicit test results that are
directly (or by a well defined mathematical transformation) proportional to the analyte
concentration in samples within a given range. Linearity usually expressed in terms of the
variance around the slope of regression line calculated according to an established
mathematical relationship from test results obtained by the analysis of samples with
varying concentrations of analyte.
The linear range of detect ability that obeys Beer’s law is dependent on the
compound analyzed and the detector used. The working sample concentration and
samples tested for accuracy should be in the linear range. The claim that the method is
linear is to be justified with additional mention of zero intercept by processing data by
linear least square regression. Data is processed by linear least square regression
declaring the regression co-efficient and b of the linear equation y= ax + b together with
the correlation coefficient of determination r. For the method to be linear the r value
The range of an analytical method is the interval between the upper and lower
levels of the analyte (including these levels) that have been demonstrated to be
determined with precision, accuracy and linearity using the method as written.
(4) Limit of Detection and limit of Quantitation:
Limit of detection:
The limit of detection is the parameter of limit tests. It is the lowest level of
analyte that can be detected, but not necessarily determined in a quantitative fashion,
using a specific method under the required experimental conditions. The limit test thus
merely substantiates that the analyte concentration is above or below a certain level.
The determination of the limit of detection of instrumental procedures is carried out by
determining the signal-to-noise ratio by comparing test results from the samples with
known concentration of analyte with those of blank samples and establishing the
minimum level at which the analyte can be reliably detected. A signal-to-noise ratio of
2:1 or 3:1 is generally accepted.
The signal-to-noise ratio is determined by dividing the base peak by the standard
deviation of all data points below a set threshold. Limit of detection is calculated by
taking the concentration of the peak of interest divided by three times the signal-to-noise
ratio.
For spectroscopic techniques or other methods that rely upon a calibration curve
for quantitative measurements, the IUPAC approach employs the standard deviation of
the intercept (Sa) which may be related to LOD and the slope of the calibration curve, b,
by
Limit of quantitation:-
Limit of quantitation is a parameter of quantitative assays for low levels of
compounds in sample matrices such as impurities in bulk drugs and degradation products
in finished pharmaceuticals. The limit of quantitation is the lowest concentration of
analyte in a sample that may be determined with acceptable accuracy and precision when
the required procedure is applied.
It is measured by analyzing samples containing known quantities of the analyte and
determining the lowest level at which acceptable degrees of accuracy and precision are
attainable where the final assessment is based on an instrumental reading, the magnitude
of background response by analyzing a number of blank samples and calculating the
standard deviation of this response. The standard deviation multiplied by a factor (usually
10) provides an estimate of the limit of quantitation. In many cases, the limit of
quantitation is approximately twice the limit of detection.
5) Selectivity and Specificity:-
The selectivity of an analytical method is its ability to measure accurately and
specifically the analyte of interest in the presence of components that may be expected to
be present in the sample matrix.
If an analytical procedure is able to separate and resolve the various components
of a mixture and detect the analyte qualitatively the method is called selective. On the
other hand, if the method determines or measures quantitatively the component of interest
Hence one basic difference in the selectivity and specificity is that, while the former is
restricted to qualitative detection of the components of a sample, the latter means
quantitative measurement of one or more analyte.
Selectivity may be expressed in terms of the bias of the assay results obtained
when the procedure is applied to the analyte in the presence of expected levels of other
components, compared the results obtained when the procedure is applied to the analyte
in the presence of expected levels of other components, compared to the results obtained
on the same analyte without added substances. When the other components are all known
and available, selectivity may be determined by comparing the test results obtained on the
analyte with and without the addition of the potentially interfering materials. When such
components are either unidentified or unavailable, a measure of selectivity can often be
obtained by determining the recovery of a standard addition of pure analyte to a material
containing a constant level of the other components.
(6) Robustness and Ruggedness:-
Robustness:
It is an analytical method is a measure of its capacity to remain unaffected by
small but deliberate variation in method parameters and provides an indication of its
reliability during normal usage. The determination of robustness requires that
methods characteristic are assessed when one or more operating parameter varied.
Ruggedness:
It is an analytical method is the degree of reproducibility of test results obtained
by the analysis of the same samples under a variety of normal test conditions such as
conditions that may differ but are still within the specified parameters of the assay.
The testing of ruggedness is normally suggested when the method is to be used in
more than one laboratory. Ruggedness is normally expressed as the lack of the
influence on the test results of operational and environmental variables of the
analytical method.
For the determination of ruggedness, the degree of reproducibility of test
result is determined as function of the assay variable. This reproducibility may be
compared to the precision of the assay under normal condition to obtain a measure of
the ruggedness of the analytical method.
(7) Stability and System suitability tests:-
Stability of the sample, standard and reagents is required for a reasonable time to
generate reproducible and reliable results. For example, 24 hour stability is desired for
solutions and reagents that need to be prepared for each analysis.
System suitability test provide the added assurance that on a specific occasion the
method is giving, accurate and precise results. System suitability test are run every time a
method is used either before or during analysis. The results of each system suitability test
are compared with defined acceptance criteria and if they pass, the method is deemed
satisfactory on that occasion. The nature of the test and the acceptance criteria will be
based upon data generated during method development optimization and validation
1.8 PHARMACEUTICAL STATISTICS(Kenneth, 2002, Sundar Rao P.S et al, 2006)
Statistical techniques have been widely used in many diverse areas of scientific
investigation. Statistical applications have been recognized as crucial to quality control
procedure, test, specification and definitions. Principle of modern analytical techniques
and skill in their application are necessary attribute of the successful pharmaceutical
analyst, thus does not ensure the satisfactory solution of all the problem that may
encountered. Some auxiliary knowledge methods those can aid the analyst in designing
experiment, collecting data, and interpreting the result.
1.8.1. Linear regression
Linear regression a statistical technique that defines the functional relationship
between two variables by best-fitting straight line. Once a linear relationship has been
shown to have a high probability by the value of the correlation coefficient ‘r’, then the
best straight line through the data points has to be estimated. This can often be done be
done by visual inspection of the calibration graph, but in many cases it is far more
sensible to evaluate the best straight line by linear regression (the method of least
squares)
The equation of straight line is
y = mx + c
Where, y the dependent variable is plotted as result of changing x, the independent
variable.
To obtain the regression line ‘y on x’ the slope ‘m’ of the line and the intercept ‘c’
N Σxy – (Σx) (Σy)
m =
N Σx2 – (Σx)2
and
(Σy) (Σx2) – (Σx)(Σxy)
c =
N Σx2 – (Σx)2
1.8.2. Correlation coefficient (r)
It is a procedure commonly used to characterize quantitatively the relationship
between variable. Correlation is related to linear regression. To establish whether there is
a linear relationship between two variables x1 and y1, use Pearson’s correlation
coefficient r.
n Σx1y1 - Σx1y1
r =
{[n Σx12 – (Σx1)2] [n Σy12 – (Σy1)2]}1/2
Where n is the number of data points.
The value of r must lie between +1 and -1, the nearer it is to +1, the greater the
probability that a definite linear relationship exists between the variables x and y, values
close to +1 indicate positive correlation and values close to -1 indicate negative
correlation values of ‘r’ that tend towards zero indicate that x and y are not linearly
1.8.3. Standard deviation (SD)
It is commonly used in statistics as a measure of precision statistics as a measure
of precision and is more meaningful than is the average deviation. It maybe thought of
as a root-mean-square deviation of values from their average and is expressed
mathematically as
(
)
1 N x x S n i 1 i i − − =∑
= = Where,S is standard deviation.
If N is large (50 or more) then of course it is immaterial whether the term in the
denomination is N -1 or N
Σ = sum
x
= Mean or arithmetic average.x
-x
= deviation of a value from the mean N = Number of observations1.8.4. Percentage relative standard deviation (%RSD)
It is also known as coefficient of variation (CV). It is defined as the standard
deviation (S.D) expressed as the percentage of mean.
C 100 x
S.D RSD % or
V = ×
Where,
S.D is the standard deviation,
x
= Mean or arithmetic average.The variance is defined as S2 and is more important in statistics than S itself.
However, the latter is much more commonly used with chemical data.
1.8.5. Standard error of mean (SE)
Standard error of mean can be defined as the value obtained by division of
standard deviation by square root of number of observations. It is mathematically
expressed as
n S.D. S.E.=
Where,
S.D = Standard deviation
REVIEW
OF
2. REVIEW OF LITERATURE
DRUG PROFILE (http://en.wikipedia.org/wiki/Dapoxetine.)
DAPOXETINE
MOLECULAR STRUCTURE
CHEMICAL STRUCTURE
N,N-dimethyl-3-(naphthalene-1-yloxy)-1-phenylpropan-1-amine
MOLECULAR FORMULA
C21H23NO
MOLECULAR WEIGHT
Dapoxetine 341.88g/mol
DESCRIPTION
STORAGE AND STABILITY
Store at room temperature, protected from light and moisture. Keep out of children.
SOLUBILITY
Soluble in water at 10mg/mL as a free base (pH dependent)
IDENTIFICATION
1. Melting point
Drug Standard value Observed value*
Dapoxetine 175-180˚C 175.1
* average of six determination.
2. IR spectra was recorded and shown in figure 1.
INDICATION
Dapoxetine is indicated for the treatment of premature ejaculation (PE) in men 18 to 64 years of age.
PHARMACODYNAMICS
PHARMACOKINETICS
A randomized, double-blind, placebo-controlled trial of 77 healthy male volunteers was used to assess the pharmacokinetics of Dapoxetine, using a single dose (60, 100, 140, or 160 mg) or multiple doses (60, 100, 140, or 160 mg) of Dapoxetine over a 6 day period. Dapoxetine was rapidly absorbed after being taken by mouth, with a peak plasma concentration between 1.4 and 2.0 hours. This was immediately followed by a rapid decline in plasma concentration, to about 5% of peak concentration within 24 hours.
Distribution
Reported evidence suggests that Dapoxetine is rapidly more than 99% of Dapoxetine is bound to human serum proteins. The active metabolite DesMethylDapoxetine (DED) is 98.5% protein bound. Dapoxetine appears to have a rapid distribution with a mean steady state volume of distribution of 162 L, following values for Dapoxetine were 0, 10, 2, 19 and 19.3 respectively.
Metabolism
Elimination
The metabolite of Dapoxetine were primarily eliminated in the urine as conjugates. Unchanged active substance was not detected in the urine. Dapoxetine has a rapid elimination, as evidence by a low concentration (less than 5% of peak) 24 hours after dosing. There was minimal elimination of Dapoxetine following daily dosing. The