P R O C E E D I N G S
Open Access
Structural equation modeling with latent
variables for longitudinal blood pressure
traits using general pedigrees
Yeunjoo E. Song
1, Nathan J. Morris
1,2and Catherine M. Stein
1,3*FromGenetic Analysis Workshop 19 Vienna, Austria. 24-26 August 2014
Abstract
Structural equation modeling (SEM) has been used in a wide range of applied sciences including genetic analysis. The recently developed R package,strum,implements a framework for SEM for general pedigree data. We explored different SEM techniques using strumto analyze the multivariate longitudinal data and to ultimately test the association of genotypes on blood pressure traits. The quantitative blood pressure (BP) traits, systolic BP (SBP) and diastolic BP (DBP) were analyzed as the main traits of interest with age, sex, and smoking status as covariates. The single nucleotide polymorphism (SNP) genotype information from genome-wide association studies (GWAS) data was used for the test of association. The adjustment for hypertension treatment effect was done by the censored regression approach. Two different longitudinal data models, autoregressive model and latent growth curve model, were used to fit the longitudinal BP traits. The test of association for SNP was done using a novel score test within the SEM framework of strum. We found the 10 SNPs within the GWAS suggestiveP value level, and among those 10, the most significant top 3 SNPs agreed in rank in both analysis models. The general SEM framework in strumis very useful to model and test for the association with massive genotype data and complex systems of multiple phenotypes with general pedigree data.
Background
Structural equation modeling (SEM) has been used in a wide range of applied sciences as well as in genetic analysis [1, 2], particularly for longitudinal data analysis [3, 4]. SEM is a general and powerful approach to account for measurement error and causal pathways by estimating the parameters for a system of simultaneous equations [5, 6]. The R pack-age strum was recently developed [7], implementing the framework for SEM for general pedigrees de-scribed in Morris et al. [8]. It includes both fitting and simulation of a broad range of latent measure-ment models and structural equation models with
covariates, allowing for a wide variety of models in-cluding latent growth curve models. It can handle multilevel models, polygenic random effects and linkage random effects. Traditional structural equa-tion models and confirmatory factor analysis may also be performed.
The Genetic Analysis Workshop 19 family data set includes the longitudinal multivariate blood pressure traits. This complexity of traits in this data set pro-vides a good opportunity to evaluate the flexibility and applicability of the strum package for modeling in family data. This paper explores the 2 different SEM techniques using strum to analyze the multivari-ate longitudinal data and, ultimmultivari-ately, to test the asso-ciation of genotype to blood pressure (BP) traits, looking for a set of single-nucleotide polymorphisms (SNPs) that came up as significant in both analysis models.
* Correspondence:[email protected]
1
Department of Epidemiology and Biostatistics, Case Western Reserve University, Cleveland, OH 44106, USA
3Center for Proteomics and Bioinformatics, Case Western Reserve University,
Cleveland, OH 44106, USA
Full list of author information is available at the end of the article
Methods
Data
We analyzed the real family data set, which consists of 1389 individuals from 20 families with 27 to 107 mem-bers. The detailed description of the data can be found in Almasy et al. [9]. The quantitative BP traits, systolic BP (SBP) and diastolic BP (DBP) were analyzed as the main traits of interest. We included age, sex, and smoking status as covariates. For both methods, we only included the first 3 visits into our analysis as more than 80 % of data were missing for the 4th visit, and there were 10 families with completely missing data for the 4th visit. The genotype informa-tion from genome-wide associainforma-tion studies (GWAS) data was used, which included 472,060 SNPs in total. After removing the SNPs with no variation in the data set or with no score test results, the remaining 460,359 SNPs were tested for association with the main traits by coding additively as 0, 1, or 2 based on the minor allele count.
Before being included in any structural equation ana-lysis, the BP trait value at each visit was adjusted for the effect of hypertension medication as done by other re-searchers, to reduce the bias in the estimated effect of interest and the loss in statistical power [10]. We followed the censored regression approach of Konigorski et al. [11]. The difference between the observed and fitted BP for the untreated individuals and the difference
between the adjusted and fitted BP for the treated indi-viduals are used as our main BP trait values (denoted as rSBP and rDBP).
Analysis
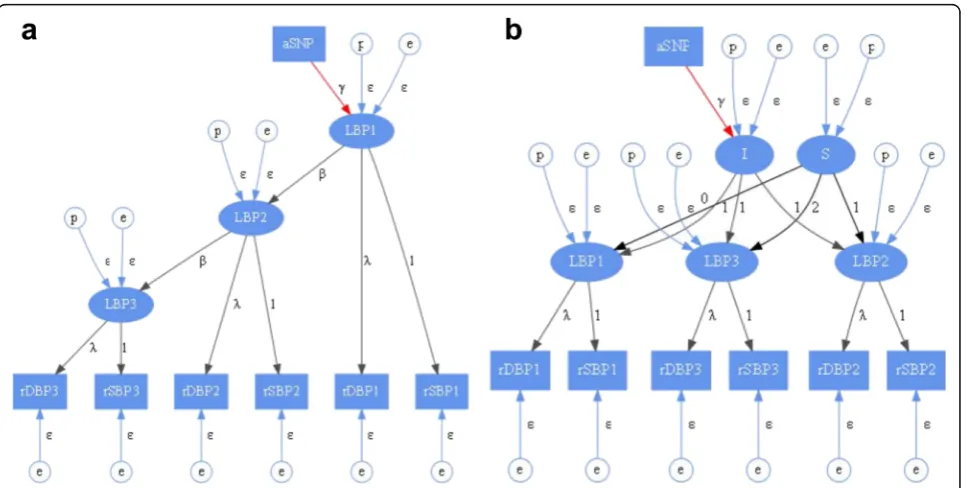
We included 2 different types of longitudinal data mod-eling approaches in this study: autoregressive (AR) model and latent growth curve (LG) model. In both models, the observed values of SBP and DBP at each time point are assumed to include measurement errors. In each time point, it is assumed that there is a latent variable that affects both SBP and DBP in both models. However, the relationship among the latent variables at different time points and the SNP effect on the underlying latent variables are differently mod-eled in each analysis model. Therefore, the number of parameters estimated in the correlation structure is different in each model. The visual presentations of the 2 models are shown in Fig. 1. The pedigree rela-tionship is incorporated in the model by including and simultaneously estimating the polygenic effect denoted as circled p in Fig. 1.
Model 1: autoregressive model with measurement error
This is a first-order AR model with measurement error. In this model, the latent variable at t(n) is a function of the latent variable at t(n-1) and not any variable before, so the true underlying latent variable has an AR
structure. The SNP effect is modeled directly on the latent variable in the first time point and indirectly to other time points.
Model 2: latent growth curve model with latent slope and intercept
This is a method to study growth (or change) over time. In this model, the latent variables at different time points share a common intercept with different slopes. The model includes the SNP effects directly on the intercept, so the SNP effects all time points equally. This approach models individual change process as function of latent intercept and slope factors.
Based on the original strumframework, we developed a new score test. This method is a computationally rapid test of association with many SNPs in GWAS data (manuscript in preparation). In this new score test, we first assessed the null model fit without any SNPs in the model to confirm the appropriateness of the model for the data. For each model, we ran the analysis 3 times to make sure the results were fully converged. Then, one at a time, each SNP was tested for association with the BP traits.
Results
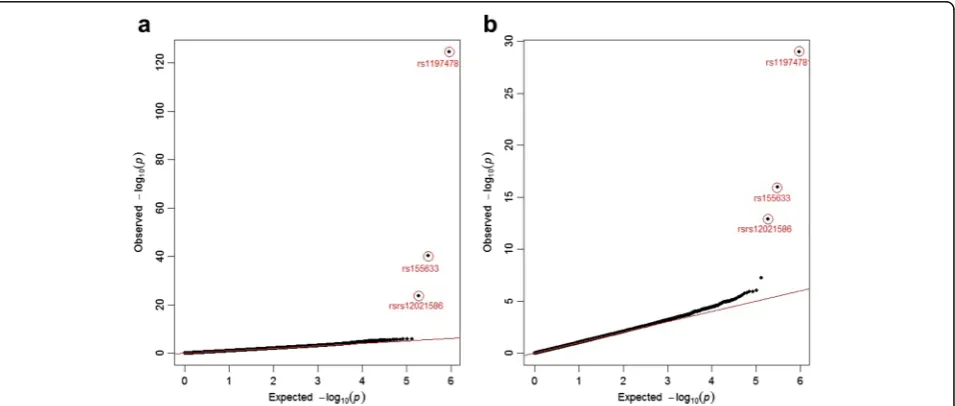
The overall results of the association tests for all SNPs are shown in Fig. 2 as the quantile–quantile
(Q-Q) plots of the observed and expected P values
for 2 analysis models. The genomic inflation factors were 1.01 and 1.02 for each model. Even though the SNP effect was modeled differently, the ranking of
P values from both models was very close
(correl-ation = 0.9). Out of total 460,359 SNPs tested, there
were 26 SNPs for the AR model and 18 SNPs for the LG model with suggestive evidence of association (ie,
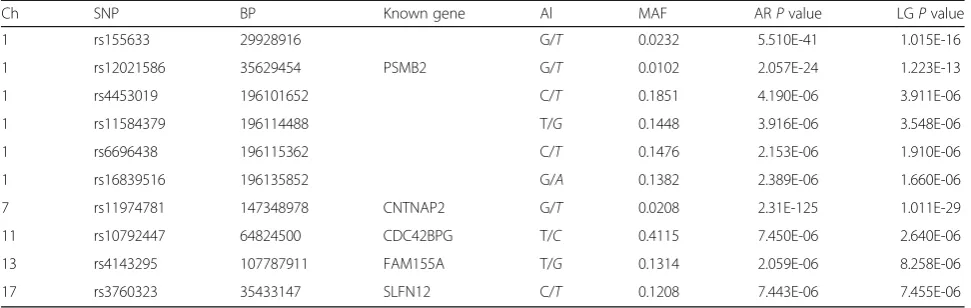
P value < 1.0e-5). Among those, 10 SNPs were the same from both models, and 4 SNPs on chromosome 1 are located close to each other indicating that they are in high linkage disequilibrium (LD). Table 1 shows the characteristics and P values. Interestingly, the most significant top 3 SNPs from both models agreed in rank as shown in Fig. 2.
Discussion
There have been several recent genetic studies on BP traits [12, 13]. In most studies, 2 BP traits, SBP and DBP, are analyzed separately or they are summarized into 1 value. In addition, the longitudinal values are also summarized into a value. In our study, we re-port the SNPs associated with the latent variable for both BP traits longitudinally. Therefore, our results and the results from the association test on the sum-marized BP trait may not be easily comparable, and our results provide different GWAS findings. How-ever, the differences and agreements of the results from ours and from the analysis done in each time points separately might give another interesting and useful insight into the relation between BP traits and genotypes.
The unbalanced missing rates in each time points with the longitudinal data were a limitation with this study. We were only able to include the first 3 visits into our analysis since there were 10 families with the completely missing data for the 4th visit which would have reduced the effective sample size to 10 from the original 20 families.
Similar results were found from 2 different analysis models, but there were differences in magnitude of P
values for the top hits. This might be a result of the dif-ferences in the number of parameters in the models. Also, the highly significant P values for the same top 3 SNPs from both models might be a result of the low minor allele frequency (MAF). Upon further examin-ation, we found the minor allele was not present in many families, reducing the effective sample size. The effect of MAF on type I error in family data using this approach needs to be investigated.
Conclusions
The initial version of the novel score test we have devel-oped is computationally efficient enough for genome wide analysis, but its statistical properties need to be more fully evaluated. Among the results from 2 analysis models, that is, the AR model and LG model, we found the 10 SNPs within the GWAS suggestive P value level, and among those 10, the most significant top 3 SNPs agreed in rank in both analysis models. The similar re-sults from both models provide more confidence on the results. The general SEM framework in strum is very useful to model and test for the association with massive genotype data and complex systems of multiple pheno-types with general pedigree data.
Acknowledgements
This work was supported by the National Institutes of Health grant [R01HL096811-01]. We thank the reviewers for their insightful and helpful comments.
Declarations
This article has been published as part ofBMC ProceedingsVolume 10 Supplement 7, 2016: Genetic Analysis Workshop 19: Sequence, Blood Pressure and Expression Data. Summary articles. The full contents of the supplement are available online at http://bmcproc.biomedcentral.com/ articles/supplements/volume-10-supplement-7. Publication of the proceedings of Genetic Analysis Workshop 19 was supported by National Institutes of Health grant R01 GM031575.
Authors’contributions
YES designed study, wrote the manuscript, and performed the analysis. NJM and CMS oversaw the project and revised the manuscript. All authors read and approved the final manuscript.
Competing interests
The authors declare that they have no competing interests.
Author details
1Department of Epidemiology and Biostatistics, Case Western Reserve
University, Cleveland, OH 44106, USA.2Center for Clinical Investigation, Case
Western Reserve University, Cleveland, OH 44106, USA.3Center for
Proteomics and Bioinformatics, Case Western Reserve University, Cleveland, OH 44106, USA.
Published: 18 October 2016
References
1. Li R, Tsaih SW, Shockley K, Stylianou IM, Wergedal J, Paigen B, et al. Structural model of analysis of multiple quantitative traits. PLoS Genet. 2006;2(7):e114.
2. Stein CM, Morris NJ, Nock NL. Structural equation modeling. In: Elston RC, Satagopan JM, Sun S, editors. Statistical Human Genetics. New York: Springer; 2012. p. 495–512.
3. Chavance M, Escolano S, Romon M, Basdevant A, de Lauzon-Guillain B, Charles MA. Latent variables and structural equation models for longitudinal relationship: an illustration in nutritional epidemiology. BMC Med Res Methodol. 2010;10:37.
4. Rosel J, Plewis I. Longitudinal data analysis with structural equations. Methodology. 2008;4(1):37–50.
5. Bollen KA. Structural Equations with Latent Variables. New York: Wiley; 1989. 6. Muthen BO. Beyond SEM: general latent variable modeling. Behaviormetrika.
2002;29:81–117.
7. Song YE, Stein CM, Morris NJ. strum: an R package for structural modeling of latent variables for general pedigrees. BMC Genet. 2015;16:35. 8. Morris NJ, Elston RC, Stein CM. A framework for structural equation models
in general pedigrees. Hum Hered. 2010;70(4):278–86.
9. Blangero J, Teslovich TM, Sim X, Almeida MA, Jun G, Dyer TD, Johnson M, Peralta JM, Manning AK, Wood AR, et al. Omics squared: Human genomic, transcriptomic, and phenotypic data for Genetic Analysis Workshop 19. BMC Proc. 2015;9 Suppl 8:S2.
10. Tobin MD, Sheehan NA, Scurrah KJ, Burton PR. Adjusting for treatment effects instudies of quantitative traits: antihypertensive therapy and systolic blood pressure. Stat Med. 2005;24(19):2911–35.
11. Konigorski S, Yilmaz YE, Bull SB. Bivariate genetic association analysis of systolic and diastolic blood pressure by copula models. BMC Proc. 2014;8 Suppl 1:S72.
Table 1SNPs associated with SBP and DBP in both analysis models
Ch SNP BP Known gene Al MAF ARPvalue LGPvalue 1 rs155633 29928916 G/T 0.0232 5.510E-41 1.015E-16 1 rs12021586 35629454 PSMB2 G/T 0.0102 2.057E-24 1.223E-13 1 rs4453019 196101652 C/T 0.1851 4.190E-06 3.911E-06 1 rs11584379 196114488 T/G 0.1448 3.916E-06 3.548E-06 1 rs6696438 196115362 C/T 0.1476 2.153E-06 1.910E-06 1 rs16839516 196135852 G/A 0.1382 2.389E-06 1.660E-06 7 rs11974781 147348978 CNTNAP2 G/T 0.0208 2.31E-125 1.011E-29 11 rs10792447 64824500 CDC42BPG T/C 0.4115 7.450E-06 2.640E-06 13 rs4143295 107787911 FAM155A T/G 0.1314 2.059E-06 8.258E-06 17 rs3760323 35433147 SLFN12 C/T 0.1208 7.443E-06 7.455E-06
Information on 10 SNPs from both analysis models withPvalue < 1.0e-5
12. Levy D, Ehret GB, Rice K, Verwoert GC, Launer LJ, Dehghan A, et al. Genome-wide association study of blood pressure and hypertension. Nature. 2009;41(6):677–87.
13. Ganesh SK, Chasman DI, Larson MG, Guo X, Verwoert G, Bis JC, et al. Effects of long-term average of quantitative blood pressure traits on the detection of genetic associations. Am J Hum Genet. 2014;95(1):49–65.
• We accept pre-submission inquiries
• Our selector tool helps you to find the most relevant journal • We provide round the clock customer support
• Convenient online submission • Thorough peer review
• Inclusion in PubMed and all major indexing services • Maximum visibility for your research
Submit your manuscript at www.biomedcentral.com/submit