International Journal of Innovative Technology and Exploring Engineering (IJITEE) ISSN: 2278-3075, Volume-8 Issue-8S, June 2019
Abstract: The ever-increasing amount of networking data as well as the complexity of telecommunication networks is also increasing, consequently the task of network management and troubleshooting is getting more complicated and difficult. Network troubleshooting is an important process, which has a wide research field. The first step in troubleshooting procedures is to collect information in order to diagnose the problems. Syslog messages, which are sent by almost all network devices, contain a massive amount of data related to the network problems. Detecting network problems could be more efficient if the detected problems have been classified in terms of network layers. In this paper, we focus on the usage of classification technique in the field of network management, more specifically in fault management. This paper proposes a layered based classification framework to classify syslog messages that indicates the network problem in terms of network layers. The method used data mining tool to classify the syslog messages, while the description part of the syslog message was used for classification process. Related syslog messages were identified; features were then selected to train the classifiers.
Index Terms: About four key words or phrases in alphabetical order, separated by commas.
I. INTRODUCTION
Most institutions and organizations, regardless of the business types, rely on networks to manage their business. Any failure or error which occurs in the network will negatively affect their achievements, productivity and services. The increase in telecommunication networks complexity means that managing networks have become more difficult, especially in detecting and classifying network problems which is crucial in making maintenance decision [1]. Therefore, it is necessary to diagnose and detect the reasons behind network failures and problems; in order to fix them and reduce similar occurrences in the future.
Revised Manuscript Received on May 22, 2019.
Mohammed Kamel Madi, Hassan Kalyoncu Universiti, Computer Engineering Department, GaziAntep, Turkey
Khuzairi Mohd Zaini, Universiti Utara Malaysia, School of Computing, Kedah, Malysia
Amran Ahmad, Universiti Utara Malaysia, School of Computing, Kedah, Malysia
Suzi Iryanti, Universiti Sains Malaysia, School of computer science, Penang, Malysia
Network troubleshooting could be an efficient process if it relies on a systematic approach, which minimizes confusion and shortened troubleshooting time. Diagnosis and recovery of any system problem begins with a review of the system’s log files [14]. These files record activity occurring on the system and indicate sources of problems. Logging is a way of tracking down historical events that can help administrators identify any failure, warning, error, success, or any type of problem occurring in the system. Syslog messages contain a massive amount of data related to network problems and this data is sent by almost all network equipment such as routers, switches, and firewalls [3]. Network troubleshooting is carried out using the Layered Model [1] as problems are normally described in terms of a specific model layer [2]. Network errors could be distributed into the network layers depending on TCP\IP model (network access layer, Internet layer, transport layer, application layer). Therefore, network problems can be classified according to their causing layers, depending on the layer elements problems. Through classification, the intended layer that causes network problems or failures, can be detected and therefore, treated immediately. Detecting the problems alone is insufficient to identify the source of the problem; it has to include the task of reading the detected syslog messages one by one for further understanding and diagnosing the responsible layer that causes network problems. The whole process (detecting and classifying network problems) involves cost, time and effort [11] in order to extract the data related to network problems, and classify it in terms of network layers. In fact, it is very difficult to classify syslog messages due to the following reasons: (1) the various types of logs which list messages with low or high severity [4] and the type of syslog data as it unstructured textual data, with a variety of formats and a big volume [5], (2) the increasing number of network elements means that there is a massive volume of complex log data, and it is therefore, necessary to extract information accurately and efficiently in order to make correct maintenance decisions, and (3) the log format, which depends on each vendor or service [6].
Thus, classifying syslog messages requires deep domain knowledge of each log format, components of each layer and their potential problems.
Layered Based Classification Framework For
Network Fault Management using Machine Learning
In this study we develop a method for analyzing syslog messages generated from network elements to find the root cause of failure and diagnosing the responsible layer that causes the network problems. The method is applicable to syslog messages in unstructured and vendor-dependent formats. Classifying network problems in terms of network layers could be more efficient for maintenance decision, and network troubleshooting. Applying machine learning techniques on syslog data could help to detect syslog messages that describe network problems, and classify them based on the related network layer. Classifying syslog data in terms of TCP/IP layers is the main contribution of this study, as it had succeeded in enhancing the processes of network troubleshooting, and impacted efficient maintenance decision.The rest of this paper is structured as follows. Section II presents an overview of related work. Section III introduces the proposed classification framework. Section IV presents the results of experiments and validation of the proposed framework. Finally, Section VI concludes the paper by summarizing the findings and outlining future work
II.RELATED WORKS
There are many works that have studied network problems detection from log data using data mining techniques. Xu et al. [6], detected system runtime problems by mining console logs. They converted free-text console logs into numerical features, which they then analyzed using Principal Component Analysis (PCA). Qiu et al. [7], designed an automated tool syslog digest that transform massive volume of routers syslog messages into much smaller number of meaningful network events, then they identified the signature of syslog messages that captured network behavior over time, and grouped them based on their nature and severities. Fukuda [8], used syslog messages to detect unusual events in a network, by using a global weight, based on a global appearance of a message type in the all data set. Xu et al. [9], created features that capture various correlations among different types of log messages to detect anomaly in syslog behavior, using Principal Component Analysis (PCA) learning algorithm. Kimura et al. [4], analyzed two types of data, SNS data from tweeter and syslog messages, to detect and diagnose network failure. They used non-negative matrix factorization (NMF) machine learning algorithm to analyze syslog messages, and support vector machine to analyze tweeter messages.
The limitation with all the previous works is that they only tried to detect network problems but they didn’t try to classify the problems for more efficient maintenance decisions and troubleshooting. This paper presents a method to analyze syslog data to detect network problems and diagnose their causes, and classify these problems in terms of network layers.
III. LAYERED BASED CLASSIFICATION FRAMEWORK
This section presents the procedures and approaches that
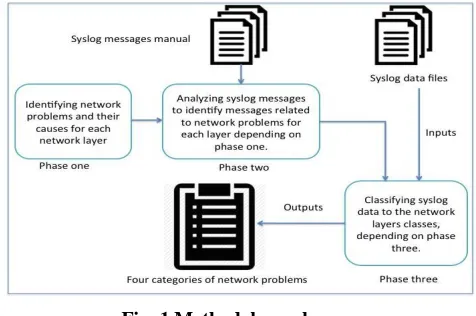
layers. This paper proposes a method, which involved three phases, to detect and classify network problems in terms of network layers. The phases are: (1) identifying network problems and their causes for each network layer, (2) identifying syslog messages related to network problems for each layer, depending on phase one, and (3) applying classification technique on syslog data set to classify network problems in terms of network layers. Fig. 1, illustrates methodology phases
Phase One (Network Problems Identifications)
[image:2.612.322.560.223.381.2]The first part of the methodology is to identify the causes of problems for each network layer. There are four steps involved in the process, which are:
Fig. 1 Methodology phases
1) Identifying network layers depending on TCP/IP model. It consists of only four layers (network access layer, Internet layer, transport layer, application layer) [10].
2) Identifying components of each layer.
[image:2.612.317.564.531.776.2]3) Identifying symptoms of the problems for each layer. 4) Identifying causes of the problems for each layer. Table 1, presents examples of network layers and problems.
Table. 1 Summary of network problems, key words, and message example
Network
layer Problem Key words
Message example
Layer1 Network access layer
Loss of connectivity, cabling fault, high collision counts.
Disconnected cable, damaged cable, improper cable, cable fault.
101002: (Primary) Bad failover cable.
Network bottlenecks or congestion, hardware fault.
Fault interface, interface fail, transmission error.
International Journal of Innovative Technology and Exploring Engineering (IJITEE) ISSN: 2278-3075, Volume-8 Issue-8S, June 2019
High CPU utilization rates, attenuation.
Exceed design limit.
201009: TCP connection limit of number for host
IP_address on interface_name exceeded.
Address mapping error.
Fail address mapping.
737030: Unable to send IP-address to standby: address in use.
Layer2 Internet layer Network failure, network performance below the baseline.
Network failure.
105032: LAN Failover interface is down. Layer3 Transport layer Address translation problems. Address translation, translation fail.
202001: Out of address translation slots!
Domain name server (DNS) problems.
DNS fail.
331001: Dynamic DNS Update for 'fqdn_name' <=> ip_address failed. DHCP difficulty operating. DHCP configured fail. 737004: DHCP configured, request failed for tunnel-group 'tunnel-group.
SNMP contact problems.
SNMP unable to open.
212001: Unable to open SNMP channel (UDP port port) on interface interface number, error code = code
Access control list (ACL) problems.
ACL error, ACL configuration.
109020: Downloaded ACL has configuration error; ACE Layer4 Application layer Slow application performance. Application fail, application stopped. 505012: Module in slot slot, application stopped application, version version.
No network service available.
FTP fail, HTTP fail.
201005: FTP data
connection failed for IP_address IP_address
Phase Two (Syslog Messages Identification)
Phase two explains the procedures of how to identify syslog messages, which indicate to network problems for each network layer. Cisco syslog messages manual was used to identify related syslog messages. And the result could be applied to other syslog data from different vendors, as all vendors describe network problems using almost same terms and vocabularies. In this phase, the related messages have been identified depending on the symptoms and causes of network problems (phase one).The task of identifying related messages from syslog manual requires reading and searching the manual in order to extract them. This paper used the symptoms and the causes of each problem as key words to identify related messages.For example; Loss of connectivity, performance lower than baseline, high collision counts, attenuation, bad cable, disconnected cables, damaged cables, improper cable types and cable fails are the symptoms and causes of cable problems that indicate to problems in network access layer. These symptoms have been used as key words for searching in syslog manual. The following are the extracted messages that describe cable problems from Cisco manual:
%PIX|ASA-1-101001: (Primary) Failover cable OK. %PIX|ASA-1-101002: (Primary) Bad failover cable. %PIX|ASA-1-101003: (Primary) Failover cable not
connected (this unit).
%PIX|ASA-1-101005: (Primary) Error reading failover cable status.
The extracted messages have been used in the next phase for classification purposes. Table 1, illustrates problems of each network layer, the key words used for searching in syslog manual and message examples
Phase Three(Problems Classification)
1) Syslog Data Collection: The used data in this paper is the syslog messages that have been extracted from syslog manual, and indicate to network problems. This data used as training data set, to learn classification algorithm.
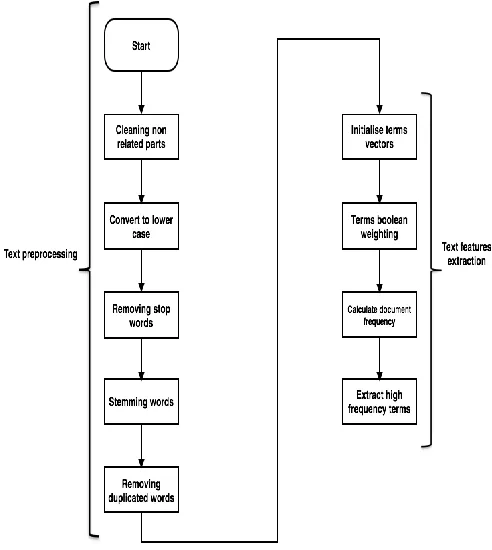
2) Syslog Data Preprocessing: The first step in text classification is to transform documents, which typically are string of characters, into a representation suitable for learning algorithm and the classification task [12]. Syslog data processing comprises four steps.
a. cleaning non- related parts: In general, syslog message consists of the many information; facility number, severity number, hostname, timestamp, and text message. Text message includes the related information to be classified. Therefore, the other information are non-related parts, and they were removed, before tha, each message is given a unique number as a reference. Then, tags, punctuate marks, etc. are removed from the text messages.
b. Removing stop words: A list of stop-words was created and used to be removed from syslog messages, this improves information retrieval and search by ignoring words that usually appear in every document and thus, are not helpful in classification process.
c. Stemming: It is used to group semantically related words to reduce the size of the dictionary (feature reduction) [13]. Porter Stemmer algorithm in java was used for removing suffix to generate word stem
d. Removing Duplicated Words: As the document frequency is the responsible factor for determining the features, there is no need for the duplicated words in the documents. Removing duplicated words from text documents decrease the word space of syslog files.
3) Syslog Data Representation:The most commonly used document representation is vector space model[11].Vector space modelwas used to represent syslog documents, where documents are represented by vectors of words. Usually, there is a collection of documents which is represented by a word-by-document matrix A, where each entry represents the occurrences of a word in a document, i.e. A = (atd), where a is the weight of word t in document d [12]. Boolean weighting has been used to determine the weight of words.
[image:4.612.332.542.48.241.2]Firstly, words dictionary, which contains all the words of relevant messages from the training sample, were extracted from documents (messages).
Fig. 2 Flowchart of syslog data classification stages
[image:4.612.68.287.50.237.2]Fig. 3 The flowchart of text pre-processing and featureextraction
[image:4.612.46.292.388.663.2]International Journal of Innovative Technology and Exploring Engineering (IJITEE) ISSN: 2278-3075, Volume-8 Issue-8S, June 2019
Vector space model (VSM) has been built to represent documents (d). A document d was represented by the weight of each dictionary term: V~(d) = (w(t1, d), w(t2, d), . . ., w(tn, d))
4) Feature Selection: In this stage, features were selected to represent syslog files. Features are the terms (words) that describe the problems in syslog messages. In this study we used Document Frequency Thresholding (DF) method to extract the important features from documents, which are the high frequency terms (words). Document frequency for a word is the number of documents in which the word occurs. Once the document frequency has been computed for each word, the words that document frequency less than the predetermined threshold are removed, as they are non-informative for category [12]. Java programming code was used to identify the best features that have high frequency among all documents, and generate ARFF files to be used in Weka data mining tool.
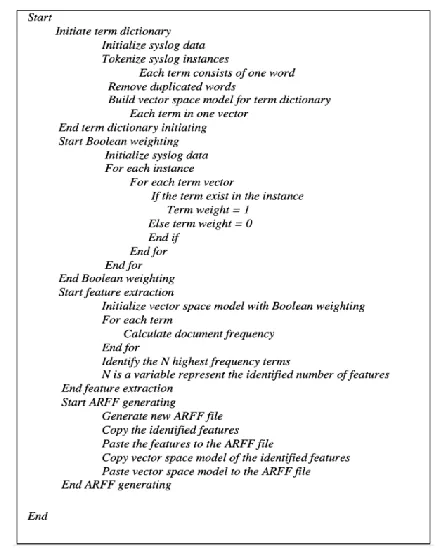
The factor of features number was changed many times for each file in order to apply classification algorithm, and compare the results to specify the best number of selected features. A java code was used to generate ARFF files with high frequency features, represented by Boolean weighting. ARFF is an attribute-relation file format, which is an ASCII text file that describes a list of instances sharing a set of attributes.The used data of ARFF files consists of two attributes: the document (syslog message) with string type and the class (layer1, layer2, layer3, layer4). Fig. 6, illustrates the pseudo code of generating ARFF file process.
Fig. 6 The pseudo code of generating ARFF fileprocess Implementing Classification Algorithm: This stage used ARFF files to learn classification algorithm. As we mentioned earlier, Support Vector Machine (SVM) algorithm is used in classification process. ARRF files were represented with different numbers of features, to train SVM classification algorithm. The classification process consists of two stages: training stage and prediction stage as shown in Fig.7.
[image:5.612.337.555.47.324.2]Training Stage: For the training stage, files of training dataset with different number of features were prepared. The training dataset came from the syslog messages extracted from Cisco syslog manual in phase two and processed (cleaned, removed stop words, stemmed, removed duplicated words).
[image:5.612.336.555.450.584.2]Fig. 5 An Example of Syslog Data BooleanRepresentation
Training dataset was in ARFF extension, to be used in Weka data mining tool. classification algorithm was applied many times using same dataset, but with different number of features. Results were compared to identify the best features, and the best classification model. Firstly, the algorithm was applied to four training data files with different number of features. The first training file represents the data using all features (terms of vector space). The second training file represents the data using 1000 features that had the highest frequency. The Third training file represents the data using 500 features that had the highest frequency.The fourth training file represents the data using 200 features that had the highest frequency
The accuracy rate was calculated, and the results were compared to identify the best number of features to be used for representing syslog data files. Accuracy rate indicates the ratio of correctly classified instances; the performance of classifier model would be better by scoring high accuracy rate. Accuracy rate was calculated using the following equation. accuracy rate = n / N(1)
Where n is the number of correctly classified instances, and N is the number of all classified instances.
Prediction Stage: Testing dataset, was processed and represented with 500 features in ARFF files; this 500 of features is the best number to be used as shown in the results of training stage.
IV. RESULTS Results of Training Stage
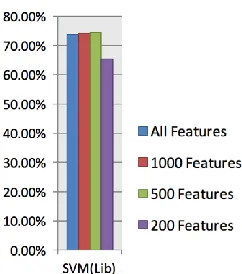
Training data set files with all features, 1000 features, 500 features and 200 features, were generated, firstly to be used for training stage to evaluate the performance of text classification algorithm. The results were obtained then compared to identify the best number of features and the best models. Training dataset which contains 263 instances (syslog message) was used in training stage. SVM algorithms was applied to the above training dataset files and performance rate –which is the accuracy rate- was expressed by the ratio of correctly classified instances for the classifier. The results of SVM algorithm performance, using above training datasets shown in Table 2. The performance values recorded from training file show that 500 features had the highest values, as the number of correctly classified instances were higher than the values of other files.
This means that this file contains the best number of features to be used for prediction stage.
Table. 2 Accuracy Rate of SVM Classifier Using Training Files Represented by Different Numbers of
Features
Training File SVM(Lib)
All Features 73.80%
1000 Features 74.10%
500 Features 74.50%
[image:6.612.375.496.52.189.2]
Two training dataset files were generated, one with 450 features and the other with 550 features. They were used to make sure that the file of 500 features contained the best features to be used in prediction stage. SVM algorithm was applied to the new two training dataset, and the performance was recorded by calculating the accuracy rate. The results were compared with the results of previous training dataset with 500 features. The result is shown in Table 3. The accuracy rate of the algorithm show less values when using training dataset files of 550 features and 450 features. This means that training dataset file with 500 features contained the best features to be used for prediction, as shown in Figure 9. Experiments results of training stage showed that the features of number 500, had the best performance
Table. 3 Accuracy Rate of SVM Classifiers Using Training Files Represented by Different Numbers of
Features
Training File SVM(Lib) 550 Features 71.10% 500 Features 74.50%
71.10%
Results of Prediction Stage
A testing dataset was obtained from network devices; it consists of 2610 instances (syslog message) from firewalls and switches devices involving a short period of time (less than one minute).
Fig. 8 Acuracy rate of SVM algorithm
[image:6.612.353.523.405.590.2]International Journal of Innovative Technology and Exploring Engineering (IJITEE) ISSN: 2278-3075, Volume-8 Issue-8S, June 2019
Testing dataset was preprocessed similar to training dataset (cleaned, removed stop words, stemmed, removed duplicated words). Testing data set file was generated with 500 features in ARFF format to be classified using Weka data mining tool. Table 4 shows the number of instances, classified into each layer with the percentage of all testing dataset sample, as the algorithm classified all instances into three classes (layer1, layer2, and layer3)
Table. 4 Prediction Stage Results
Algorithm layer1 layer2 layer3 layer4 LibSVM 172
(6.59%) 2383(91.30%) 55 (2.11%)
0 (0%)
[image:7.612.329.558.58.234.2]Syslog data contains information of all network events with various types and severity levels and almost all syslog messages are either informational or problem messages. Since classification algorithms classify all instances of testing dataset into specific classes, the results need to be analyzed deeply in terms of the probability rate of each classified instance, as a wayto identify informational instances and problems ones. Probability rate indicates to the proportion of accuracy that the classified instance relays to the specific class. Table 5 shows the range of probability rate of classified instances for results.
Table. 5 Probability Range of Classified Instances Algorithm layer1 layer2 layer3 layer4 LibSVM (72.20 -
32.80)%
(67.00 – 33.00)%
(89.90 - 36.20)%
0.00%
The result is divided into two parts: one for the lower probability to be validated as informational messages, and the other for the higher probability to be validated as problems messages. Each part is compared to the training dataset to validate the result.
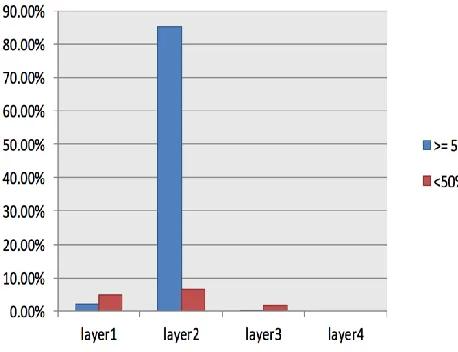
[image:7.612.45.298.377.420.2]The Table 6 shows the numbers of instances and their percentage with probability rate >= 50% and < 50% for each class.
Table. 6 Probability rate for classified instances probability layer1 layer2 layer3 layer4 >= 50% 49
(1.88%)
2218 (84.98%)
8 (0.31%)
0.00%
<50% 123 (4.71%)
165 (6.32%)
47 (1.80%)
0.00%
As shown in Table 6, layer1, and layer3 got small numbers of instances with probability rate <= 50%, but layer2 had large numbers of instances with probability rate >=50%; this is because of repeated messages for the same problem with one different word.
Results of Validation Phase
In the validation phase, results of prediction stage were analyzed to make sure that each instance belongs to its class, and it refers to a problem in one layer. Validation process was performed by comparing instances of each class to the corresponding training dataset. LibSVM classifier classified all instances of testing dataset into three layers- (layer1, layer2, layer3) - and as mentioned before, the classified instances for each layer were divided into two parts in terms of prediction probability. Instances with probability >= 50% were validated by comparing them to the corresponding training dataset. Instances with probability < 50% were validated as informational messages.
Layer1 Validation
The classifier had classified 49 instances with probability >= 50% , to layer1. These instances were compared to the instances belonging to class one in training dataset. Only three instances indicated network problem and the probability of them was > 70%.
These three messages described the problem of “ TCP connection to firewall server had been lost, restricted tunnels are now allowed full network access”. Repeated three times. By referring to syslog manual, this problem indicated that the TCP connection to the security appliance server was lost and this requires checking the server and network connections. This problem belongs to the first layer, which is network access layer, as mentioned in chapter two.
Layer 2 Validation
The classifier had classified 2218 instances with probability >= 50% , to layer2. These instances were compared to the instances belonging to class two in training dataset.
[image:7.612.49.299.551.616.2]From all classified instances, no instances had indicated any network problem. The probability of them was < 70%
Layer 3 Validation
The classifier had classified eight instances with probability >= 50%, to layer3. These instances were compared to the instances belonging to class three in training dataset. From all classified instances, one instance had indicated network problem. The probability of it was > 70%, this message described the problem of “No translation group found for protocol src”. By referring to the syslog manual, this problem was due to network address translation (NAT) not configured for the specified source and destination systems. This problem pointed to NAT issues that belong to the third layer, which is transport layer.
V. CONCLUSION
Network troubleshooting is one of the main aspects of network management, and the first step in the process is to detect the problems. This paper proposed a method to detect and classify network problems, in terms of network layers, by analyzing syslog data. In this paper, data mining tools, and text classification techniques were used to classify network problems. This paper used syslog data to learn SVM classification algorithm, and the results showed high accuracy rate, future works will focus on applying these results to a real syslog data using different classification algorithms.
REFERENCES
1. B. Vachon and R. Graziani, Accessing the WAN CCNA Exploration Companion Guide, 1st ed. USA: Cisco Press, 2008.
2. J. D. Sloan, “network management and troubleshooting” in Network Troubleshooting Tools, 1st ed. USA: O’Reilly, 2001.
3. A. Deveriya, Network Administrators Survival Guide., 1st ed. USA: Cisco Press, 2005.
4. T. Kimura, K. Takeshita, T. Toyono, M. Yokota, K. Nishimatsu, and T. Mori, “Network failure detection and diagnosis by analyzing Syslog and SNS data: Applying big data analysis to network operations,” NTT Tech. Rev., vol. 11, no. 11, 2013.
5. J. Manyika, M. Chui, B. Brown, J. Bughin, and R. Dobbs, Big data: The next frontier for innovation, competition, and productivity, 1st ed. McKinsey Global Institute, 2011.
6. W. Xu, L. Huang, A. Fox, D. Patterson, and M. I. Jordan, “Detecting large-scale system problems by mining console logs,” 22nd ACM SIGOPS Symp. Oper. Syst. Princ. SOSP, vol. 10, no. 7, p. 117, 2009. 7. T. Qiu, Z. Ge, D. Pei, J. Wang, and J. Xu, “What happened in my
network: mining network events from router syslogs,” in Proceedings of the 10th ACM, 2010, pp. 472–484.
8. K. Fukuda, “On the use of weighted syslog time series for anomaly detection,” in 12th IFIP/IEEE International Symposium on Integrated Network Management (IM), 2011, pp. 393–398.
9. M. Liu and J. Yang, “An improvement of TFIDF weighting in text categorization,” in International Conference on Computer Technology and Science (ICCTS), 2012, vol. 47, pp. 44–47.
10.S. R. Wilkins, Designing for Cisco internetwork solutions (Desgn) foundation learning guide, 3rd ed. Indianapolis: Cisco Press, 2012. 11.A. Genkin, D. D. Lewis, and D. Madigan, “Large-scale bayesian logistic
regression for text categorization,” Am. Stat. Assoc. Am. Soc. Qual., vol. 49, no. 3, pp. 291–304, 2007.
12.S. Hekmat, Communication networks. Línea] http://www. pragsoft.
13.F. Ag, S. Rakshit, and C. V. R. Nagar, “Feature selection using bag-Of-visual-words representation,” in 2nd IEEE International Advance Computing Conference (IACC), 2010, pp. 151–156.
14.Son, H.S., Lee, J.H., Kim, T.Y. and Lee, S.G., 2016. Network Traffic and Security Event Collecting System. In Proceedings of Second International Conference on Electrical Systems, Technology and Information 2015 (ICESTI 2015) (pp. 439-446). Springer Singapore.
15.[6] Pharmine data mining ”Data Mining Tool Comparison-Summary” http://voyagememoirs.com/pharmine/2008/05/18/summa.
16.[7] Zupan, B., & Demsar, J. (2008). Open-source tools for data mining. Clinics in laboratory medicine, 28(1), 37-54.