International Journal of Innovative Technology and Exploring Engineering (IJITEE) ISSN: 2278-3075, Volume-8 Issue-5S March, 2019
Abstract: With the recent developments and improvements in Extra High Voltage (EHV), circuit breakers, over voltages caused by energisation or de-energisation of lines can be made so low that the limiting factor determining the reduction in the line insulation might be considered the overvoltage produced by single line-to-ground faults. On lines insulated for levels below twice the normal line-to-ground crest voltage, such faults could develop into double line-to-ground faults, which would be particularly objectionable if single-pole switching were to be employed. This paper presents a mathematical analysis of transient due to fault initiation at any point on the double circuit Extra High Voltage transmission system, using the Fast Fourier Transform technique.
Index Terms: EHV transmission lines, Transient over voltages, Line-to-ground faults, Fast Fourier Transform.
I. INTRODUCTION
The construction costs of EHV lines are partially determined by the insulation levels which are based on the study of the transient overvoltage occurring on the line. The transient overvoltage may be caused by lightning, switching operations or faults. Among these, the overvoltage due to the switching and faults are dependent upon the system voltage. Hence, these overvoltage studies become important, previously, switching surges generally caused large over voltages compared with those caused by faults. However, the recent development in circuit breakers having multi-step resistance closing or synchronized pole-reclosure have enabled a reduction in switching surge over voltages to below 1,5 p.u. [1][2][3]. When such effective methods for controlling energisation or re-energisation are employed, the over voltages that arise owing to fault initiation may become the limiting factor. The problem of fault surges was brought into sharper focus when Kimbark and Legate [4] used the T.N.A. to study the overvoltage caused by single–line–to-ground fault on single circuit line, and they established that an overvoltage value more than 2 p.u. can theoretically occur in the sound phases.
Extended Method of Characteristics Approach was also used to simulate the internal over voltages on transmission lines [5].
Laplace transform method to evaluate fault transient over voltages has also been used [6].
Revised Manuscript Received on March 08, 2019.
Abdulhamza A.Hussain A.karim, Al-Mamoon University College, Department of Power Engineering, Iraq,
Realistic simulation of fault surges on single and double circuit uncompensated lines, using the modified Fourier Transform technique[7] in conjunction with the theory of natural mode[8] to incorporate the frequency dependant parameters of the line has been presented in [9,10].
In this present work, the modified Fourier Transform method has been used to study the fault transient on a double-circuit line, 400kV, 400 km Baghdad - Al-Qa’im line. The modeled line considered the mutual coupling between the two circuits and then the fault transient is evaluated taking into consideration the effect of the following factors: fault position, inception time, source parameters, line length and transposition.
II. LINEMODELLING
The basic line parameters are the series impedance [Z] and the shunt admittance [Y] matrices which are uniformly distributed along the line. Each element of [Z] varies with frequency and is determined by the conductor's type, their physical geometry and the nature of the earth plane. The basic parameters of the line are evaluated using the method of Galloway [11].
The transposition arrangement which has been simulated in the present work is shown in Fig. (1). in Section (I), a two port matrix equations can be written as:
1 1 1 1 1 1 1 1D
B
R R S S
I
V
C
A
I
V
Where,
TC B A c b a T C B A c b a T C B A c b a T C B A c b a
IR
IR
IR
IR
IR
IR
IR
R
V
R
V
R
V
R
V
R
V
R
V
VR
S
I
S
I
S
I
S
I
S
I
S
I
IS
VS
VS
VS
VS
VS
VS
VS
1 1 1 1 1 1 1 1 1 1 1 1 1 1 1 1 1 1 1 1 1 1 1 1 1 1 1 1
z
S
γ
S
z
;
Y
z
z
A
Y
D
;
Y
B
Y
C
z
S
)
(γ(γ
S
B
S
)
(γ(γ
S
A
-o o -o o o o o 1 1 1 1 1 1 1 1 1 1 13
sinh
3
cosh
Computation & Control of Transient Voltages in
Power System using Laplace Transform
Similarly the equation of Section II will be written as:
2 2 2 2 2 2 2 2D
B
IR
VR
C
A
IS
VS
(2)Re-writing Equ. 2 in terms of Section I constants yields:
' 2 ' 2 1 1 1 1 ' 2 ' 2D
B
IR
VR
C
A
IS
VS
(3) Where,
TB A C b a c T B A C b a c
IS
IS
IS
IS
IS
IS
IS
VS
VS
VS
VS
VS
VS
VS
2 2 2 2 2 2 ' 2 2 2 2 2 2 2 ' 2
' 2VR
andIR
2' are expressed in a similar manner. In order to have the same sequence of phases for Eqn. 3 as in Eqn. 2, the elements of matrices A1, B1, C1, and D1 are rearrangedto obtain the elements of the other section. Hence a transfer matrix (N) is used to simulate the change in positions from 1, 2, 3, 4, 5, 6 at the first section (Section I) to 3, 1, 2, 6, 4, 5 at Section II, respectively, giving the transfer matrix (N) as:
N
3
1
2
6
4
5
(4)Furthermore, A2 is determined from A1 values, thus:
A2(I,J)=(A1(N(I),N(J))
(5)
B2, C2, and D2 are calculated in a similar manner. The
transfer matrix for Section III is given by
N
1
2
3
1
5
6
4
(6)Also, Section III constants can be determined as follows:
A3(I,J)=(A1(N(I),N(J))
(7)
The constants B3, C3, and D3 are calculated in a similar
manner.
III. FAULTSIMULATION
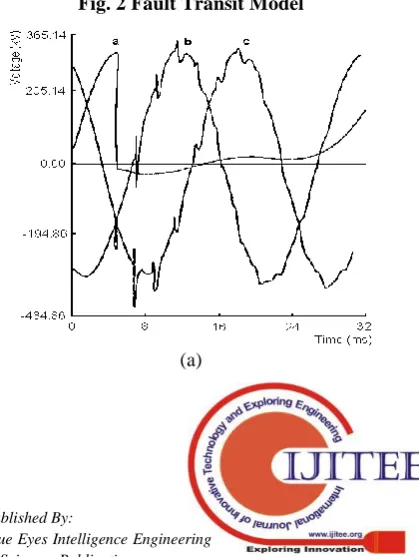
The principle of superposition is applied to simulate the fault on the transmission line. Initially the line is assumed to be at steady-state. The steps involved in the simulation of the fault initiation can be explained with the help of Figure 2, as follows:
A. At power frequency, the line parameters are calculated by considering each mode propagation, the multi-port equations representing each element in the system are formulated and voltages and currents at the point of interest are evaluated.
B. Fault transient analysis is based on the same theory. Line parameters are calculated by considering each mode of propagation at any given frequency, the multi-port equations describing the part of the system before and beyond the fault are formulated, which means that the line is simulated by two equivalent sections at the fault condition. Taking only two sections to simulate the line will decrease the computer storage needed for the program. These equations are then combined with the source-side network equation to yield a final two 2-port equations and the fault is simulated by a suddenly applied voltage source which equals in magnitude and opposite in polarity to the pre-fault voltage at the fault
C. The frequency spectrum of voltages and currents of interest is converted to the time domain using the inverse Fourier transform, and the overall system response is obtained by the sum of the pre-fault (steady state) response and the system response due to the fault condition.
IV. TRANSMISSIONLINEPARAMETERS
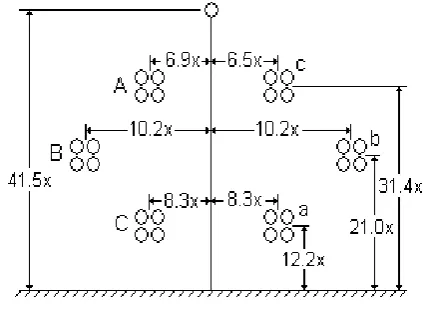
The 400 kV double-circuit transmission line Baghdad-Alqa`im, of the configuration shown in Fig. 3. Which has been chosen for the study. The line is fed at both ends by similar sources. The length of the line is 400km, the line parameters have been computed using the method of Galloway [11]. The earth resistivity is assumed to be 100 Ohm-m, a source reactance to resistance ratio of 30 at 50 Hz has been assumed for all cases. The line data is:
(a) Phase conductors are 4x54/7/0.33 cm with 0.305 cm bundle spacing.
[image:2.595.48.286.54.207.2](b) The earth wire is 54/7/0.33 cm. (c) Per-unit system: 1.00 p.u. = 326.6 kV
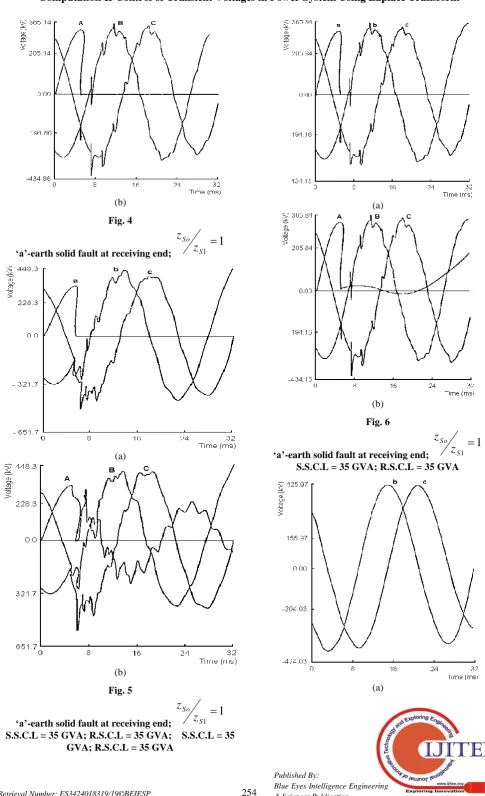
Fig. 3 The 400kV line configuration V. RESULTSANDDISCUSSIONS A. Effect of Fault Position
An extensive series of studies have revealed that in common with single circuit lines, the worst case overvoltage occur with faults is very close to the mid-point of the line. The worst case conditions can be determined, for practical purposes, from studies of faults exactly at the mid-point. The results presented relate to conditions on the (c) and (C) phases following an (a) phase to ground fault at maximum positive peak voltage on one circuit; the fault time is 5 ms. Fig. 4 shows the relation between the values of over voltages induced due to single-line-to-ground fault at phase (a) and the position of fault occurrence. Maximum over voltages of 1.708 p.u. and 1.51 p.u. are observed to occur in phase (C) and (c) respectively.
B. Effect of Fault Inception
[image:2.595.318.530.300.455.2]International Journal of Innovative Technology and Exploring Engineering (IJITEE) ISSN: 2278-3075, Volume-8 Issue-5S March, 2019
Figure 5 shows the expected over-voltages for solid fault at zero phase voltage, fault time is zero ms, of phase (a), and at the mid-point. The over-voltages occurred at phase (C) of the sound circuit are 1.3 p.u., Fig. 5(b), which means a difference of 30.8 per-cent between this case and that for fault at maximum peak voltage and a fault time of 5ms.
C. Effect of Source Parameters
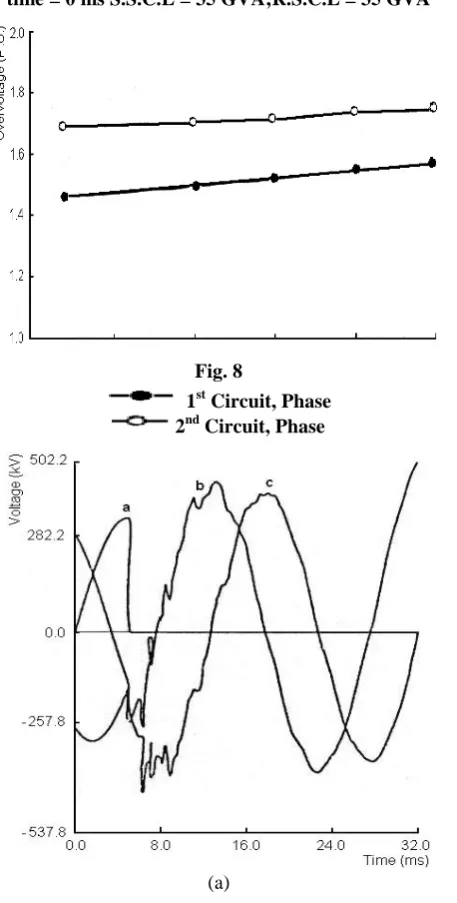
The position at which the highest overvoltage occurs depends on the relative capacities of the sources. In the case of faults on lines fed from similar capacity sources, the worst overvoltage occurs at the mid-point. Fig. 6 (a and b) show the over-voltages at both circuits for solid fault at the receiving end of the line which is fed from similar sources of 35 GVA. A maximum overvoltage of 1.28 p.u. occurs at phase (c) of the sound circuit and appears at the mid-point of the line. Now if the sending end source capacity is reduced to 5 GVA then for the same fault condition as in Fig. 6, the maximum overvoltage occurs at the point of the low capacity source of magnitude 1.36 p.u. on both phases (C)and (c) of both circuits as shown in Fig. 7.
For earth faults, the magnitude of the over voltages is effected by the magnitude of the zero sequence to positive sequence source impedance ratio as shown in Fig. 8. It is clear from this figure that the highest over voltages are for a ratio of one and reach a value of 1.708 p.u. and 1.51 p.u. for phases (C) and (c) respectively. Since the value of the ratio depends on the method of earthing, hence the value of the maximum over voltages induced in a transmission system during faults depend on the method of earthing.
D. Effect of Line Transposition
Using a complete cycle of transposition on the line, it can be seen from the results of Fig. 9, which is for a mid-point fault condition, that the maximum over-voltages occurring at phases(C) and (c) are 1.581p.u. and 1.565 p.u. respectively. This means that the maximum over-voltages in the case of a transposed line are reduced by nearly 8 percent as compared with those of the untransposed line.
VI. CONCLUSION
A general mathematical model for the analysis of transient voltages and currents on double circuit EHV transmission line is presented. The Fast Fourier transform technique is used for the study of a transient due to a single-line-to-ground fault on double circuit transmission line. The problem of fault surges following this type of fault is investigated. The fault is simulated by the application of a cancellation voltage source at the fault point. The solution is significantly simplified by using the superposition principle.
The line is represented by two sections resulting in a reduction in the required computer storage.
The results of the overvoltage studies are obtained taking into consideration the effect of a number of factors, such as the inception time, the ratio of the zero to positive sequence impedance of the source and the fault position.
Appendix
(a)
(b)
Fig. 1 (a) Complete cycle of transposition. (b) Transposed line model by (ABCD) constant
Fig. 2 Fault Transit Model
[image:3.595.331.541.549.828.2](b)
Fig. 4
‘a’-earth solid fault at receiving end;
1
1
S So
z
z
(a)
(b)
Fig. 5
1
So
z
z
(a)
[image:4.595.329.523.51.464.2](b)
Fig. 6
‘a’-earth solid fault at receiving end;
1
1
S So
z
z
S.S.C.L = 35 GVA; R.S.C.L = 35 GVA
International Journal of Innovative Technology and Exploring Engineering (IJITEE) ISSN: 2278-3075, Volume-8 Issue-5S March, 2019
[image:5.595.62.279.53.266.2](b)
Fig. 7 ‘a’-earth solid fault at midpoint; fault time = 0 ms S.S.C.L = 35 GVA;R.S.C.L = 35 GVA
Fig. 8
1st Circuit, Phase 2nd Circuit, Phase
(a)
[image:5.595.324.532.56.263.2](b)
Fig. 9 ‘a’-earth solid fault at midpoint; fault time = 0 ms S.S.C.L = 35 GVA;R.S.C.L = 35 GVA REFERENCES
1. A. Clerici, and A. Tashini," Overvoltage due to line energisation and re-energisation versus overvoltages caused by faults and fault clearing in EHV systems", IEEE Trans., vol. PAS 89, 1970, pp 932-939. 2. M. Sanaye – Pasand, M.R. Dadashzadeh and M. Kholayar, " Limltation
of transmission line switching overvoltages using switchsync relays ", Proc.Int. Conf. On Power systems Transients, Monteral, Canada, 2006, paper 87.
3. A. Hayati Soloot, A. Gholami, G. Agheb, A. Ghorbandaeipour, and P. Mokhtari, " Investigation of Transmission Line Overvoltages and their Deduction Approach ", world Academy of Science, Engineering and Technology, 29, 2009.
4. E.W. Kimbark, and A.C. Legate, "Fault surges versus switching surges a study of transient overvoltages caused by line-to-ground faults", Ibid, vol. PAS-87, 1968, pp 1762-1769.
5. B. Gustavsen, J. Mahseredjian, " Simulation of Internal voltages on Transmission Lines by an Extended Method of Characteristics Approach " IEEE Trans. Power Delivery, vol.22, pp 1736-1742, July, 2007.
6. M. S. Mamis and M. Kksal," Computational of transmission line transients by using Fast Inverse Laplace Transform", Mathematical and Computational Applications, vol. 2, no. 2, 1997, pp 61-69.
7. A. Ametanti," The application of Fast foruier transform to electrical transmission phenomena", Int. J. Elect. Educ., vol. 10, 1973, pp 277-287.
8. L. M. Wedepohl, and S.E.T. Mohammaed," Multi conductor transmission lines theory of natural modes and Fourier integral applied to transient analysis", Proc. IEE, 116, No. 9, 1969.
9. R. Malasubramanian and S. Gupta," Calculation of transient due to fault initiation on a double-circuit transmission lines" Proc. IEE, vol. 123, no. 6, 1976, pp 537-542.
10. A. T. Johns and R. K. Aggarawal, "Fault induced overvoltages on double-circuit EHV transmission lines" IEEE, Winter meeting, N. Y. , Feb. ,1978.
[image:5.595.59.288.296.748.2]