International Journal of Innovative Technology and Exploring Engineering (IJITEE) ISSN: 2278-3075, Volume-8 Issue-12, October 2019
Similarity Based Prediction System using Machine
Learning Algorithms in Big Data Analytics
M.Vanitha, P. Geetha, E. Ramaraj
Abstract: Big Data is a noteworthy environment to maintain the diversity of the huge amount of data. The big data utilizes machine learning algorithms to process large datasets which comes from various places such as histories, weblogs, and data repositories, large datasets and data warehousing, etc. In an existing method, most of the data mining approaches might not be able to maintain the large dataset. Using datamining, the big data are having lack of compatibility with database systems and analysis tools; large dataset clustering and analyzing is a big issue in big data. For this reason, the research work uses machine learning algorithms which are implemented in the Hadoop tool to collect and process the large amount of data which is structured, semi-structured or unstructured in a reasonable amount of time. Also, it gives more accurate prediction system and accurate information. Using Machine Learning Algorithm computational cost and complexities is minimized. The overall research work is implemented in the Hadoop tool with the help of the python programming language and it is compared with some existing algorithms. The proposed work tested with suitable parameters such as accuracy, Kappa T and Kappa M.
Keywords: Big Data, Machine Learning, SBPS, PCA-O, PERA.
I. INTRODUCTION
In the recent research environment, big data[1] is playing a major role to maintain high volumes of data. Many sectors are implemented a big data and analytics like Agricultural, Banking and Online Marketing, etc. It maintains three types of analysis processes such as Predictive analysis, prescriptive analysis and descriptive analysis. In general, these three analyses come from the word Data analysis process. In this, the Data analytical process is one of the difficult task, when large volume of data increases. To do the data analytical process, the big data use Machine Learning algorithms.
Machine learning algorithms help to improve automatically by machines through experiences. Machine Learning is the fastest emerging sector in the field of computer science. It creates many solutions in the field of big data. Many big data fields are benefitted through machine learning like data gathering, data classification, clustering, computer-aided diagnoses and disease predictions. There are two important processes are existing in big data, such as Online Transaction Processing (OTP) and Online Analytical Processing (OAP). An Online Analytical Process has been done by Machine Learning.
Revised Manuscript Received on October 05, 2019.
M.Vanitha, Research Scholar, Alagappa University Karaikudi Dr. P. Geetha, Associate Professor, Dr.Umayal Ramanatha College
for Womens, Karaikudi
Dr. E. Ramaraj, Professor and Head, Dept. of Computer Science Alagappa University, Karaikudi
In this research work, the machine learning algorithms [5] use some important algorithms such as Preprocessing of Knowledge Discovery Databases (KDD), principal component analysis (PCA) of Feature Extraction, Proposed Extremize Redundancy Algorithm [4] of Feature Selection. These algorithms are helping to bring the pure data, find missing values, remove noisy and redundant data, removing and reducing dimensionality of the data, and removing overfitting, etc. For this reason, it uses variables, components, values and parameters etc. to bring all accurate data and data prediction.
II. LITERATURE SURVEY
The author Yang Cong et. al. [1] describes a model for big data to control the overfitting problem which where comes under online similarity learning. The model provides simple and robust metric matrix for finding redundant rows and columns in the metric matrix. It also finds the remaining matrix to a low rank space. The work are implemented by the author is the reason of solving two issues such as feature redundancy and rank redundancy. It uses sparsity to reduce feature redundancy. It calculates SVD to find rank redundancy using low rank regularization. And also it helps to avoid overfitting. Simultaneously, their model removed irrelevant redundant feature dimension.
Mehrnoush Barani Shirzad et. al.[2] provides rank based information retrieval system. In this paper, they have used filter feature selection to perform the ranking. For this, they have used a method named as minimum Redundancy Maximum Relevance (mRMR) which selected the feature subset and similarity between them. And they reweight the component of mRMR to balance between importance and similarity.
Danasingh et. al.[3] provides a prediction system for decision making. The correct decision protects the data from the losses. The prediction is used a model which is referred as classifier. The classifier depends on the training datasets. In this, the training dataset reduced the accuracy of the classifier. The training datasets contain irrelevant features which are removed by unsupervised learning with ranking based feature selection (FSULR) of feature selection algorithm. FSULR algorithm eliminates redundant and irrelevant features with the help of clustering and eliminates irrelevant features using statistical measures of the training dataset.
III. PROPOSED METHOD
The Similarity Based Prediction System (SBPS) is proposed using Machine Learning Algorithms for Big Data analytics. The proposed method utilizes various machine learning algorithms which are used to predict the disease as well as get the accurate information. In
Pre-processing algorithm, Principal Component Analysis Algorithm for Overfitting (PCA-O), and Proposed Extremize Redundancy Algorithm (PERA). To do the implementation the proposed work uses 10,000 cancer records of the patients. The overall implementation is done by the Hadoop tool with the help of python language and it is tested by most significant parameters such as accuracy, Kappa T and Kappa M.
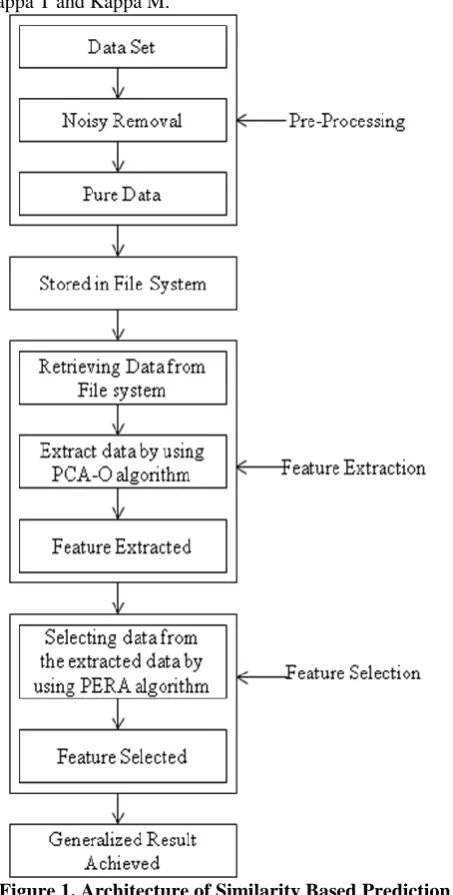
Figure 1. Architecture of Similarity Based Prediction System
The above figure 1 represents the architecture of Similarity Based Prediction System (SBPS). In this, the proposed SBPS can be helped to collect the data from various sites as follows web logs, web histories, databases, data warehouses and data repositories, etc.. Then the data can be pre-processed by using machine learning algorithms. The data cleaning process is started. As this sequence, the noisy data can be removed. And redundant data are identified and removed. By proposed method, the data is cleansed. The data cleansing process brings the pure data. The pure data is stored in the file system for further use.
PRE-PROCESSING
INPUT : Input Data Set OUTPUT : Pure Data
Step 1 : Noise removal and removing
special characters and missing values replaced
Step 2 : Initialize Row as 0 Step 3 : Reading file Step 4 : Increment row Step 5 : Count row Step 6 : Initialize Sum as 0 Step 7 : While line next Step 8 : If line next
Step 9 : Sum increment as next Step 10 : Line next
Step 11 : End if and while Step 12 : Value = sum / row
Step 13 : Missing value of the attribute as value.
Step 14 : File read Close
In this, the next step of the proposed method is feature extraction; is a process of dimensionality reduction. It helps to reduce the number of resources which is taken for processing without any loss of significant relevant information as well as it reduces the amount of data for a particular analysis which takes less time.
The feature extraction method proposed and utilized a new method called as the Principal Component Analysis Algorithm for Overfitting (PCA-O) to find the most accurate data with lesser time and fill the missing values as well as reduce the overfitting.
The PCA-O algorithm does following steps to reduce overfitting. In this, the first step is normalizing the data. It takes two dimensions X and Y, all X become 𝔁- and all Y become 𝒚- which is done by subtracting the respective columns. Finally, it gives a dataset which means zero. In the second step, the two dimensional dataset results are 2x2 covariance matrix such as [X1] = Cov[X1, X1] and Var[X2] = Cov[X2, X2]. The Third step of PCA-O is to calculate the eigenvalues and eigenvectors which are used to find covariance matrix. In this, If dt(ƛI - A ) = 0, ƛ is an eigenvalue of a matrix A. Similarly, if (ƛI - A )v = 0, for each eigenvalue ƛ, a corresponding eigen-vector v.
dt determinant of the matrix ƛ eigenvalue
A matrix v eigen-vector
In the fourth step of the PCA-O is used to select components and to form a feature vector. The PCA-O is used for reduction of the dimensionality of the eigenvalues and eigenvectors which comes under from largest to smallest positions. So it takes eigenvector corresponding to the highest eigenvalue and it selects the eigenvalues those are very suitable to do the analysis. After reduction of dimensionality the PCA-O algorithm form a feature vector. It is a matrix of vectors it is also known as eigenvectors those are simply represented by two vectors such as Feature Vector = (eig1, eig2). The final step of the PCA-O algorithm is used to perform form the principal components using following formula.
NewData = FeatureVectorT x ScaledDataT
Here,
NewData Matrix consisting of the
principal components
International Journal of Innovative Technology and Exploring Engineering (IJITEE) ISSN: 2278-3075, Volume-8 Issue-12, October 2019
eigenvectors
ScaledData Scaled version of original dataset
T Transpose of matrix which is created based on interchanging of rows and columns.
All the eigenvectors of a matrix are perpendicular to each other. In PCA the eigenvectors can be helped to reduce the dimension of the dataset.
Feature selection is the process of prediction variable or output those are contributed by the user. The feature selection uses machine learning algorithm for following purposes such as reducing the complexity of a model,
reduces training time, easy to interpret, reduces over fitting and improves accuracy. In this method feature selection method proposes a new approach named as the Proposed Extremize Redundancy Algorithm (PERA). PERA is used to select the features with high and low correlation with the class. In this, PERA uses two methods such as F-statistic and pearson correlations. The F-statistic provides continuous features which contain accurate correlations between classes. The Pearson correlation coefficient can be used to calculate correlations between features. Finally the pure and accurate data can be retrieved.
Feature Extraction and Feature Selection
INPUT : Pure Data Set
OUTPUT : Extracted Data
Step 1 : Initialize all the variables as double
Step 2 :
Step 3 : while line! =null
Step 4 : Variable dd, out
Step 5 : For (double dd: entry)
Step 6 : outt += dd/entry.length.
Step 7 : End For
Step 8 : return out
Step 9 :
Step 10 : double sum=0, aM=mean(a), bM=mean(b), dv=a.length-1.
Step 11 : For i to outt.length
Step 12 : For j to outt.length
Step 13 : sum += a(i)+aM * b(i)bm
Step 14 : If sum==0.0 then sum = val
Step 15 : End If, For (j)
Step 16 : return sum / dv
Step 17 : End For (j)
Step 18 : Covariance Matrix
Step 19 : double [] [] out = [mat.len][mat.len]
Step 20 : For I to out.length
Step 21 : For J to out.length
Step 22 : double[] dtA = mat[i]
Step 23 : double[] dtB = mat[j]
Step 24 : out[i][j]=cov(dtA,dtB)
Step 25 : End For (i) (j)
Step 26 : return out
Step 27 : Eigen Set
Step 28 : double[][] copy = input
Step 29 : double[][] q = [copy.length][copy.length]
Step 30 : For I to q.length
Step 31 : q[i][j]=1
Step 32 : End For
Step 33 : boolean done = false
Step 34 : While (done)
Step 35 : double[][] nMat=multiply(q[i],q[j])
Step 36 : If nMat – copy > 0.0000001
Step 37 : copy = nMat.
Step 38 : End If, For,While
Step 39 : double [][] data = covMat();
Step 40 : return eigen
Step 41 : double[][] vals = {eigen.values}
Step 42 : Eigen vectors and Values
Step 43 : For I to vals[0].length
Step 44 : int j =0
Step 46 : vals[j][i] = 1.0
Step 47 : double[][] fv = pc(10,eigen)
Step 48 : transpose(mul(pc, inttranspose))
Step 49 : double[][] k = transporse(mul(pc,inttransporse))
Step 50 : string dt = k.tostring
Step 51 : lin=k.substring(0.t.length()-1)
Step 52 : For I to length(k)
Step 53 : string tt = substring (k)
Step 54 : print tt.
Step 55 : End For
Step 56 : End While
Step 57 : Featured Data Achieved
After feature selection the machine learning algorithm can be used to perform the data transformation. In this, the proposed method can be generalized to the output results which means data is formatted from unstructured into a structured format. Finally, the exact and accurate data can be collected by the user as they need.
Generalized the output
INPUT : Extracted Data OUTPUT : Generalized Output
RUN()
Step 1 : Calculate values
Step 2 : Sacc = 0, skapm = 0, skapt = 0 Step 3 : for I 0 to size.accuracy Step 4 : Sacc = accuracies(i) Step 5 : skapm = kappams(i) Step 6 : skapt = kappats(i) Step 7 : End For
Step 8 : accuracies(i) = Sacc / size. Accuracies Step 9 : kappams(i) = skapm / size.kappams Step 10 : kappats(i) = skapt / size.kappats Step 11 : SD standard deviation Step 12 : sum = 0
Step 13 : for I 0 to size.data Step 14 : sum += (data(i) – 2.0)2 Step 15 : End For
Step 16 : return sum/data.size Experiments()
Step 1 : Initialize iAcc = -1, iKappam = -1, iKappat = -1, iCputime = -1, iRamHours = -1, iinstance = -1, index = 0
Step 2 : for s: split “,”
Step 3 : iAcc, iKappam, iKappat, iCputime, iRamHours, iinstance = ibdex
Step 4 : End for Step 5 : return index
Step 6 : for entry 0 to no of entries Step 7 : accuracies. iAcc
Step 8 : kappams. iKappam Step 9 : kappats. iKappat Step 10 : instance. Iinstance Step 11 : End For
IV. RESULTS AND DISCUSSION
In this part, the proposed method is implemented two algorithms such as PCA-O and PERA. To make the
implementation, the proposed work uses the Hadoop tool; is one of the significant tool to predict the disease/information in an effective way.
Hadoop software is one kind of big data tool which helps to allow distributed processing that processed the large data sets across collections of computers. During processing, it delivers faster and flexible data processing; provides the robust environment.
The proposed method of Similarity Based Prediction System is using effective algorithms such as Feature selection based on correlation, Feature selection based on χ2, Feature selection based on information gain, Feature selection based on gain ratio, Feature selection based on symmetric uncertainty and Feature selection based on unsupervised learning algorithm. To evaluate the results, the above said algorithms are used following parameters such as accuracy, Kappa M, and Kappa T which are most suitable to bring the results in an effective manner.
Feature selection based on correlation
FS-Cor
Feature selection based on χ2 FSChi
Feature selection based on information gain
FSInfo
Feature selection based on gain ratio
FSGaira
ReliefF ReliefF
Feature selection based on symmetric uncertainty
FSUnc
Feature selection based on unsupervised learning algorithm
FS(Us-L)
International Journal of Innovative Technology and Exploring Engineering (IJITEE) ISSN: 2278-3075, Volume-8 Issue-12, October 2019
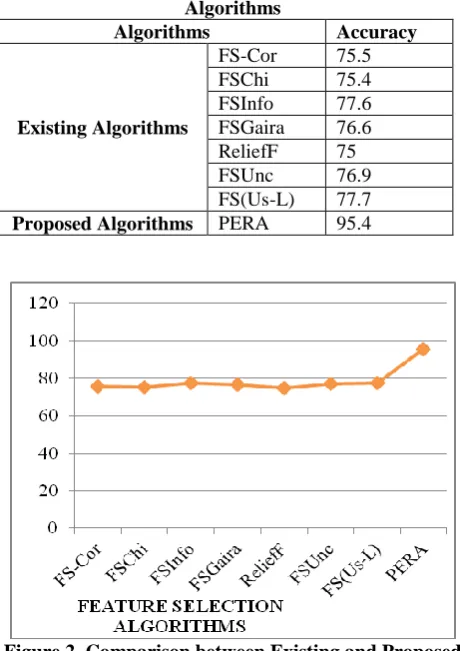
Table 1. Comparison between Existing and Proposed Algorithms
Algorithms Accuracy
Existing Algorithms
FS-Cor 75.5
FSChi 75.4
FSInfo 77.6
FSGaira 76.6
ReliefF 75
FSUnc 76.9
[image:5.595.52.283.64.390.2]FS(Us-L) 77.7 Proposed Algorithms PERA 95.4
Figure 2. Comparison between Existing and Proposed Algorithms of Feature Selection
Figure 2 displays the graphical representation of the existing and proposed feature selection algorithms which is tabled in table 1.
Table 2. Proposed PERA Algorithm
PERA Algorithm Values
Accuracy 95.4
Kappa M 87.78
kappa T 88.64
[image:5.595.61.278.602.758.2]The table 2 represents the value for the proposed PERA algorithm using the following parameters such as Accuracy, Kappa M, and Kappa T. The proposed PERA algorithm provides the output of accuracy is 95.4% correspondingly Kappa M produces 87.78% and Kappa T produces 88.64% of accuracy. Based on these the proposed algorithm produces better results than existing algorithms.
Figure 3. Proposed PERA Algorithm
Figure 3 shows the graphical representation of the figure for the proposed PERA algorithm. The value is
tabulated in table 2. Finally the proposed algorithm produces better results than existing feature selection algorithms.
V. CONCLUSION
This research work proposed new method named as Similarity Based Prediction System to fine most accurate data and remove irrelevant data. Because of these it develops two algorithms namely, PCA-O and PERA algorithms. These algorithms helped to find better accuracy than existing feature selection algorithms. The existing algorithms are compared with proposed algorithms which is produced good results. The proposed algorithm is tested with parameters like accuracy, kappa T and kappa M; produces the good results. In future, the research work can be extended to find and remove ranking redundancy and feature redundancy. Also, it measures some other statistical parameters.
REFERENCES
1. Yang Cong, Ji Liu, Baojie Fan, Peng Zeng, Haibin Yu and Jiebo Luo,
“Online Similarity Learning for Big Data with Overfitting”, 2332-7790 (c) 2016 IEEE.
2. Mehrnoush Barani Shirzad and Mohammad Reza Keyvanpour, “A
feature selection method based on minimum redundancy maximum relevance for learning to rank”, 978-1-4799-8733-7/15/$31.00 ©2015 IEEE.
3. Danasingh Asir Antony Gnana Singh, Subramanian Appavu Alias
Balamurugan, and Epiphany Jebamalar Leavline, “An Unsupervised Feature Selection Algorithm with Feature Ranking for Maximizing Performance of the Classifiers”, International Journal of Automation and Computing 12(5), October 2015, 511-517 DOI: 10.1007/s11633-014-0859-5.
4. Barnali Sahu, Satchidananda Dehuri, and Alok Kumar Jagadev,
“Feature selection model based on clustering and ranking in pipeline for microarray data”, Informatics in Medicine Unlocked 9 (2017) 107–122.
5. Xiaojun Chen, Member, IEEE, Guowen Yuan, Feiping Nie and
Zhong Ming, “Semi-supervised Feature Selection via Sparse Rescaled Linear Square Regression”, IEEE Transaction On Knowledge
Discovery And Data Engineering, DOI
10.1109/TKDE.2018.2879797, IEEE.
6. Andrea De Mauro, Marco Greco and Michele Grimaldi, “What is Big
Data? A Consensual Definition and a Review of Key Research Topics”, International Conference on Integrated Information (IC-ININFO 2014), AIP Conf. Proc. 1644, 97-104 (2015); doi: 10.1063/1.4907823.
7. D. P. Acharjya, Kauser Ahmed P, “A Survey on Big Data Analytics:
Challenges, Open Research Issues and Tools”, (IJACSA) International Journal of Advanced Computer Science and Applications, Vol. 7, No. 2, 2016.
8. Peter Richtárik and Martin Taká c, “Parallel coordinate descent
methods for big data optimization”, Math. Program., Ser. A (2016) 156:433–484 DOI 10.1007/s10107-015-0901-6.
9. Jianqing Liang and Qinghua Hu, “Semi-Supervised Online
Multi-Kernel Similarity Learning for Image Retrieval”, IEEE Transactions On Multimedia.
10. Foster Provost and Tom Fawcett, “Data Science and Its Relationship
To Big Data And Data-Driven Decision Making”, DOI: 10.1089/big.2013.1508, Mary Ann Liebert, Inc., Vol. 1 No. 1, March 2013 Big Data.
AUTHOR’S PROFILE
M.Vanitha is a Research Scholar in the Department of Computer Science at Alagappa University, Karaikudi and Distinction holder in M.C.A. Her Research Interest includes Big Data and Machine Learning.
Dr.P.Geetha is working as an Associate Professor in the Department of Computer Science at Dr. Umayal Ramanathan College for women, Karaikudi. Her Research Interest includes Data Mining, Network Security and Internet of Things. She has published 20 International Journals.
Dr.E.Ramaraj is working as th Professor and Head of the Department of Computer Science, Alagappa University, Karaikudi. He has the sound knowledge in many research fields especially in Data Mining, Network Security, Remote Sensing, and Big Data & Analytics. He has published more than 100 international journals.