This is a repository copy of Solidification morphology and phase selection in drop-tube processed Ni-Fe-Si intermetallics.
White Rose Research Online URL for this paper: http://eprints.whiterose.ac.uk/83569/
Version: Accepted Version
Article:
Cao, L, Cochrane, RF and Mullis, AM (2015) Solidification morphology and phase
selection in drop-tube processed Ni-Fe-Si intermetallics. Intermetallics, 60. 33 - 44. ISSN 0966-9795
https://doi.org/10.1016/j.intermet.2015.01.006
[email protected] https://eprints.whiterose.ac.uk/ Reuse
Unless indicated otherwise, fulltext items are protected by copyright with all rights reserved. The copyright exception in section 29 of the Copyright, Designs and Patents Act 1988 allows the making of a single copy solely for the purpose of non-commercial research or private study within the limits of fair dealing. The publisher or other rights-holder may allow further reproduction and re-use of this version - refer to the White Rose Research Online record for this item. Where records identify the publisher as the copyright holder, users can verify any specific terms of use on the publisher’s website.
Takedown
If you consider content in White Rose Research Online to be in breach of UK law, please notify us by
Solidification morphology and phase selection in drop-tube
processed Ni-Fe-Si intermetallics
Leigang Cao1,a, Robert F Cochrane1,band Andrew M Mullis1,c
1Institute for Materials Research, University of Leeds, Leeds LS2-9JT, UK.
aE-mail address:[email protected]
bE-mail address:[email protected]
cCorresponding author: Tel. +44 113 343 2568. Email address:[email protected]
Abstract
Drop-tube processing was used to rapidly solidify droplets of Ni64.7Fe10Si25.3 and
Ni59.7Fe15Si25.3 alloys. In the larger droplets, and therefore at low cooling rates, only two
phases, -Ni31Si12 and 1-Ni3Si were observed. Conversely, in the smaller droplets, and
therefore at higher cooling rates, the metastable phase Ni25Si9was also observed. The critical
cooling rate for the formation of Ni25Si9 was estimated as 5×10³ K s-1. SEM and TEM
analysis reveals three typical microstructures: (I) a regular structure, comprising single-phase -Ni31Si12 and a eutectic structure between -Ni31Si12 and 1-Ni3Si; (II) a refined lamellar
structure with a lamellar spacing < 50 nm comprising -Ni31Si12 and 1-Ni3Si; (III) an
anomalous structure with a matrix of Ni25Si9 and only a very small proportion of a second,
and as yet unidentified, phase. These results indicate that there is an extended stability field for Ni25Si9 in the Ni-rich part of the Ni-Fe-Si ternary system in comparison to the Ni-Si
binary system. With an increase of cooling rate, an increasing fraction of small droplets experience high undercoolings and, therefore, can be undercooled into the Ni25Si9 stability
field forming droplets consisting of only the anomalous structure (III). The Fe atoms are found to occupy different substitutional sites in different phase, i.e. Fe substitutes for Ni in the phase and Si in the L12( 1) phase respectively.
1 Introduction
The solidification of intermetallic compounds such as Ni3Si, Ni3Al and Ni3Fe has attracted
significant interest due to their attractive mechanical properties [1]; e.g. -Ni3Si displays a
high melting point, excellent oxidation resistance and high strength at elevated temperatures. However, like many intermetallics, limited room temperature ductility restricts potential application of these materials due to the difficulty in fabricating engineering components via conventional processing routes [2-5]. One potential route to overcome this difficulty is to form intermetallic-metal matrix composites by incorporating a ductile phase into the brittle matrix, or by solidifying a ductile phase directly from the parent melt, to form a so-called
in-situ composite [6-8]. Another potential route to improve this lack of formability is
non-equilibrium processing via rapid solidification. The resulting refined grain structure [9-11] and the presence of anti-phase domains resulting from the spontaneous ordering, in the solid-state, of initially disordered structures, gives rise to increased room temperature ductility and improved formability [12, 13]. Moreover, in this route, annealing subsequent to forming can restore the desirable high temperature mechanical properties of the intermetallic.
At the Ni-rich end of the Ni-Si phase diagram, which is shown in Fig. 1a, the main phases present are -Ni and the intermetallics -Ni3Si, -Ni31Si12 and -Ni2Si. The intermetallics
occurs in three forms, a low temperature polymorph, 1, which has the L12 crystal structure
(space group 221, Pm3m) and two high temperature forms, 2 (ordered) and 3(disordered),
both of which have the D022crystal structure (space group 139, I4/mmm). For completeness,
although not shown on the phase diagram, the metastable compound Ni25Si9 can also be
observed in Ni-rich Ni-Si alloys at high cooling rate. Ni31Si12 and Ni25Si9 are both
rhombohederal structures, belonging to space groups 150 (P321) and 147 (P3) respectively. Ni2Si is not considered further as it is not observed in this investigation.
A number of studies have been carried out into the non-equilibrium solidification of Ni-rich Ni-Si alloys, these being mostly on the eutectic composition, Ni-21.4 at.% Si [14-18]. The focus of these has been to understand the fundamental solidification processes occurring in these alloys. The direct solidification of -Ni3Si from a melt of the same composition has
been studied by Ahmad et al. [19], who performed undercooling experiments on a Ni-25.3 at.% Si alloy using a melting-fluxing technique. Based on the equilibrium phase diagram, with the
required undercooling, Ahmad et al. were unable to obtain single-phase -Ni3Si. Instead, at
all undercoolings, the solidification was always to a lamellar eutectic structure of single-phase -Ni31Si12and an Ni-rich lamellar consisting of a fine, eutectoid dispersion of -Ni and 1. In addition, for undercoolings in excess of 132 K small amounts of the high temperature 3-phase were observed uniformly dispersed throughout the sample. The direct formation of
the low temperature 1-phase direct from the melt was not observed, with the only source of 1 being the eutectoid decomposition of the supersaturated solid solution noted above. The
measured growth velocities were extremely low, with a maximum of 0.018 m s-1 being observed at the maximum undercooling of 160 K. This is consistent with the general trend revealed by previous studies on Ni-Si alloys, namely that the solidification velocity drops with increasing Si concentration [20, 21]. Ahmad et al. also noted an exceptionally high apparent viscosity in the melt and a general resistance to nucleation of the melt, both of which they attributed to Si acting as a network former in the melt at this composition. In addition, small amounts of the metastable phases Ni25Si9 were retained in the as-solidified
structure, despite the low cooling rate, estimated as < 10 K s-1.
Recently, Cao et al. [22-24] have extended the study of Ni-25.3 at.% Si alloys to high cooling rates using the drop-tube technique, wherein Ni25Si9 formed as the dominant phase for all
particle sizes, with -Ni31Si12 and 1-Ni3Si also being present. Moreover, they revealed an
hitherto unobserved 1- Ni25Si9 eutectic, which formed as both a regular lamellar and an
anomalous eutectic, depending upon the cooling rate and undercooling experienced by the droplet. At high cooling rates, the lamellar structure consisted of very fine alternating
lamellar of Ni25Si9(≈ 200 nm) and 1-Ni3Si (≈ 20 nm), with the fine lamellar spacing being
attributed to a very low diffusivity in the melt. This was in turn attributed to the existence of a covalently bonded Si-Si network. Moreover, they found that at the highest cooling rates an increasing fraction of droplets solidified to near single phase Ni25Si9. Given this formation of
single phase Ni25Si9, Cao et al. also took the opportunity to study the thermodynamic
properties of the Ni25Si9 phase by in-situ heating during XRD analysis and by DTA. This
showed the decomposition of Ni25Si9to 1and -Ni31Si12for temperatures in excess of 790 K.
The formation of Ni25Si9has not been observed during undercooling experiments on Ni-21.4
eutectic onto a chilled substrate, while Dutra et al. [25] found similar results using the melt-spinning technique. By analogy with these earlier studies, Cao et al. attributed the formation and retention of the metastable Ni25Si9 phase to the high cooling rates experienced during
drop-tube solidification processing. However, the initial composition of the melt, close to the stoichiometry of the Ni25Si9phase, would also favour its formation if long range diffusion in
the melt were suppressed by a low atomic mobility resulting from the high viscosity of the melt.
In the present work, the rapid solidification of Ni64.7Fe10Si25.3 and Ni59.7Fe15Si25.3 alloys was
studied in a 6.5 m drop-tube to investigate the phase formation and microstructural development in Ni-Fe-Si alloys at high cooling rates. Chemically, Ni and Fe are very similar, so direct substitution of Fe for Ni might be expected for samples doped with low concentrations of Fe. Fig. 1b is the Ni-rich corner of the Ni-Fe-Si ternary phase diagram at 1400 K, calculated using the CALPHAD software package MTDATA [26], with version 5.0 of the SGTE Solutions Database SGSOL. It is clear that both the Ni64.7Fe10Si25.3 and
Ni59.7Fe15Si25.3alloys are on the hypereutectic side of the - eutectic, the -Ni3Si phase being
suppressed by the presence of iron. This is also illustrated in Fig. 1c, which shows a pseudobinary isopleth diagram in which the end members are the Ni3Si and Fe3Si
compositions, also calculated, as above, using the MTDATA software. Complete suppression of the formation of can be observed for Fe concentrations in excess of 6.5 at.%. Therefore, the predicted solidification path would be for single phase to form first, which will lower the Si concentration of the remaining liquid until this equals the eutectic composition, wherein the residual liquid will solidify to the - eutectic structure.
2 Experimental
Master alloys of the required composition were prepared by arc-melting the elemental constituents (purity = 99.99% Ni, 99.999% Si and 99.9% Fe) under a protective argon atmosphere. The arc-melting process was repeated 5 times to ensure uniform mixing of the final sample.
times prior to melting to ensure the tube was thoroughly flushed. Melting of the alloy was by induction of heating of a graphite susceptor enclosing the alumina crucible, with temperature determination by means of an R-type thermocouple inside the crucible. When the desired superheat was achieved the melt was ejected by pressurising the crucible with 0.4 MPa of N2
gas. Spherical droplets, with diameters in the range of 53-850 m, were collected at the bottom of the drop-tube and classified into standard size ranges by sieving. The sizes of the sieves used here were 850 m, 500 m, 300 m, 212 m, 150 m, 106 m, 75 m and 53 m.
Particles of each size range were hot mounted using Transoptic resin. The mounted samples were ground flat using a series of progressively finer SiC papers, starting with 240, 400, 800 and lastly 1200 grit, with optical microscopy being used to check the quality of the surface finish at each stage. Once the samples were appropriately ground they were polished using 6 m, 3 m, 1 m and 0.25 m diamond paste. The samples were washed using dilute detergent and methanol and then dried using hot air between each polishing step.
Phase identification was undertaken on mounted and polished samples by X-ray diffraction using a Philips PANalytical Diffractometer with Cu K radiation. However, particularly for the largest particles, we are unable to guarantee that the mounted particles do not have any preferred orientation, and for this reason the analysis is considered as qualitative only, that is we have identified the phases present but have not attempted to undertake Rietveld refinement in order to estimate the volume fractions of those phases. Instead, in the present work, the phase formation and overall structural evolution were studied by the combination of XRD, SEM and TEM analysis. The composition of the polished samples was characterized using EDX detection mounted on a LEO 1530 Gemini FEGSEM and by microprobe analysis (Jeol 8230). Once composition analysis was complete the polished samples were etched using a mixture of Hydrofluoric Acid (5ml), Hydrogen Peroxide (5ml) and water (30ml) to reveal the microstructure for further SEM analysis. FIB was used to prepare TEM specimens, which were subsequently analysed using an FEI Tecnai F20 FEG-TEM.
3 Results
3.1 XRD Analysis
Fig. 2 shows the XRD patterns for the Ni64.7Fe10Si25.3alloy as a function of particle size. It
can be seen that the -Ni31Si12phase is observed in the XRD patterns for all particle sizes. For
indexed to the reflections of the metastable phase Ni25Si9. A similar result is also observed in
the Ni59.7Fe15Si25.3alloy, the XRD patterns for which shown in Fig. 3. Again, the presence of
-Ni31Si12is observed in all size fractions, while the presence of Ni25Si9 is noted only in
relatively small particles (53-150 m). However, the relative peak intensities for Ni25Si9 in
the 53-106 m size fraction of the Ni59.7Fe15Si25.3alloy are much stronger than that for the
Ni64.7Fe10Si25.3 alloy, which might imply a higher fraction of the Ni25Si9 phase in the
Ni59.7Fe15Si25.3alloy. This will be explored further using SEM and TEM analysis. There is
one common problem in the XRD analysis of both alloys, namely that it is difficult to distinguish the -Ni and 1-Ni3Si phases, both phases having the same cubic structure, with
the lattice constants being a=3.5244 Å and 3.5050 Å, respectively. Therefore, differentiation of these two phases has been undertaken using TEM. We note that if it is the phase being observed the result would be consistent with the equilibrium phase diagram.
3.2 Microstructure and Phase Identification
Microstructural analysis reveals that, irrespective of the alloy system, all droplets can be classified as containing one or more of three typical microstructures. As shown in Fig. 4, these comprise: (I) a regular structure consisting of a single phase and a eutectic structure; (II) a refined lamellar structure; (III) an anomalous structure with a fine phase dispersed in a single phase matrix. To confirm the origin of these three different structures, FIB was used to prepare two TEM specimens, as shown in Fig. 5, one for the regular structure and the other for the fine lamellar and anomalous structures, in a droplet in which these two structures were found to co-exist. TEM selected area diffraction patterns confirm that the bulk phase (I1) and
one of the eutectic phases (I2) found in structure I is -Ni31Si12 (Fig. 6). A selected area
diffraction pattern from I3, the other component of the eutectic structure present in
morphology I, displays super-lattice spots (Fig. 6b). This indicates that I3 is the ordered L12
phase and not the phase expected from the equilibrium phase diagram. Here, by analogy with the Ni-Si binary system, we label it as the 1 phase. A further selected area diffraction
pattern analysis confirms that the wide band (I4) in the fine lamellar structure (morphology II)
is also -Ni31Si12 (Fig. 7a), while the matrix-phase (I5) in the anomalous structure
(morphology III) is identified as the metastable phase, Ni25Si9, as shown in Fig. 7b.
For both the Ni64.7Fe10Si25.3 and Ni59.7Fe15Si25.3alloys, all of the large droplets (212-850 m)
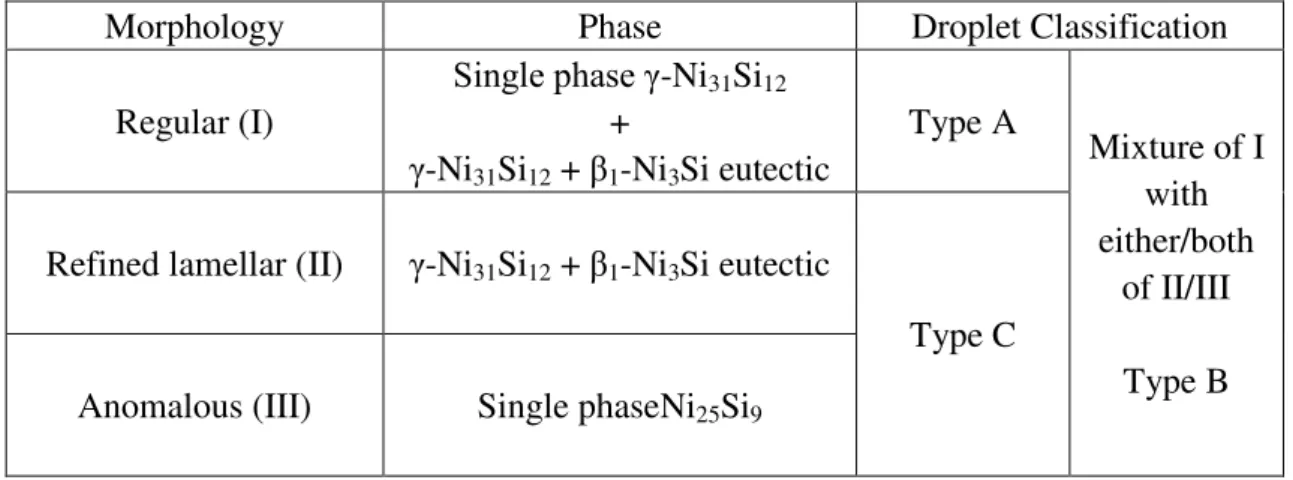
mixed structure comprising morphology I together with morphologies II and/or III (Fig. 8 – Fig. 10) or comprise only the anomalous structure, III (Fig. 11). In order to understand the microstructural evolution with increasing cooling rate, the droplets were classified into three different categories (A, B and C) according to microstructural characteristics which were easy to distinguish under optical microscopy and for large number of particles. Type A droplets are defined as comprising only the regular structure (I). Type B droplets present mixed structures, comprising morphology I, together with one, or both, of morphologies II and III. Type C droplets comprise only the anomalous structure, III. However, because it is difficult to distinguish mixed structures comprising morphologies II and III (Fig. 10) under optical microscopy, these droplets were also classified as type C. This information is summarised in Table I.
The fractions of these three types of particles have been counted. The numbers of particles counted for the Ni64.7Fe10Si25.3alloy were 463 (150-212 m), 514 (106-150 m), 2182
(75-106 m) and 1844 (53-75 m), while the numbers for the Ni59.7Fe15Si25.3alloy were 219
(150-212 m), 505 (106-150 m), 692 (75-106 m) and 1909 (53-75 m). The count results are shown in Fig. 12a.
For the Ni64.7Fe10Si25.3alloy, the fraction of type A particles is 100% in the large size ranges
(212-850 m), decreasing slightly to 98.5 % for the intermediate size fraction (150-212 m) and then dropping rapidly to 28.69% for the smallest size range (53-75 m). Correspondingly, the fraction of type B droplet increases from 1.5% (150-212 m) to 31.21% (53-75 m) for these intermediate to small diameter droplets. Type C particles are first observed in the 106-150 m size range, with the fraction present being 8.56 %. This increases to 39.1% for the 53-75 m diameter particles. For the Ni59.7Fe15Si25.3alloy, the fraction of type A droplet
follows a similar trend, namely that 100% of the coarsest particles (212-850 m) display only morphology I reducing to 14.82% for the finest particles (53-75 m). The total fraction of type B and C particles increases as the diameter decreases, this being 66.62% in the 75-106 m size range and reaching to 85.17% for the smallest particles (53-75 m). In contrast to the results found for the Ni64.7Fe10Si25.3 alloy, the fraction of type C particle increases
From the above analysis it is clear that the metastable phase Ni25Si9 is restricted to the
anomalous structure III. This is a constituent of the type B and type C droplets, it being the dominant morphology in this latter droplet type. Therefore, the count result, displaying an increasing fraction of type B and C droplets with decreasing particle size, irrespective of the alloy composition, is consistent with the strong intensity of the Ni25Si9 peaks in the XRD
patterns for the small droplets. Conversely, peaks for Ni25Si9 are not observed in the XRD
patterns of droplets in the 106-850 m size range for Ni64.7Fe10Si25.3 alloy and in the 150-850
m size range for Ni59.7Fe15Si25.3alloy. We note from Figure 12a that there is microstructural
evidence for the presence of low levels of Ni25Si9(identification of Type C droplets) in some
of the larger size fractions (e.g. 150-212m) when the presence of this phase is not apparent in the XRD patterns from these size ranges. Indeed, from Fig. 12a we would judge that the sample needs to contain > 30% Ni25Si9 by volume before a clear XRD signature is
discernable. This is probably related to the two characteristic peaks at 46.4° and 46.9°
corresponding to high order reflections (<1 1 4 > and <3 0 0> respectively). We also note the higher prevalence of type C droplets in the Ni59.7Fe15Si25.3alloy, which is consistent with the
stronger Ni25Si9diffraction peaks for this composition.
On the basis that the Type C droplets are almost exclusively Ni25Si9(taken as (96 ± 2)%) and
from a visual estimate that on average the Type B droplets contain (10 ± 5)% Ni25Si9, we
have estimated in Fig. 12b the variation in the Ni25Si9content of the droplets as a function of
diameter and composition. The error bars reflect our uncertainty in assigning the volume fraction of Ni25Si9to the particular droplet morphology (Type B or C) and where no error bar
is shown this is because it would be smaller than the plotting symbol used.
The microstructures of the 150-212 m diameter droplets for the Ni64.7Fe10Si25.3 alloy have
The fine lamellar structure (II) is only rarely found in particles of the Ni59.7Fe15Si25.3 alloy,
wherein the type B droplets mainly consist of the morphologies I and III. Moreover, the 150-212 m diameter particles of the Ni59.7Fe15Si25.3 alloy show a slightly different
microstructural evolution, with a tendency for a transition direct from morphology I to morphology III and with less prevalence of morphology II, the refined lamellar structure.
3.3 EDX Analysis
The average elemental compositions of the bulk droplets, together with the local composition of the -Ni31Si12 phase were measured using EDX. In each size range, area scans on at least
10 random particles were performed to determine the bulk average composition. To determine the composition of -Ni31Si12, 20 spectra were obtained from different grains. Fig.
15a shows the results for the Ni64.7Fe10Si25.3 alloy, indicating that the average composition of
droplets in all size fractions are similar, with the average composition being 10.57 at.%, 25.07 at.% and 64.36 at.% for Fe, Si and Ni respectively. These are consistent with the nominal composition of the alloy to within the expected experimental uncertainty associated with EDX determination. The compositions of the -Ni31Si12phase in all size fractions of the
type A droplets are also very similar, with the average values being 6.99 at.%, 27.15 at.% and 65.86 at.% for Fe, Si and Ni respectively. We note that the Si composition is higher than that of the melt but close to the stoichiometry of the -Ni31Si12 phase and that the Fe
composition is lower than that of the melt. A similar result is observed for the Ni59.7Fe15Si25.3
alloy, as shown in Fig. 15b. The average composition of the droplets is 15.65 at.%, 24.83 at.% and 59.52 at.% for Fe, Si and Ni, again very close to the nominal composition of the melt. The Fe composition of the -Ni31Si12 phase is 11.32 at.%, which is again lower than that of
the melt. However, the Si composition of the -Ni31Si12 phase is 27.01 at.%, which is higher
than that of the melt and close to the stoichiometry of the -Ni31Si12phase. These results are
consistent the substitution of Fe for Ni in the -phase.
For the droplets of the Ni64.7Fe10Si25.3alloy the composition of the eutectic area in the regular
structure was checked by Microprobe analysis, with 15 different areas being analysed. The Si composition was determined as 20.63 at.%. The Fe composition is 19.11 at.%, indicating that surplus Fe accumulates in the eutectic areas. A similar result is observed in Ni59.7Fe15Si25.3
alloy, as shown in Fig. 16a.
at.%, 24.95 at.% and 59.47 at.% in the Ni59.7Fe15Si25.3 alloy respectively. This indicates that
the composition of the anomalous structure is close to the composition of the respective bulk alloy. This is consistent with the identification that the matrix of the anomalous structure is single-phase Ni25Si9(with Fe substituting for Ni). Line scan results for adjacent regions of the
anomalous and regular structures (Fig. 16b), show that the average Ni, Fe and Si composition of the metastable phase is in between the average values of the gamma phase and the eutectic area.
4 Discussion
According to the XRD diffraction patterns, only the -Ni31Si12 and 1 phases are formed in
the larger droplets, while the additional phase Ni25Si9 is formed in the smaller droplets. This
is in contrast to the results for drop-tube solidified Ni-25.3 at.% Si alloy, wherein Ni25Si9
formed as the dominant phase in all size ranges. The formation of the metastable phase Ni25Si9 in Ni-Fe-Si alloys has not previously been reported and indicates that there is an
extended Ni25Si9 stability field in the Ni-rich part of the Ni-Fe-Si phase diagram at high
undercoolings, and/or high cooling rates. Unfortunately, due to the lack of thermodynamic data relating to the Ni25Si9 phase, it is not possible to perform any form of CALPHAD type
calculation to elucidate the influence of Fe on the stability of Ni25Si9. However, the results
presented here, particularly those in Figures 12a and b, would suggest, perhaps somewhat paradoxically, that low Fe concentrations are rather more effective at suppressing the formation of Ni25Si9than are higher concentrations.
As can be seen in Fig. 4, the regular structure (I) seems superficially to be as expected from the equilibrium phase diagram, i.e. for a hyper-eutectic composition we observe single phase regions and a eutectic. TEM analysis confirms that the single phase regions (I1) and one of
the phases (I2) in the eutectic are . According to the equilibrium phase diagram, the other
phase, I3, in the eutectic should be -Ni. However, the TEM diffraction pattern from the
phase I3displays super-lattice reflections, which identifies I3as the L12( 1) phase and not
-Ni. Unfortunately, the individual phases within the eutectic structure are too fine to make reliable composition measurements. However, the bulk average composition of the eutectic structure in the droplets of the Ni64.7Fe10Si25.3alloy can be determined and is 60.27, 19.11 and
phase. High resolution TEM images allow us to estimate the volume ratio of the phases L12:
as 1.2±0.2, wherein we would estimate the composition of the L12region via a mass balance
calculation to be 25.75±1.34 at.%, 17.18±0.69 at.% and 57.07±0.65 at.% for Fe, Si and Ni respectively. With reference to the ternary phase diagram, an alloy with this composition would be within the -Ni stability field. However, the eutectic formed here is between and
1, which suggests that under rapid cooling Fe stabilises the formation of the L12 ( 1) phase.
Moreover, noting the Si content is 17 at.%, we would surmise that there must be some substitution of Fe for Si in the L12phase.
The formation of the L12 phase in Ni-rich Ni-Fe-Si alloys has previously been studied by
Himuro et al. [27, 28], who observed that the L12 phase precipitated from the matrix by
aging of a Ni60Fe30Si10 alloy for short periods. They also studied the solidification behaviour
of Ni75Fe15Si10 and Ni75Fe13Si12 alloys wherein, clear evidence for the substitution of Fe for
Si, rather than Ni, was found. Himuro et al. suggested that in the Ni-Fe-Si system, Fe atoms occupy different substitutional sites depending upon the alloy composition, i.e. Fe atoms occupy the Si sites in the composition region around 75 at.% Ni, but substitute for Ni atoms otherwise. They, therefore, attributed the formation of the L12ordered phase to the fact that
Fe atoms have a tendency to mainly substitute for Si in the Ni3Si phase, and consequently, the
L12 phase was represented by Ni3(Si, Fe) in their work. This is consistent with our
observation that the L12phase formed instead of -Ni at the relatively low Si composition of
17.18 at.%. This would imply that in the Ni64.7Fe10Si25.3 alloy studied here, the L12 phase
formed with approximately 1 in 3 of the Si sites occupied by Fe atoms. We note however, that there is no evidence for the substitution of Fe for Si in the -Ni31Si12phase, the measured
Si compositions being 27.15 at.% and 27.01 at.% for the Ni64.7Fe10Si25.3 and Ni59.7Fe15Si25.3
alloys respectively, both of which are close to the stoichiometry of -Ni31Si12 (27.91 at.%).
Instead, these results appear to indicate the substitution of Fe for Ni, and not Si, inwhich is consistent with the chemical similarity of Fe and Ni. TEM analysis confirms that the L12
phase obtained in the present work is single phase (Fig. 17), i.e. we are not seeing a mixture of the and L12 phases, which would skew the estimated composition analysis for the L12
In terms of the droplet morphologies observed, as opposed to the phases present, a fairly straightforward picture may be put forward. The largest droplets will experience both low cooling rates and, therefore, relatively low undercooling. Near equilibrium solidification is experienced which, for a hypereutectic alloy, will result in the growth of single phase followed by solidification of the eutectic. These are the droplets we have categorised as Type A. The caveat however is that, as discussed above, the eutectic formed is between and , rather than between and , as would be expected from the equilibrium diagram. Conversely, the smallest droplets will experience the highest cooling rates and, therefore on average, also high undercooling, wherein the melt may be undercooled directly into the Ni25Si9 stability
field. Given the proximity of the Ni25Si9stoichiometry (26.47 at.% Si) to the composition of
the melt, solidification to (near) single phase Ni25Si9 results. These are the droplets we have
categorised as Type C.
The most complex microstructural evolution is observed in droplets in the intermediate size range, wherein a range of mixed structures arises (Type B droplets). Here, we attribute this variation to the interplay of cooling rate and undercooling. To a good first approximation, droplets of the same size will be subjected to the same cooling rate. However, it is not true that all droplets of the same size will solidify at the same undercooling, as this is controlled by nucleation which is a stochastic process. Solidification of the liquid might be catalysed by a potent nucleation site, such as an oxide, and in such cases, deep undercooling would not be expected. However, the catalytic effect of active nuclei can be restricted by dispersing the liquid into a large number of small droplets that solidify individually [29], as is the case in the drop-tube. In this stochastic process, a range of undercoolings will result. At a given particle diameter an upper limit to the undercooling achieved can be estimated from the average nuclei density in the melt according to the model of [20], but many droplets will achieve a much lower undercooling. Estimates of the cooling rate and undercooling in the drop-tube environment are given in Fig. 18, with the parameters used in this calculation being given in Appendix 1. Within the intermediate size ranges droplets may experience both high (Type C) and low (Type A) undercooling as well as those displaying mixed morphologies (Type B).
significantly prior to the growth front reaching it, thereby activating more nuclei in the melt. In this model the mixed structures I and III would result from independent, but near simultaneous, multiple nucleation events. Furthermore, the refined lamellar structure might result from the solidification of the remaining liquid, resulting in the mixed structure of types I, II and III. There are also some droplets containing a small fraction of the refined lamellar structures, which are surrounded by a large fraction of the anomalous structure, as shown in Fig. 10. This might imply that, in the final stage of the anomalous structure formation, the solidification converted to the growth of the refined lamellar structure.
5 Conclusions
Ni64.7Fe10Si25.3 and Ni59.7Fe15Si25.3alloys have been rapidly solidified from their parent melts
by drop-tube processing, wherein the following conclusions can be derived from the present work.
1) In both the Ni64.7Fe10Si25.3and Ni59.7Fe15Si25.3alloys, the metastable phase Ni25Si9was
obtained for droplets < 212 m in diameter, with the corresponding critical cooling rate being 5.1 × 10³ K s-1. This indicates that there is an extended stability field for Ni25Si9in the Ni-rich part of the Ni-Fe-Si ternary phase diagram.
2) Three typical microstructures were observed with decreasing particle size (and therefore increasing cooling rate). (I) a regular structure consisting of single phase
and a eutectic between the and 1-Ni3Si phases; (II) a refined lamellar structure with
wide (50 nm) bands of -Ni31Si12 and narrow (< 10 nm) bands of 1-Ni3Si (III) an
anomalous structures consisting of a matrix of the metastable phase Ni25Si9with small
inclusions of another, as yet unidentified, phase.
3) With decreasing droplet size an increasing fraction of droplets experience high undercoolings and therefore can be undercooled into the Ni25Si9 stability field,
forming the anomalous structure.
4) The Si compositions of the single phase -Ni31Si12 regions in the Ni64.7Fe10Si25.3 and
Ni59.7Fe15Si25.3alloys are the same, being 27.15 at.% and 27.01 at.%, and are close to
the stoichiometry of the phase, while the corresponding Fe compositions are different, being 6.99 at.% and 11.32 at.%. This appears to indicate the substitution of Fe for Ni, and not Si, in the -phase. Conversely, Fe appears to stabilise the L12phase
Acknowledgements
The authors acknowledge financial supports of the China Scholarship Council (CSC) – University of Leeds scholarship program.
Appendix 1
The physical parameters of the gas and alloy used to calculate the cooling rate and undercooling are given in Table 2.
6 Reference
[1] Miura S, Ohkubo K, Mohri T. Mechanical properties of Co-based L12 intermetallic
compound Co3(Al,W). Mater trans 2007; 48: 2403-8.
DOI:10.2320/matertrans.MAW200734
[2] Fleischer RL. High-strength, high-temperature intermetallic compounds.J Mater Sci 1987; 22: 2281-8. DOI:10.1007/BF01082105
[3] Schulson EM, Briggs LJ, Baker I. The strength and ductility of Ni3Si. Acta Metall
Mater 1990; 38: 207-13. DOI:10.1016/0956-7151(90)90050-Q
[4] Stoloff NS, Liu CT, Deevi SC. Emerging applications of intermetallics. Intermetallics 2000; 8: 1313-20. DOI:10.1016/S0966-9795(00)00077-7
[5] Takasugi T, Suenaga H, Izumi O. Environmental effect on mechanical properties of recrystallized L12-type Ni3(Si,Ti) intermetallics. J Mater Sci 1991; 26: 1179-86.
DOI:10.1007/BF00544452
[6] Ward-Close CM, Minor R, Doorbar PJ. Intermetallic-matrix composites-a review. Intermetallics 1996; 4: 217-29. DOI:10.1016/0966-9795(95)00037-2
[7] Yang JM. The mechanical behavior ofin-situNiAl-refractory metal composites. JOM 1997; 49: 40-3. DOI:10.1007/BF02914401
[8] Milenkovic S, Caram R. Effect of the growth parameters on the Ni–Ni3Si eutectic
microstructure. J Cryst Growth 2002; 237-239: 95-100. DOI:10.1016/S0022-0248(01)01875-9
[9] Herlach DM. Non-equilibrium solidification of undercooled metallic melts. Mater Sci Eng R Rep 1994; 12: 177-272. DOI:10.1016/0927-796X(94)90011-6
[10] Kaneno Y, Wada M, Inoue H, Takasugi T. Effects of Grain Size and Temperature on Environmental Embrittlement of Ni3(Si, Ti) Alloy. Mater Trans 2001; 42: 418-21.
[11] Schulson EM, Barker DR. A brittle to ductile transition in NiAl of a critical grain size. Scr Metall 1983; 17: 519-22. DOI:10.1016/0036-9748(83)90344-7
[12] Cahn RW, Siemers PA, Geiger JE, Bardhan P. The order-disorder transformation in Ni3Al and Ni3Al·Fe alloys-I. Determination of the transition temperatures and their
relation to ductility. Acta Metall 1987; 35: 2737-51. DOI:10.1016/0001-6160(87)90273-2
[13] Cahn RW, Siemers PA, Hall EL. The order-disorder transformation in Ni3Al and
Ni3Al·Fe alloys-II. Phase transformations and microstructures. Acta Metall 1987; 35:
2753-64. DOI:10.1016/0001-6160(87)90274-4
[14] Liu F, Chen Y, Yang G, Lu Y, Chen Z, Zhou Y. Competitions incorporated in rapid solidification of the bulk undercooled eutectic Ni78.6Si21.4alloy. J Mater Res 2007; 22:
[15] Lu Y, Liu N, Shi T, Luo D, Xu W, Li T. Microstructure and hardness of undercooled Ni78.6Si21.4 eutectic alloy. J Alloy Compd 2010; 490: L1-L4.
DOI:10.1016/j.jallcom.2009.09.038
[16] Lu Y, Liu F, Yang G, Wang H, Zhou Y. Grain refinement in solidification of highly undercooled eutectic Ni–Si alloy. Mater Lett 2007; 61: 987-90. DOI:10.1016/j.matlet.2006.06.028
[17] Goetzinger R, Barth M, Herlach DM. Mechanism of formation of the anomalous eutectic structure in rapidly solidified Ni–Si, Co–Sb and Ni–Al–Ti alloys. Acta Mater 1998; 46: 1647-55. DOI:10.1016/S1359-6454(97)00339-X
[18] ÇadırlıE, Herlach DM, Volkmann T. Characterization of rapidly solidified Ni-Si and Co-Al eutectic alloys in drop tube. J Non-Cryst Solids 2010; 356: 461-6. DOI:10.1016/j.jnoncrysol.2009.12.019
[19] Ahmad R, Cochrane RF, Mullis AM. The formation of regular Ni- (Ni31Si12)
eutectic structures from undercooled Ni–25 at.% Si melts. Intermetallics 2012; 22: 55-61. DOI:10.1016/j.intermet.2011.10.021
[20] Cochrane RF, Greer AL, Eckler K, Herlach DM. Dendrite growth velocities in undercooled Ni·Si alloys. Mater Sci Eng A 1991; 133: 698-701.
DOI:10.1016/0921-5093(91)90165-J
[21] Leonhardt M, Löser W, Lindenkreuz HG. Metastable phase formation in undercooled eutectic Ni78.6Si21.4 melts. Mater Sci Eng A 1999; 271: 31-7.
DOI:10.1016/S0921-5093(99)00161-6
[22] Cao L, Cochrane RF, Mullis AM. Lamella structure formation in drop-tube processed Ni–25.3 at.% Si alloy. J Alloy Compd; In Press. DOI:10.1016/j.jallcom.2013.11.233 [23] Mullis AM, Cao L, Cochrane RF. Non-equilibrium processing of Ni-Si alloys at high
undercooling and high cooling rates. Mater Sci Forum 2014; 790-791: 22-7. DOI:10.4028/www.scientific.net/MSF.790-791.22
[24] Cao L, Cochrane RF, Mullis AM. Microstructural evolution and phase formation in rapidly solidified Ni-25.3 at.% Si alloy. Unpublished results.
[25] Dutra AT, Milenkovic S, Kiminami CS, Santino AM, Gonçalves MC, Caram R. Microstructure and metastable phase formation in a rapidly solidified Ni-Si eutectic alloy using a melt-spinning technique. J Alloy Compd 2004; 381: 72-6. DOI:10.1016/j.jallcom.2004.02.059
[26] MTDATA is a CALPHAD (Calculation of Phase Diagrams) package licensed by the National Physical Laboratory, UK. Functionality is similar to other CALPHAD packages such as thermoCalc.
[27] Himuro Y, Tanaka Y, Kamiya N, Ohnuma I, Kainuma R, Ishida K. Stability of ordered L12 phase in Ni3Fe–Ni3X (X: Si and Al) pseudobinary alloys. Intermetallics
2004; 12: 635-43. DOI:10.1016/j.intermet.2004.03.008
[28] Himuro Y, Tanaka Y, Ohnuma I, Kainuma R, Ishida K. Phase equilibria and -L12
phase stability in the Ni-rich portion of Ni-Fe-Si and Ni-Fe-Al systems. Intermetallics 2005; 13: 620-30. DOI:10.1016/j.intermet.2004.10.009
[29] Herlach DM, Cochrane RF, Egry I, Fecht HJ, Greer AL. Containerless processing in the study of metallic melts and their solidification. Int Mater Rev 1993; 38: 273-347. DOI: 10.1179/095066093790326267
[30] Libera M, Olson GB, Vander S. Heterogeneous nucleation of solidification in atomized liquid metal droplets. Mater Sci Eng A 1991; 132: 107-118.
[32] Cole WA, Wakeham WA. The viscosity of nitrogen, oxygen, and their binary mixtures in the limit of zero density. J Phys Chem Ref Data 1985; 14: 209-26. DOI: 10.1063/1.555748
[33] Latto B, Saunders MW. Viscosity of nitrogen gas at low temperatures up to high pressures: a new appraisal. Can J Chem Eng 1972; 50: 765-70. DOI:10.1002/cjce.5450500615
[34] Smith JM, Van Ness HC, Abbott MM. Introduction to Chemical Engineering Thermodynamics. 4th ed. New York: McGraw-Hill Publishing Company; 1975. [35] Gillessen F, Herlach DM. Crystal nucleation and glass-forming ability of Cu·Zr in a
containerless state. Mater Sci Eng 1988; 97: 147-51. DOI: 10.1016/0025-5416(88)90030-4
Figures and Tables Caption
Fig. 1. (a) Ni-rich part of the Ni-Si phase diagram; (b) Ni-rich corner of the Ni-Fe-Si
equilibrium ternary phase diagram at 1400 K. The points labelled 1 and 2 represent the
notional composition of the Ni64.7Fe10Si25.3 and Ni59.7Fe15Si25.3 alloys; (c) Vertical
section diagram of the Ni3Si-Fe3Si pseudo-binary system.
Fig. 2. XRD results from the Ni64.7Fe10Si25.3alloy as a function of size range, showing
evidence for the presence of the additional phase Ni25Si9, in droplets in the 53-106 m
size ranges. Note that for clarity only the interval 40°-50° is shown.
Fig. 3. XRD results from the Ni59.7Fe15Si25.3alloy as a function of size range, showing
evidence for the presence of the additional phase Ni25Si9, in droplets in the 53-106 m
size ranges. Note that for clarity only the interval 40°-50° is shown.
Fig. 4. Micrographs of the three characteristic microstructures observed in the
Ni64.7Fe10Si25.3 and Ni59.7Fe15Si25.3 drop-tube samples: (a) regular microstructure, I,
from 212-300 m droplet of Ni64.7Fe10Si25.3 alloy; (b) refined lamellar structure, II,
from 150-212 m droplet of Ni64.7Fe10Si25.3alloy; (c) anomalous structure, III, from
150-212 m droplet of Ni59.7Fe15Si25.3alloy. (d) TEM bright field image showing the
refined lamellar structure in (b).
Fig. 5. Micrographs showing the regions from which TEM specimens were taken
(white rectangles). (a) and (b) are taken from the 300-500 m and 53-75 m sieve
fraction respectively of the Ni64.7Fe10Si25.3 alloy. The black rectangles, T1, T2 and T3,
refer to the areas analysed by TEM, to confirm the identity of the phases, I1-I5.
Fig. 6. (a) The results of the TEM analysis on the area, T1, identifying that the single
phase (I1) is -Ni31Si12, and that the eutectic structure consists of -Ni31Si12(I2) and the
ordered L12 phase (I3); (b) TEM selected area diffraction pattern of the area shown
Fig. 7. TEM micrographs of the refined lamellar (II) and anomalous (III) structures,
with, inset, diffraction patterns identifying (a) T2, wide band I4,as -Ni31Si12; (b) T3,
primary coarse phase I5, as the metastable phase Ni25Si9.
Fig. 8. SEM images showing the microstructure of one 150-212 m droplet of
Ni64.7Fe10Si25.3 alloy, comprising the regular structure (I) and the refined lamellar
structures (II).
Fig. 9. SEM images showing the microstructure of one 75-106 m droplet of
Ni64.7Fe10Si25.3alloy, comprising the regular structure (I) and anomalous structure (III).
Fig. 10. (a) SEM image showing the microsturcture of one 106-150 m droplet of
Ni59.7Fe15Si25.3 alloy, consisting of the mixed structure of II and III; (b) micrograph
from the region highlighted by the black square.
Fig. 11. SEM images of droplets displaying only the anomalous structure. (a,b): 75-106
m size fraction, Ni64.7Fe10Si25.3alloy, (c,d): 150-212 m size fraction, Ni59.7Fe15Si25.3
alloy.
Fig. 12. (a) Percentage of the different particle types (A, B or C) as a function of size
range in the Ni64.7Fe10Si25.3 alloy (solid curves) and Ni59.7Fe15Si25.3 alloy (dashed
curves). The numbers of the particles counted are also listed in brackets beneath the
x-coordinate. The numbers of the large particles (>212 m) have not been counted here
as there are no instances of these particles displaying other than Type A characteristics.
(b) Estimated volume fraction of Ni25Si9 as a function of particle size in the
Ni64.7Fe10Si25.3and Ni59.7Fe15Si25.3alloys.
Fig. 13. SEM image of a particle from the 212-150 m size range for the Ni64.7Fe10Si25.3
alloy, showing the direct transition from structure I to II.
Fig. 14. SEM image of the Ni59.7Fe15Si25.3alloy showing the refined lamellar structure
Fig. 15. EDX determination of the average Fe and Si compositions of the
Ni64.7Fe10Si25.3 and Ni59.7Fe15Si25.3 alloys. Results 1 and 2 are average Si and Fe
composition of the particles, while results 3 and 4 are the Si and Fe compositions of the
phase in the respective particles ranges.
Fig. 16. Microprobe line-scan determination of the composition in the primary phase
and eutectic regions for two separate particles, both of which are from 150-212 m size
range and are for the Ni59.7Fe15Si25.3alloy.
Fig. 17. TEM high-resolution image of the eutectic structure of the Ni64.7Fe10Si25.3
droplet, showing -Ni31Si12and 1(L12) regions.
Fig. 18. Calculated cooling rate versus droplet diameter during drop-tube processing.
Table 1. Relationship between observed microstructure morphology, constituent
phase(s) and droplet classification
Table 1. Relationship between observed microstructure morphology, constituent
phase(s) and droplet classification
Morphology Phase Droplet Classification
Regular (I)
Single phase -Ni31Si12
+
-Ni31Si12+ 1-Ni3Si eutectic
Type A
Mixture of I with either/both
of II/III
Type B Refined lamellar (II) -Ni31Si12+ 1-Ni3Si eutectic
Type C
Table 2. Parameters used to estimate the cooling rate and undercooling [31-36]
Quantity value Unit
Properties of the Gas
Thermal conductivity, g 0.0249 J m-1s-1K-1
Density, g 0.561 kg m-3
Dynamic viscosity, g 0.0000179 kg m-1s-1
Heat capacity,cg 1038.310 J kg-1K-1
Mole mass,M 0.028 kg mol-1
Gas constant,R 8.314 J mol-1K-1
Properties of the Alloy
Mass density, 6.458× 10³ kg m-3
Heat capacity,Cp 743.76 J kg-1K-1
Surface emissivity, 0.4002
-Stefan-Boltzmann constant, 5.67 × 10⁻⁸ W m-2K-4 Relatively drop velocity,Vr 1.0 m s-1
Droplet temperature,T 1600 K
![Table 2. Parameters used to estimate the cooling rate and undercooling [31-36]](https://thumb-us.123doks.com/thumbv2/123dok_us/7873955.182601/22.892.221.677.153.490/table-parameters-used-estimate-cooling-rate-undercooling.webp)
