R E S E A R C H
Open Access
Central venous-to-arterial carbon dioxide
difference as a prognostic tool in high-risk
surgical patients
Emmanuel Robin
1*, Emmanuel Futier
2, Oscar Pires
1, Maher Fleyfel
1, Benoit Tavernier
1, Gilles Lebuffe
1and Benoit Vallet
1Abstract
Introduction:The purpose of this study was to evaluate the clinical relevance of high values of central venous-to-arterial carbon dioxide difference (PCO2gap) in high-risk surgical patients admitted to a postoperative ICU. We hypothesized that PCO2gap could serve as a useful tool to identify patients still requiring hemodynamic optimization at ICU admission.
Methods:One hundred and fifteen patients were included in this prospective single-center observational study during a 1-year period. High-risk surgical inclusion criteria were adapted from Schoemaker and colleagues. Demographic and biological data, PCO2gap, central venous oxygen saturation, lactate level and postoperative complications were recorded for all patients at ICU admission, and 6 hours and 12 hours after admission.
Results:A total of 78 (68%) patients developed postoperative complications, of whom 54 (47%) developed organ failure. From admission to 12 hours after admission, there was a significant difference in mean PCO2gap (8.7 ± 2.8 mmHg versus 5.1 ± 2.6 mmHg;P= 0.001) and median lactate values (1.54 (1.1-3.2) mmol/l versus 1.06 (0.8-1.8) mmol/l;P= 0.003) between patients who developed postoperative complications and those who did not. These differences were maximal at admission to the ICU. At ICU admission, the area under the receiver operating characteristic curve for occurrence of postoperative complications was 0.86 for the PCO2gap compared to Sequential Organ Failure Assessment score (0.82), Simplified Acute Physiology Score II score (0.67), and lactate level (0.67). The threshold value for PCO2gap was 5.8 mmHg. Multivariate analysis showed that only a high PCO2gap and a high Sequential Organ Failure Assessment score were independently associated with the occurrence of postoperative complications. A high PCO2gap (≥6 mmHg) was associated with more organ failure, an increase in duration of mechanical ventilation and length of hospital stay.
Conclusion:A high PCO2gap at admission in the postoperative ICU was significantly associated with increased
postoperative complications in high-risk surgical patients. If the increase in PCO2gap is secondary to tissue hypoperfusion then the PCO2gap might be a useful tool complementary to central venous oxygen saturation as a therapeutic target.
Introduction
There is increasing evidence that individually optimized hemodynamic therapy oriented on goals to maintain and improve tissue perfusion and/or oxygenation improves patient outcome [1]. The development of tissue hypoxia is a leading cause of postoperative organ failure and mortality following major surgery [2,3]. Early recognition and correction of warning signals of persistent inadequacy of
tissue perfusion is therefore of particular importance, espe-cially in patients with a reduced physiological reserve [1,4].
The inability to meet an increase in oxygen (O2) demand with surgical trauma either by an increase in O2delivery or an increase in O2 extraction can lead to tissue hypoxia [5,6]. Several markers of impaired tissue oxygenation have been explored to help identify patients at increased risk of complications. Postoperative organ failure has been shown to be associated with reduced central venous O2saturation (ScvO2), which explores the balance of O2 delivery and tissue O2consumption [7]. However, there is evidence that O2-derived variables are poorly correlated with anaerobic * Correspondence:[email protected]
1
Department of Anaesthesiology and Intensive Care Medicine, University Hospital of Lille, Lille, France
Full list of author information is available at the end of the article
metabolism [8-11]. Indeed, both normal and high values (that is, ≥75%) for ScvO2do not preclude the presence of tissue hypoxia in case of impaired O2 extraction capabilities, which may therefore limit the usefulness of ScvO2 monitoring [12,13]. In contrast, it has also been shown that strategies aimed at reducing high serum lactate levels, as a warning signal of a persistent tissue hypoxia at ICU admission, could reduce length of stay and mortality [14,15]. However, a rise in lactate level may be delayed compared with markers of tissue oxygenation adequacy, such as oxygen extraction [16], and could be not sensitive enough to reflect tissue hypoperfusion [14].
Previous relatively small studies have proposed central venous-to-arterial carbon dioxide gradient (PCO2gap), a global index of tissue perfusion, as a useful measurement to characterize the insufficient flow state in spite of apparently normal macrocirculatory parameters [17,18]. Tissue partial pressure of carbon dioxide (PCO2) reflects metabolic alterations due to inadequate perfusion in actively metabolized tissues [19]. The PCO2gap, which has been shown to be inversely related to cardiac output (CO) [20], is considered as a marker of the ability of the venous blood flow to remove the CO2 excess produced in tissues [21]. Thus, an impaired tissue perfusion during a reduced blood flow is the main determinant of a rise of the PCO2gap [22]. However, despite promising findings from both experimental and clinical data, the prognostic significance of the PCO2gap has only been examined to a small extent in the context of major surgical trauma. The purpose of this study was to evaluate the clinical relevance of high values of the PCO2gap, and their relationships to other markers of impaired tissue perfusion and oxygenation (that is, blood lactate and ScvO2). We hypothesized that the PCO2gap could serve as a useful tool to help identify patients at high risk of postoperative complications at ICU admission following major surgery.
Methods
Patients
This was a prospective single-center observational study of patients scheduled for major abdominal and vascular surgery and admitted to the ICU of a University Hospital over a 1-year period. The study was approved by local Research Ethics Committee of the University Hospital of Lille, France, which permitted anonymous data analysis. The requirement for written inform consent was waived due to the strict observational design of this study.
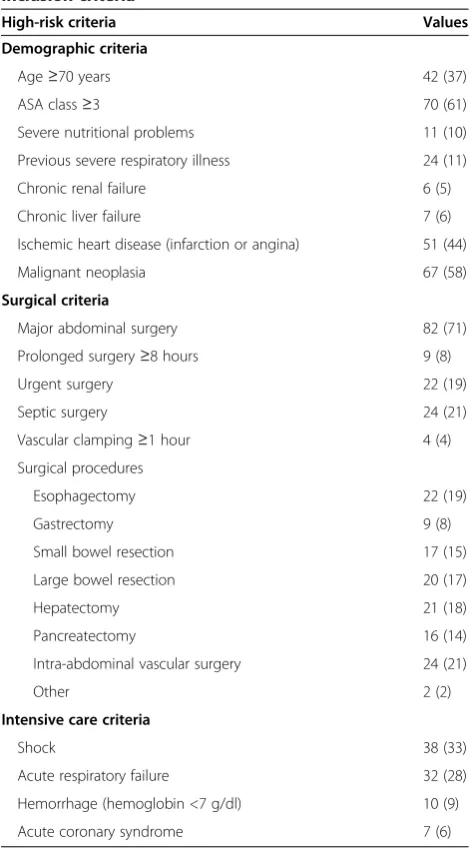
Inclusion criteria adapted from Schoemaker and colleagues [23] are summarized in Table 1 and are divided into demographic, surgical and intensive care criteria. All patients undergoing abdominal or vascular surgery were included if they had one of the following criteria: 1) one demographic criterion and one surgical criterion; 2)
three or more demographic criteria; 3) three or more sur-gical criteria; 4) one intensive care criterion.
Study protocol
[image:2.595.304.540.107.533.2]As part of our routine hemodynamic monitoring during major surgery, all patients were monitored with central venous (standard two-lumen catheter, Arrow, Wayne, Pennsylvania, USA; or PreSep catheter with oximetry, Ed-wards Lifesciences, Irvine, California, USA) and arterial (Seldicath, Plastimed, Le Plessis Bouchard, France) cathe-ters placed before the beginning of surgery. The central venous line was positioned with the tip within the superior
Table 1 Demographic, surgical and intensive care inclusion criteria
High-risk criteria Values
Demographic criteria
Age≥70 years 42 (37)
ASA class≥3 70 (61)
Severe nutritional problems 11 (10)
Previous severe respiratory illness 24 (11)
Chronic renal failure 6 (5)
Chronic liver failure 7 (6)
Ischemic heart disease (infarction or angina) 51 (44)
Malignant neoplasia 67 (58)
Surgical criteria
Major abdominal surgery 82 (71)
Prolonged surgery≥8 hours 9 (8)
Urgent surgery 22 (19)
Septic surgery 24 (21)
Vascular clamping≥1 hour 4 (4)
Surgical procedures
Esophagectomy 22 (19)
Gastrectomy 9 (8)
Small bowel resection 17 (15)
Large bowel resection 20 (17)
Hepatectomy 21 (18)
Pancreatectomy 16 (14)
Intra-abdominal vascular surgery 24 (21)
Other 2 (2)
Intensive care criteria
Shock 38 (33)
Acute respiratory failure 32 (28)
Hemorrhage (hemoglobin <7 g/dl) 10 (9)
Acute coronary syndrome 7 (6)
Data are presented as absolute value (%). Severe nutritional problems: body mass index≤17 kg/m2
or weight loss >10% in 6 months. Chronic renal failure: creatinine clearance <60 ml/min per 1.73 m2
vena cava, and correct positioning was verified by chest radiograph. Until admission to the ICU, anesthesia and sur-gical procedures were performed according to the local standards. No specific hemodynamic protocol was used during surgery. All patients were admitted to the ICU immediately after surgery and were all managed according to our local standards of care.
Data collection and outcome measures
Standard postoperative monitoring included: electrocar-diograph (heart rate), invasive mean arterial pressure, pulse oxymetry and urine output. In all patients, the PCO2 gap, calculated as the difference between central venous partial pressure of carbon dioxide and arterial partial pressure of carbon dioxide, ScvO2, serum lactate level, blood gas analysis, troponin I and routine laboratory tests were obtained by intermittent blood sampling immedi-ately after admission (H0) and repeated 6 (H6) and 12 hours (H12) later. At ICU admission, data on demographics (age, sex, weight), type of surgical procedure, American Society of Anesthesiology Physical Status score, Simplified Acute Physiology Score (SAPS) II [24], presence of catecholamine and the need for mechanical ventilation were recorded in all patients. Postoperative organ failure was assessed using the Sequential Organ Failure Assessment (SOFA) score recorded daily until ICU discharge.
Briefly, the organ failure criteria are:
Circulatory failure: use of catecholamine to maintain
a mean arterial pressure≥65 mmHg after a suitable fluid loading.
Acute respiratory failure: need for mechanical
ventilation or noninvasive ventilation.
Acute kidney injury: 1.5-times increase in creatinine serum level or increased creatinine >0.3 mg/dl or urine output <0.5 ml/kg per hour for 6 hours.
Neurological impairment: stroke with focal deficit or
coma (Glasgow score≤8) or delirium.
Postoperative complications were assessed in accordance with previously defined criteria [25,26] until hospital dis-charge or death as follows: postoperative sepsis (pneumonia, intraperitoneal abscess, wound infection, peritonitis and urinary tract infection), acute respiratory failure, acute renal and cardiac failures, postoperative hemorrhage, ischemic events, and postoperative mortality. Patients were followed-up until hospital discharge or death.
Statistical analysis
The study population was divided into two groups according to the occurrence of postoperative complications. Normal distribution of all variables was accessed by graph-ical methods and the Kolmogorov-Smirnov test. All data are presented as absolute value (%), as mean ± standard
deviation or as median (interquartile range) when neces-sary. Differences between the two groups at baseline were analyzed using the Student’s t test or Mann-Whitney U test for continuous variables, and chi-square test or Fish-er’s exact test for categorical variables. A repeated-measure analysis of variance was used to compare vari-ables over time. When the sphericity assumption has been violated as assessed by Mauchly’s test, the degrees of freedom were corrected using Greenhouse-Geisser es-timates of sphericity. A Bonferroni correction was used for post hoc tests. Univariate analysis was per-formed to test associations with postoperative complica-tions. A logistic regression was performed for multivariate analysis for all univariate relevant covariates that discrim-inate between the two groups (P value <0.05 was set as the limit for inclusion). A hierarchical entry method in two blocks was used. In the first block, variables usually known to influence prognosis were entered. In the second block, all other variables were entered. Receiver operating characteristic (ROC) curves were generated to identify opti-mal cut-off values for outcome associations, and the area under the ROC curve, sensitivity and specificity were calcu-lated. The optimal threshold value from the ROC curves was assessed to obtain the highest Youden index and posi-tive likelihood ratio. APvalue less than 0.05 was considered statistically significant. Statistical analysis was performed using the SPSS 17.0 software (Chicago, IL, USA).
Results
Between May 2008 and May 2009, 115 patients who fulfilled the entry criteria were included in the study. Baseline characteristics of the study population are given in Table 1. The median American Society of Anesthesiology Physical Status score was 3.0 (2.0-3.0), mean age was 65 ± 12 years, and 75% were male. At the time of inclusion (T0), the median SAPS II score was 19.5 (15.0-28.7) and the mean ScvO2 and PCO2 gap were 77.3 ± 6.3% and 7.2 ± 3.3 mmHg, respectively. A total of 43% of patients were mechanically ventilated, and 36% received catecholamine infusion. The median duration of mechanical ventilation was 0.0 (0.0-3.0) days. The SOFA scores were 4.0 (1.0-10.0), 4.0 (1.0-8.0), and 4.0 (1.0-8.0) at postoperative days 1, 2 and 3, respectively. The median ICU and hospital length of stays were 6.0 (4.0-8.0) days and 21.0 (15.0-29.0) days, respectively. The 28-day mortality rate was 8% (septic shock, n = 4; acute mesenteric ischemia, n = 2; myocardial infarction, n = 2; massive acute blood loss, n = 1).
Association with outcome
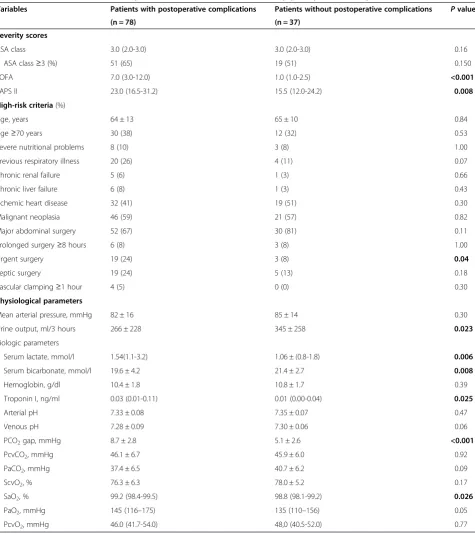
surgery, patients with postoperative complications were more likely to undergo urgent surgery (Table 3). There were no other statistically significant differences in baseline high-risk criteria between the two patient groups. Patients with postoperative complications were more severely ill on ICU admission (SOFA score: 7.0 (3.0-12.0) versus 1.0 (1.0-2.5), P< 0.001; SAPS II score: 23.0 (16.5-31.2) versus 15.5 (12.0-24.2),P= 0.008), had longer durations of mechanical ventilation (2.0 (0.0-3.0) days versus 0.0 (0.0-0.0) days, P< 0.001) and longer durations of hospital stay (25.0 (20.0-34.0) days versus 14.0 (12.0-160),P< 0.001). On the day of ICU admission, there were statistically significant differences in lactate level (P= 0.006), but not in ScvO2values (P= 0.17) between patients who did and did not develop postoperative complications. Univariate analysis identified nine variables on ICU admission associated with the occurrence of postoperative com-plications on ICU admission: lactate level (P= 0.006), troponin level (P= 0.025), bicarbonate level (P= 0.008), arterial O2saturation (P= 0.026), urine output (P= 0.023), PCO2 gap value (P< 0.001), SAPS II (P= 0.008), SOFA score (P< 0.001) and emergency surgery (P= 0.04). Multivariate analysis showed that a high PCO2 gap (odds ratio = 1.93, 95% confidence interval (CI) 1.36 to 2.75,P< 0.001) and a high SOFA score (odds ratio = 1.52 95% CI 1.14 to 2.02,P= 0.004) at H0 were independently associated with the occurrence of postoperative complica-tions (Table 4). The same results were observed at H6 (data not shown). The area under the ROC curve for the occurrence of postoperative complications was 0.86 (95% CI 0.77 to 0.95) for the PCO2 gap. The area under the ROC curve for organ failure for SOFA score, SAPS II score, lactate level and troponin value were 0.82, 0.67, 0.67 and 0.57, respectively (Figure 1). The opti-mal PCO2 gap value on ICU admission was 5.8 mmHg (sensitivity 90.7%, specificity 70.0%, positive predictive value 86.6%, and negative predictive value 78.8%) for
discriminating between patients who did and patients who did not develop postoperative complications. Of the 54 patients who developed organ failure, 46 had a PCO2 gap ≥6 mmHg. A high PCO2 gap (>6 mmHg) was observed in 68% of the patients upon admission to the ICU after surgery. Compared with patients with a low PCO2 gap on ICU admission, a high PCO2 gap was associated with more organ failure (P< 0.001), and an increase in duration of mechanical ventilation (P= 0.002) and length of hospital stay (P< 0.001) (Table 5). In addition, a high PCO2 gap was associated with a higher 28-day mortality rate (11.5% versus 0%,P= 0.056).
Trends in PCO2gap
Changes in the PCO2 gap and lactate values during the first 12 hours are shown in Figure 2. From H0 to H12, there was a significant difference for mean PCO2gap (P= 0.001) and mean lactate values (P= 0.003) between pa-tients who did or did not develop postoperative complica-tions. Maximal difference was present immediately after inclusion just after surgery (8.7 ± 2.8 mmHg versus 5.1 ± 2.6 mmHg, P< 0.001). There was a trend towards a de-creased PCO2gap all along the first 12 hours of medical support in the ICU for patients with postoperative compli-cations (P= 0.064). Similar trends were present for the lactate level. There was also a significant difference for mean PCO2 gap (P= 0.003) between patients who developed organ failure and those who did not (Figure 3).
Discussion
The main finding of our study is that a PCO2gap >6 mmHg at ICU admission following major surgery is predictive of postoperative complications in high-risk surgical patients. Patients with an enlarged PCO2 gap had more organ failure, increased durations of mechanical ventilation as well as length of hospital stay, and a trend towards higher mortality rates, although the latter did not reach statistical significance.
[image:4.595.57.291.99.268.2]To the best our knowledge, this study is the first to evidence the prognostic significance of an enlarged PCO2 gap at ICU admission in high-risk surgical patients. In patients who developed postoperative complications, the increase in PCO2gap was maximal immediately after ICU admission and gradually decreased thereafter as a result of medical support. The diagnostic performance of the PCO2 gap is quite similar to the SOFA score with the huge advantage of being measurable at patient admission. In addition, the measurement of the PCO2gap is much more responsive than the SOFA score and easy to implement at the bedside. These results are supported by the results of a previous study by our group in which an enlarged PCO2 gap was associated with an increased rate of postoperative complications in patients who remained inadequately managed by volume loading during an individualized
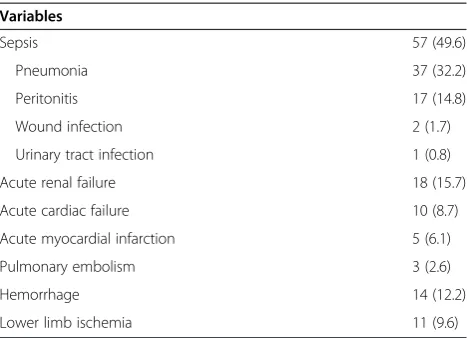
Table 2 Postoperative complications
Variables
Sepsis 57 (49.6)
Pneumonia 37 (32.2)
Peritonitis 17 (14.8)
Wound infection 2 (1.7)
Urinary tract infection 1 (0.8)
Acute renal failure 18 (15.7)
Acute cardiac failure 10 (8.7)
Acute myocardial infarction 5 (6.1)
Pulmonary embolism 3 (2.6)
Hemorrhage 14 (12.2)
Lower limb ischemia 11 (9.6)
goal-directed therapy [17]. These results also echo those of previous studies in patients with severe sepsis or septic shock in which a large PCO2 gap was associated with higher rates of organ failure and greater mortality
[18,21,27]. In all these studies, the thresholds for PCO2 gap values were around 5 to 6 mmHg, as in our study.
[image:5.595.61.537.98.633.2]The increase in venous PCO2would reflect a state of insufficient flow relative to CO2production [28,29]. Indeed,
Table 3 Baseline characteristics of patients who did and did not develop postoperative complications
Variables Patients with postoperative complications Patients without postoperative complications Pvalue
(n = 78) (n = 37)
Severity scores
ASA class 3.0 (2.0-3.0) 3.0 (2.0-3.0) 0.16
ASA class≥3 (%) 51 (65) 19 (51) 0.150
SOFA 7.0 (3.0-12.0) 1.0 (1.0-2.5) <0.001
SAPS II 23.0 (16.5-31.2) 15.5 (12.0-24.2) 0.008
High-risk criteria(%)
Age, years 64 ± 13 65 ± 10 0.84
Age≥70 years 30 (38) 12 (32) 0.53
Severe nutritional problems 8 (10) 3 (8) 1.00
Previous respiratory illness 20 (26) 4 (11) 0.07
Chronic renal failure 5 (6) 1 (3) 0.66
Chronic liver failure 6 (8) 1 (3) 0.43
Ischemic heart disease 32 (41) 19 (51) 0.30
Malignant neoplasia 46 (59) 21 (57) 0.82
Major abdominal surgery 52 (67) 30 (81) 0.11
Prolonged surgery≥8 hours 6 (8) 3 (8) 1.00
Urgent surgery 19 (24) 3 (8) 0.04
Septic surgery 19 (24) 5 (13) 0.18
Vascular clamping≥1 hour 4 (5) 0 (0) 0.30
Physiological parameters
Mean arterial pressure, mmHg 82 ± 16 85 ± 14 0.30
Urine output, ml/3 hours 266 ± 228 345 ± 258 0.023
Biologic parameters
Serum lactate, mmol/l 1.54(1.1-3.2) 1.06 ± (0.8-1.8) 0.006
Serum bicarbonate, mmol/l 19.6 ± 4.2 21.4 ± 2.7 0.008
Hemoglobin, g/dl 10.4 ± 1.8 10.8 ± 1.7 0.39
Troponin I, ng/ml 0.03 (0.01-0.11) 0.01 (0.00-0.04) 0.025
Arterial pH 7.33 ± 0.08 7.35 ± 0.07 0.47
Venous pH 7.28 ± 0.09 7.30 ± 0.06 0.06
PCO2gap, mmHg 8.7 ± 2.8 5.1 ± 2.6 <0.001
PcvCO2, mmHg 46.1 ± 6.7 45.9 ± 6.0 0.92
PaCO2, mmHg 37.4 ± 6.5 40.7 ± 6.2 0.09
ScvO2, % 76.3 ± 6.3 78.0 ± 5.2 0.17
SaO2, % 99.2 (98.4-99.5) 98.8 (98.1-99.2) 0.026
PaO2, mmHg 145 (116–175) 135 (110–156) 0.05
PcvO2, mmHg 46.0 (41.7-54.0) 48,0 (40.5-52.0) 0.77
Data are presented as absolute values (%), mean ± standard deviation, or median (interquartile range). Comparison between groups were assessed by Student’s
ttest or Mann-WhitneyUtest when necessary. SignificantPvalues are indicated in bold text. ASA, American Society of Anesthesiology physiological status; PaCO2,
arterial partial pressure of carbon dioxide; PaO2, arterial partial pressure of oxygen; PCO2gap, central venous-to-arterial carbon dioxide gradient; PcvCO2, central
venous partial pressure of carbon dioxide; PcvO2, central venous partial pressure of oxygen; SaO2, arterial oxygen saturation; SAPS, Simplified Acute Physiology
in anin situ, vascularly isolated, innervated dog hindlimb model, Vallet and colleagues evidenced that the PCO2gap increased during low blood flow-induced tissue hypoxia (ischemic hypoxia) while it remained unchanged during hypoxemia-induced hypoxia (hypoxic hypoxia) [22]. These results were confirmed in a mathematical analysis model [30] and inin vivoconditions in pig [31] and in sheep [9]. These results are also in agreement with those of Bakker and colleagues [21] who showed that, in patients with septic shock, the PCO2 gap was smaller in survivors than in non-survivors, despite quite similar CO, O2 delivery (DO2) and O2 consumption (VO2) values. In septic shock patients, characterized by an increased PCO2 gap and a low flow state, fluid challenge was found to lower the PCO2 gap while increasing CO [32]. In contrast, no
significant changes in CO and PCO2gap were found in pa-tients with normal PCO2, thus confirming the relationship between an increased PCO2gap and insufficient flow [32].
[image:6.595.58.539.100.239.2]In our study, ScvO2 did not allow us to discriminate between patients with and without postoperative compli-cations. These results seem to contradict previous studies. Indeed, recently published data clearly demonstrate that low ScvO2 during and after major abdominal surgery is associated with an increased risk of postoperative complications [7,16,33]. In addition, ScvO2 was part of early goal-directed therapy protocol algorithms that have proven their effectiveness in improving the prognosis of patients [16,34]. As the use of ScvO2 has become increasingly popular in the management of high-risk surgical patients, one part of our patients (at the con-venience of the anesthetist in charge of the patient) had already been treated using ScvO2during surgery be-fore inclusion in the study. The hemodynamics of our pa-tients were in part optimized, as evidenced by ScvO2 values above 70% in both groups. Another point to con-sider is that sepsis was the main cause of postoperative complications in our study (47%). In this situation where microcirculation failure is frequent, a normal
Table 4 Logistic regression results: variables associated with the occurrence of postoperative complications
B (SE) Odds ratio 95% confidence interval P
Constant −5.61 (3.50)
PCO2gap 0.66 (0.18) 1.93 1.36-2.75 <0.001
SOFA score 0.42 (0.15) 1.52 1.14-2.02 0.004
Lactate 0.38 (0.37) 1.47 0.71-3.02 0.300
SAPS II score 0.04 (0.04) 1.04 0.96-1.13 0.347
Emergency surgery 0.09 (1.17) 1.10 0.11-10.80 0.937
Bicarbonate −0.07 (0.11) 0.931 0.75-1.16 0.931
Troponin 1.87 (1.47) 6.50 0.36-117.06 0.204
diuresis 0.0003 (0.002) 1.00 0.997-1.003 0.825
Modelχ2= 54.96,P< 0.001, R2= 0.50 (Hosmer and Lemeshow), R2= 0.48 (Cox and Snell), R2= 0.66 (Nagelkerke). SignificantPvalues are indicated in bold text. PCO2gap, central venous-to-arterial difference in carbon dioxide; SAPS II, Simplified Acute Physiology Score II; SE, standard error; SOFA, Sequential Organ
Failure Assessment.
[image:6.595.57.291.473.643.2]Figure 1Discriminant factors of postoperative complications. Receiver operating characteristic curve comparing the ability of central venous-to-arterial difference in carbon dioxide (PCO2gap), Sequential Organ Failure Assessment (SOFA) score, Simplified Acute Physiology Score (SAPS) II score, lactate level and troponin level at baseline to discriminate between patients who did (n = 78) and did not (n = 37) develop postoperative complications. Areas under the curve are 0.86; 0.82; 0.67; 0.67 and 0.57, respectively.
Table 5 Outcome of patients with high and low values of PCO2gap on ICU admission
Variables PCO2 gap
≥6 mmHg
PCO2 gap <6 mmHg P
value
(n = 78) (n = 37)
Total duration of MV, days 2.0 (0.0-3.2) 0.0 (0.0-0.0) <0.001
Length of ICU stay, days 6.0 (4.0-8.2) 5.0 (4.0-7.5) 0.287
Length of hospital stay, days 22.5 (17.0-32.2) 16.0 (13.0-23.5) 0.002
Organ failure 46 (59.0%) 8 (21.6%) < 0.001
28-day mortality 9 (11.5%) 0 0.056
Areas under the curve are 0.86; 0.82; 0.67; 0.67 and 0.57, respectively. Data are presented as medians (interquartile range) or absolute value (%). Significant
Pvalues are indicated in bold text. MV, mechanical ventilation; PCO2gap,
[image:6.595.305.539.595.699.2]or high ScvO2 value does not preclude tissue hypoper-fusion [12,13,35]. According to the modified Fick equation applied to CO2, the PCO2gap is linearly related to CO2 production (VCO2) and inversely related to CO [29]. In situations where the VO2/DO2relationship is satis-fied, the flow is sufficient to wash out the CO2produced by the tissue even if there is an additional anaerobic VCO2 [22]. Conversely, when blood flow is low, the PCO2 gap may increase even if there is no increase in VCO2 [31]. Taken together, these factors may explain why, in some of our patients, the PCO2 gap was increased while ScvO2 was normal and ScvO2 failed to predict postoperative complications [36].
Similarly, lactate levels were not an independent factor associated with postoperative complications, unlike the PCO2 gap. This difference is not entirely a surprise since our surgical patients benefited from immediate hemodynamic support in the operating room and inten-sive care. Therefore, these patients were not necessar-ily in a decompensated state as evidenced by the small increase in lactate levels (<2.5 mmol/l on average) and ScvO2> 70% including patients who present with postoperative complications. The increase in PCO2 gap seems only to suggest that there is a hemodynamic optimization margin for these patients. Moreover, the PCO2gap and lactate levels may reflect different events
Patients with postoperative complications
Patients without postoperative complications
(A)
p < 0.001 p = 0.064
(B)
p = 0.003 p = 0.003
p < 0.001
[image:7.595.57.535.90.535.2]p = 0.045
since lactate clearance is slower than the dynamic and rapid change in PCO2 gap; the lactate level could reflect the hemodynamic state in the last hours of surgery. If there was a significant relationship between the rate of lactate at H0 and intraoperative variables, such as intra-venous fluids, blood loss, episodes of low mean blood pressure ≤60 mmHg for more than 10 minutes, and duration of surgery (data not shown), the strength of this association is quite relative, since the correlation coefficients ranged from 0.273 to 0.359. If intra-operative events influenced the lactate levels at post-operative ICU admission, they were not the only explanation.
In this context, when early goal-directed therapy has reached its objectives including ScvO2> 70%, the PCO2gap could be a useful additional tool to continue processing hemodynamic optimization. In several studies using a goal-directed therapy in sepsis, it was demonstrated that either lactate clearance or PCO2 gap could be useful for identifying a persistent tissue hypoperfusion even when ScvO2 goals had been achieved [15,18]. In surgical patients, it has been shown that an individualized preload-targeted fluid loading to maintain tissue perfusion was not sufficient to prevent significant differences in outcome [37]. Interestingly, the mean PCO2 gap was larger in patients with complications with a“normalized” DO2/VO2 ratio (ScvO2≥71%) than in patients without complications, with 5 mmHg as the best threshold value. Associated with these previous studies, our results con-firm that the PCO2gap is a useful and additional tool to
detect persistent tissue hypoperfusion. Moreover, the increase in lactate level, another marker of inadequate VO2/DO2 relationship, is often delayed compared to other markers such as ScvO2 [16]. In our study the elevation of the PCO2 gap was very early, starting at patient inclusion. Part of this increase was probably secondary to the intraoperative hemodynamic situation. The PCO2gap at H0 was significantly higher in patients undergoing intraoperative catecholamine (6.88 ± 3.16 versus 3.02 ± 8.7, P= 0.006), but this effect appears to be limited to the most seriously ill patients (those receiving catecholamines) since there was no correlation between PCO2gap at H0 and other intraoperative macrocirculatory variables (mean arterial pressure, heart rate, blood loss, fluid loading, blood transfusions, dieresis; data not shown).
Our study has several limitations. First, this was a single-center study involving patients undergoing major abdominal surgery. It is therefore uncertain whether our findings can be extrapolated to other non-abdominal surgery. Second, we are aware that the number of patients was relatively small which could limit the external validity of the study, and that complementary data are needed to confirm the result. Nevertheless, when we considered that one measurement of PCO2≥6 mmHg at inclusion was associated with the occurrence of postoperative complica-tions, we found apost-hocpower >90%. Third, the use of central venous-to-arterial PCO2difference as a surrogate for mixed venous PCO2gap might be a further limitation. Nevertheless, it has been found that central venous PCO2, obtained from a simple central blood sample instead of a
Patients with organ failure
Patients without organ failure
[image:8.595.58.537.89.325.2]p = 0.003
pulmonary arterial blood sample, is a valuable alternative to mixed PCO2and that correlation with CO still exists in this context [38].
Conclusion
This is the first study concerning the usefulness of PCO2 gap in high-risk surgical patients at admission in postoperative ICU confirming previous results established during a surgical period or in septic patients. There is strong support for the use of goal-directed therapy, particularly for fluid resuscitation, with ScvO2 as the cornerstone of these algorithms. However, once these objectives are achieved, the PCO2gap might be a useful and complementary tool to detect persistent tissue hypoperfusion that could be included as an additional step in the algorithms of early goal-directed therapy protocols. As the design of our study did not formally link the changes in PCO2 gap with tissue hypoperfusion or therapeutic change, further studies are needed to confirm these findings and be extended to other forms of surgery.
Key messages
High PCO2gap values were associated with a higher
rate of postoperative complications in high-risk surgical patients.
Threshold value is 6 mmHg.
In further studies, PCO2gap could be integrated as
an additional step in the algorithms of goal-directed therapy.
Abbreviations
CI:confidence interval; CO: cardiac output; CO2: carbon dioxide; DO2: oxygen delivery; H: hours; O2: oxygen; PCO2: partial pressure of carbon dioxide; PCO2 gap: central venous-to-arterial difference in carbon dioxide; ROC: receiver operating characteristic; SAPS: Simplified Acute Physiology Score; ScvO2: central venous oxygen saturation; SOFA: Sequential Organ Failure Assessment; VCO2: carbon dioxide production; VO2: oxygen consumption.
Competing interests
The authors declare that they have no competing interests.
Authors’contributions
ER was one of the designers of this study, the largest contributor to the manuscript and performed the statistical analysis. EF was one of the designers of this study and was involved in drafting the manuscript. OP participated in the design of this study, inclusion of patients and developed the database. MF was involved in the inclusion of patients, and the design and development of the database. BT was one of the designers of this study and was involved in drafting the manuscript. GL is the head of the department in which patients were included and was involved in drafting and revising the manuscript. BV was the main designer of this study and has contributed to the manuscript. All authors read and approved the manuscript.
Author details 1
Department of Anaesthesiology and Intensive Care Medicine, University Hospital of Lille, Lille, France.2Department of Anaesthesiology and Intensive Care Medicine, Hospital Estaing, University Hospital of Clermont-Ferrand, Clermont-Ferrand, France.
Received: 18 November 2014 Accepted: 13 April 2015
References
1. Gurgel ST, do Nascimento Jr P. Maintaining tissue perfusion in high-risk surgical patients: a systematic review of randomized clinical trials. Anesth Analg. 2011;112:1384–91.
2. Jhanji S, Lee C, Watson D, Hinds C, Pearse RM. Microvascular flow and tissue oxygenation after major abdominal surgery: association with post-operative complications. Intensive Care Med. 2009;35:671–7.
3. Lobo SM, Rezende E, Knibel MF, Silva NB, Paramo JA, Nacul FE, et al. Early determinants of death due to multiple organ failure after noncardiac surgery in high-risk patients. Anesth Analg. 2011;112:877–83.
4. Jhanji S, Vivian-Smith A, Lucena-Amaro S, Watson D, Hinds CJ, Pearse RM. Haemodynamic optimisation improves tissue microvascular flow and oxygenation after major surgery: a randomised controlled trial. Crit Care. 2010;14:R151.
5. Vallet B, Futier E. Perioperative oxygen therapy and oxygen utilization. Curr Opin Crit Care. 2010;16:359–64.
6. Shoemaker WC, Appel PL, Kram HB. Role of oxygen debt in the development of organ failure sepsis, and death in high-risk surgical patients. Chest. 1992;102:208–15.
7. Pearse R, Dawson D, Fawcett J, Rhodes A, Grounds RM, Bennett ED. Changes in central venous saturation after major surgery, and association with outcome. Crit Care. 2005;9:R694–9.
8. Silverman HJ. Lack of a relationship between induced changes in oxygen consumption and changes in lactate levels. Chest. 1991;100:1012–5. 9. Dubin A, Murias G, Estenssoro E, Canales H, Badie J, Pozo M, et al.
Intramucosal-arterial PCO2 gap fails to reflect intestinal dysoxia in hypoxic hypoxia. Crit Care. 2002;6:514–20.
10. Levraut J, Ciebiera JP, Chave S, Rabary O, Jambou P, Carles M, et al. Mild hyperlactatemia in stable septic patients is due to impaired lactate clearance rather than overproduction. Am J Respir Crit Care Med. 1998;157:1021–6.
11. Levy B, Mansart A, Montemont C, Gibot S, Mallie JP, Regnault V, et al. Myocardial lactate deprivation is associated with decreased cardiovascular performance, decreased myocardial energetics, and early death in endotoxic shock. Intensive Care Med. 2007;33:495–502.
12. Pope JV, Jones AE, Gaieski DF, Arnold RC, Trzeciak S, Shapiro NI. Multicenter study of central venous oxygen saturation (ScvO(2)) as a predictor of mortality in patients with sepsis. Ann Emerg Med. 2010;55:40–6. 13. Perz S, Uhlig T, Kohl M, Bredle DL, Reinhart K, Bauer M, et al. Low and
“supranormal”central venous oxygen saturation and markers of tissue hypoxia in cardiac surgery patients: a prospective observational study. Intensive Care Med. 2011;37:52–9.
14. Jansen TC, van Bommel J, Schoonderbeek FJ, Sleeswijk Visser SJ, van der Klooster JM, Lima AP, et al. Early lactate-guided therapy in intensive care unit patients: a multicenter, open-label, randomized controlled trial. Am J Respir Crit Care Med. 2010;182:752–61.
15. Jones AE, Shapiro NI, Trzeciak S, Arnold RC, Claremont HA, Kline JA. Lactate clearance vs central venous oxygen saturation as goals of early sepsis therapy: a randomized clinical trial. JAMA. 2010;303:739–46. 16. Donati A, Loggi S, Preiser JC, Orsetti G, Munch C, Gabbanelli V, et al.
Goal-directed intraoperative therapy reduces morbidity and length of hospital stay in high-risk surgical patients. Chest. 2007;132:1817–24. 17. Futier E, Robin E, Jabaudon M, Guerin R, Petit A, Bazin JE, et al. Central
venous O(2) saturation and venous-to-arterial CO(2) difference as complementary tools for goal-directed therapy during high-risk surgery. Crit Care. 2010;14:R193.
18. Vallee F, Vallet B, Mathe O, Parraguette J, Mari A, Silva S, et al. Central venous-to-arterial carbon dioxide difference: an additional target for goal-directed therapy in septic shock? Intensive Care Med. 2008;34:2218–25. 19. Futier E, Teboul JL, Vallet B. Tissue carbon dioxide measurement as an index
of perfusion: what have we missed? TACC. 2011;1:95–9.
20. Teboul JL, Mercat A, Lenique F, Berton C, Richard C. Value of the venous-arterial PCO2 gradient to reflect the oxygen supply to demand in humans: effects of dobutamine. Crit Care Med. 1998;26:1007–10.
21. Bakker J, Vincent JL, Gris P, Leon M, Coffernils M, Kahn RJ. Veno-arterial carbon dioxide gradient in human septic shock. Chest. 1992;101:509–15.
23. Shoemaker WC, Appel PL, Kram HB, Waxman K, Lee TS. Prospective trial of supranormal values of survivors as therapeutic goals in high-risk surgical patients. Chest. 1988;94:1176–86.
24. Le Gall JR, Lemeshow S, Saulnier F. A new Simplified Acute Physiology Score (SAPS II) based on a European/North American multicenter study. JAMA. 1993;270:2957–63.
25. Dindo D, Demartines N, Clavien PA. Classification of surgical complications: a new proposal with evaluation in a cohort of 6336 patients and results of a survey. Ann Surg. 2004;240:205–13.
26. Bennett-Guerrero E, Welsby I, Dunn TJ, Young LR, Wahl TA, Diers TL, et al. The use of a postoperative morbidity survey to evaluate patients with prolonged hospitalization after routine, moderate-risk, elective surgery. Anesth Analg. 1999;89:514–9.
27. van Beest PA, Lont MC, Holman ND, Loef B, Kuiper MA, Boerma EC. Central venous-arterial pCO(2) difference as a tool in resuscitation of septic patients. Intensive Care Med. 2013;39:1034–9.
28. Groeneveld AB. Interpreting the venous-arterial PCO2 difference. Crit Care Med. 1998;26:979–80.
29. Lamia B, Monnet X, Teboul JL. Meaning of arterio-venous PCO2 difference in circulatory shock. Minerva Anestesiol. 2006;72:597–604.
30. Gutierrez G. A mathematical model of tissue-blood carbon dioxide exchange during hypoxia. Am J Respir Crit Care Med. 2004;169:525–33.
31. Neviere R, Chagnon JL, Teboul JL, Vallet B, Wattel F. Small intestine intramucosal PCO(2) and microvascular blood flow during hypoxic and ischemic hypoxia. Crit Care Med. 2002;30:379–84.
32. Mecher CE, Rackow EC, Astiz ME, Weil MH. Venous hypercarbia associated with severe sepsis and systemic hypoperfusion. Crit Care Med. 1990;18:585–9. 33. Collaborative Study Group on Perioperative ScvO2 Monitoring. Multicentre
study on peri- and postoperative central venous oxygen saturation in high-risk surgical patients. Crit Care. 2006;10:R158.
34. Rivers E, Nguyen B, Havstad S, Ressler J, Muzzin A, Knoblich B, et al. Early goal-directed therapy in the treatment of severe sepsis and septic shock. N Engl J Med. 2001;345:1368–77.
35. Textoris J, Fouché L, Wiramus S, Antonini F, Tho S, Martin C, et al. High central venous oxygen saturation in the latter stages of septic shock is associated with increased mortality. Crit Care. 2011;15:R176. 36. Shepherd SJ, Pearse RM. Role of central and mixed venous oxygen
saturation measurement in perioperative care. Anesthesiology. 2009;111:649–56.
37. Futier E, Constantin JM, Petit A, Chanques G, Kwiatkowski F, Flamein R, et al. Conservative vs restrictive individualized goal-directed fluid replacement strategy in major abdominal surgery: a prospective randomized trial. Arch Surg. 2010;145:1193–200.
38. Cuschieri J, Rivers EP, Donnino MW, Katilius M, Jacobsen G, Nguyen HB, et al. Central venous-arterial carbon dioxide difference as an indicator of cardiac index. Intensive Care Med. 2005;31:818–22.
Submit your next manuscript to BioMed Central and take full advantage of:
• Convenient online submission
• Thorough peer review
• No space constraints or color figure charges
• Immediate publication on acceptance
• Inclusion in PubMed, CAS, Scopus and Google Scholar
• Research which is freely available for redistribution