Abstract: Maximum value of power can be derived from the solar PV system under the external discomposure and the variable solar irradiance using MPPT technique. Different literatures supplicate a number of MPPT techniques that can capture the power at the particular point known as maximum power point (MPP). This paper focuses on the grey wolf optimization (GWO) based MPPT technique and represents the comparison between PSO MPPT and the proposed GWO MPPT under same solar irradiance. A converter of boost type is implemented in this paper to rise the solar PV voltage. The suggested MPPT technique contributes meticulous and agile expelling for an isolated PV system. Comparisation between the two above mentioned MPPT methods is analyzed by using Matlab/ Simulink environment.
Keywords : Greywolf optimization (GWO), maximum power point (MPP), particle swarm optimization (PSO), photovoltaic (PV) system, maximum power point tracking (MPPT), Simulink.
I. INTRODUCTION
I
ndustries all around the world require more energy for its operation and performance. The traditional energy resources like fossil fuels are not enough to meet the demand as it decreases rapidly in the recent years. So to maintain the energy need by the industries are the major challenge in the future. Various renewable sources are implemented to fulfill the energy demand now a day. Major source is the solar energy, which can be directly convert the sunlight using the solar panels and can be solar water heating with the solar collectors.The power-voltage and current-voltage characteristics are non-linear for the PV system with a particular location at which power is optimum. It can be achieved using MPPT algorithm [1]. The point where the maximum power is obtained depends upon the temperature of the cell and irradiance of the solar radiation. Because, these parameters varies throughout the day and also changes regulated by different seasons throughout the year, so it is major concern to track the MPP properly subject to variable conditions for achieving maximum power. Various MPPT techniques are
Revised Manuscript Received on September 03, 2019
* Correspondence Author
Manoj Kumar Sahu*, Dept. of Electrical Engineering, CAPGS, BPUT, India. Email: [email protected]
Shubhakam Hota, Dept. of Electrical Engineering, DRIEMS, BPUT, Odisha, India. Email: [email protected]
Jagan Mohana Rao Malla, Dept. of EE, BPUT, Govt. of Odisha, India. Email: [email protected]
Anup Kumar Panda, Dept. of EE, NIT Rourkela, Odisha, India. Email: Email: [email protected]
Sribatsa Behera, Dept. of Instrumentation & Electronics Engineering, CET, BPUT, Govt. of Odisha, India. Email: [email protected]
described in literature [2]. The MPPTs differ in many manners with each other that are price, efficiency, complexity and sensor required etc.
Literature [3] shows that there are two main MPPT algorithms which are conventional and non-conventional. Various schemes have been suggested for conventional MPPTs. In conventional MPPT, the hill climbing (HC) type MPPT and the MPPT of incremental conductance (IC) type are most popular. In HC type, the DC-DC converter’s duty cycle is perturbed during dDdP
0
. Hence MPP can betracked during this period. The IC method provides the advantages that, it gives high efficiency under rapid changing atmospheric condition. This method is based upon achievement of output voltage at MPP by varying the output current. The MPP is tracked, when IC, i.e.
V
I
V I
(instantaneous conductance). The perturb and observe
(P&O) method is mostly used by the researcher for its simple structure. The P&O method uses the condition dVdP to determine whether the MPP has been found or not.
The non-conventional algorithms inspired biologically and most preferable MPPT algorithm because of its faster convergence and accurate solution to track the global peak. PSO and ant colony systems (ACS) methods are generally considered as non-conventional algorithms. PSO attains more importance for its simple structure and faster convergence [4] [5].
This paper presents two distinct control methods for modelling of an isolated photovoltaic (PV) system. The main work carried out in this paper is to compare the GWO technique along with PSO technique by using Matlab/ Simulink environment.
This article is divided as: Section II presents the behavior of a PV module and operation of a boost converter. Section III shows PSO and the proposed GWO algorithm for tracking MPP. The outcomes of simulation are described in Section IV. Finally, the conclusions are presented in Section V.
Fig. 1 represents the simple block diagram of the proposed GWO technique.
Fig. 1.Simple block diagram of the proposed GWO model
Simulation of MPPT based Standalone PV
Module Design using GWO and PSO Technique
II. CHARACTERISTICSOFTHESOLARSYSTEM A. PV Module
Due to non-linear behavior of the PV module, variation of output power takes place. Series combination of PV cells constitutes a required PV module. The PV cell model consists of the configuration of the single diode. The module of PV contains an ideal current source (
ph
[image:2.595.59.257.189.333.2]I ), which directly depends upon solar irradiance, in parallel with a diode. It is presented in Fig. 2.
Fig. 2.PV cell equivalent model [14]
The Schematic diagram consists of a diode, photo current, series diode resistance and shunt field resistance. The output power-voltage(P-V) and current-voltage(I-V) characteristics of the proposed PV model is expressed with the help of following equation (1), (2), (3), (4), (5) and (6) respectively.
The total current is given as,
sh d ph
I
I
I
I
[16] (1)Where
I
d = diode current [16],I
sh = shunt field current[16].The photo current is given as,
sc op ref
ro
ph
I
I
K
T
T
I
1 [14] (2)
d
I
can be expressed as:
1 . . exp T D s d V V I I
exp 1
q kT V I OP D s
exp 1
OP se s kT IR V q I
exp 1
T se s V IR V q I
exp 1
S T se P s CN V IR V N I
exp 1
S T se P s CN V IR V N I 1 . . exp C V N IR N V N I I T S se S P s d (3)
Where = Ideality factor = 1.36,
k
= Boltzmann’s constant = 2310
*
3
.
1
m2 kg s-2 K-1, q = charge in electron = 1910
*
6
.
1
C, C = Number of cells = 36 [14],1
P
S N
N Number of series and parallel paths [14].
Reverse current saturation can be expressed as,
k
qE
T
T
T
T
I
I
g ref OP ref OP rsS
*
1
1
exp
*
*
3 (4)Where Reverse current saturation at operating temperature and is given as,
1
exp
OP OC I rs kCT qV
I S C
(5)
Where OC
V = open circuit voltage = 21.1 V [14], ISC= short
circuit current = 3.8 A [14]
Now the shunt field current is given as [14],
sh IR V sh
R
I
se(6)
Where V = the output voltage, Rse = series diode
resistance 2
/ 000365 .
0 cm
, Rsh = shunt field
resistance 2
/ 017 .
0 M cm
. Diode quality factor= 1.36.
The resistance offered by the semiconductor material and the contact leads is the series diode resistance (Rse). The path of short circuit at the junction is formed due to having impurities on the surface of the edge of the cell; it is termed as shunt field resistance [7].
The grid voltage and current demand can be fulfilled by implementing the combination of series and parallel PV cells. Fig. 3 and Fig. 4 represent the behavior of I-V and P-V of the proposed PV module, respectively [8]. Here,
V
oc andSC
[image:2.595.317.541.598.721.2]I have their usual meaning. At both
V
oc andI
oc, the power becomes zero. When the linear multiplication of V and I is maximum, the condition for maximum power is obtained. The point at which linear product of V and I is maximum, that point is named as MPP ([2], [3]).Fig. 4.P-V curve of proposed PV module [14]
B. Boost Converter Operation
Boost converter act as major part of the function of PV module. It controls the duty cycle (D) for maintaining the desirable PV module voltage of output. D is calculated as
T t
D ON . The required PV module voltage of output is
calculated as
D V
V in
out
1
. When D0,VoutVin and
whenD1,Vout.
The minimum value of duty cycle is 0 and it varied up to 1. The optimum value of output power can be achieved by properly adjusting D. The Fig. 5 represents the basic boost converter circuit. The circuit contains a capacitor, an inductor, a switch (MOSFET/IGBT) and the load [8].
Fig. 5.Schematic diagram of dc-dc boost converter When S1 is ON, L1 is magnetized due to source voltage
[image:3.595.306.548.126.189.2]with polarity +ve on left side and –ve on right side. The current through the inductor linearly rises and the path of current flow is shown in Fig. 6 due to offer of low resistance path. Due to –ve polarity on P side (i.e. the polarity introduced due to inductor), the diode is getting reversed biased. So, due to this the cut-off of the load is obtained from the source.
Fig. 6.Boost converter operation at switch ON During the OFF condition of the switch, the switching waveform touches the time axis. The MOSFET is open circuited and the inductor which stores charge in magnetic domain in mode-1 is now demagnetized due to reversal of
current. The polarity reversal in inductor introduces higher potential at p side of the diode which makes it forward biased. The demagnetization of inductor helps to charge the capacitor and also supplies the load which is shown in Fig. 6. In this mode higher voltage Vin+Vl –(diode drops) appears across the
[image:3.595.65.287.448.522.2]load which is presented in Fig. 7.
Fig. 7.Boost converter operation at switch OFF [14] Furthermore during ON period the discharging of capacitor with same polarity supplies the load.
III. MPPTMETHODS A. PSO Technique
The optimization technique of PSO based algorithm is based upon schooling of fish or flocking of birds social characteristics. In the year 1995, this algorithm is proposed by Eberhart and Kennedy. This optimization technique resembles with genetic algorithm. Now several modifications are done with original PSO [12]. Modification is based on how could easily achieve the ultimate decision. The proposed modified algorithm will play a vital role in problem solving.
A basic variant of the PSO technique works on the theory that groups of bird are searching their food in the particular area randomly. But, only single piece of food is present in that described area searching by group of bird. The birds have no idea about the exact location of food. They have only idea of distance between them and food in every iteration [13]. The best effective way for finding the food is to go after the bird which flies nearest the location of the food. At nearest location of food the bird will inform to its follower to achieve their best position. This process will continue till the finding the exact location of food. In PSO, each single solution is a bird, named as particle. The discussed particle has some value of fitness. These are computed the function of fitness needed to be optimized [14]. In each stage of iteration, updation of each particle is achieved by referring the values of two best solutions.
(a). P-best: It can be taken as best solution obtained due to the particular position of the bird.
(b). G-best: It can be considered as best solution among the entire particle present in the population.
After getting the values of P-best and G-best, particles will upgrade their velocity and position in addition with the below mentioned two equations.
Particle (i).velocity = w*Particle (i).velocity + * rand (varsize) * (particle (i).Best. Position – particle (i).position) + *rand (varsize) * (0-particle (i).position). (1)
Particle (i).position = particle (i).position + particle (i).velocity. (2)
Algorithm for PSO is described by the below pseudo code. for every particle
[image:3.595.63.287.647.714.2]Do
For every particle (3)
D
A
t
X
t
X
(
1
)
p(
)
.
Compute value of fitness if fitness is healthy than best fitness set present value as P best [15]. End
for every particle
Select the particle having best optimum values among all Save as G-best
end.
For every particle
Velocity of the particle can be computed as per equation (1) The location of the particle can be computed as per equation (2)
The implementation of PSO algorithm in MPPT technique, calculation of PV module is based on the above algorithm that, it is starting with initialization of each particle (i.e. voltage or current). After this, every particle fitness value (power) can be computed. If the value of fitness (power) is superior to best fitness (i.e. best power), then current value is set as P-best. Now particle can be selected (voltage or current) having best fitness quantity among all particles and set as G-best. Now for every particle (voltage or current), velocity of the particle can be computed (increment in voltage or current in each iteration) according to above equation (1). Again calculate particle position (current value of voltage or current) according to the equation (2) for each particle (voltage or current) [16].
B. Proposed GWO Techniques
This section represents the mathematical analysis of the proposed GWO technique. The concept of the GWO algorithm is based on the hunting mechanism and leadership quality of grey wolves. Here, grey wolves are categorized as four types. These are alpha, beta, delta and omega and are employed to work through three steps. These are: (i) searching the prey, (ii) encircling the prey (iii) hunting the prey.
From the four types of grey wolves, alpha is the leader, beta is next to alpha. If alpha dies, beta takes its position. Next to beta is delta. Delta wolves are sub-ordinates to alpha and beta but dominates omega. They are scouts, sentinels, elders and care takers.
The main phase of grey wolves can be categorized as: “(tracking, chasing the prey), (pursuing, encircling the prey) and (attacking the prey)”.
Mathematical model:
To design the mathematical model, we consider alpha as the leader and the best solution, then the second solution is beta and the third solution delta. The lowest rank wolves are omega.
Mathematical model can be designed by considering the encircling behavior and the hunting behavior. The below mentioned equations are represented as:
)
(
)
(
.
X
t
X
t
C
D
p
(4)
Where t = current iteration.
)
(
t
X
p Position vector of prey
X
Position vector of grey wolves
C
A
&
Co-efficient vectorX
X
C
D
1.
X
X
C
D
1.
X
X
C
D
1.
A
D
X
X
1
1.
A
D
X
X
2
2.
A
D
X
X
3
3.
3
)
1
(
X
1X
2X
3t
X
(5)The above equations are used in GWO MPPT technique for tracking the MPPP from the standalone PV module [13].
IV. RESULTSOFSIMULATION
The efficiency and operational capability of the proposed GWO MPPT technique is compared with PSO MPPT technique using the Matlab/Simulink environment. The result shows that the optimum capability for tracking the MPP is superior in GWO as compared with the PSO technique. The waveforms and their outcomes are represented in this section. A. PSO Algorithm Simulation
Soft switching characteristics of boost converter are implemented in this standalone PV system. It works as an interface and its primary objective is to decrease the ripple of the input current and also reduces the converter switching losses.
Fig. 8.Boost converter voltage of PSO
Fig. 9.Boost converter current of PSO
Fig. 10. Boost converter power of PSO B. Proposed GWO Algorithm Simulation
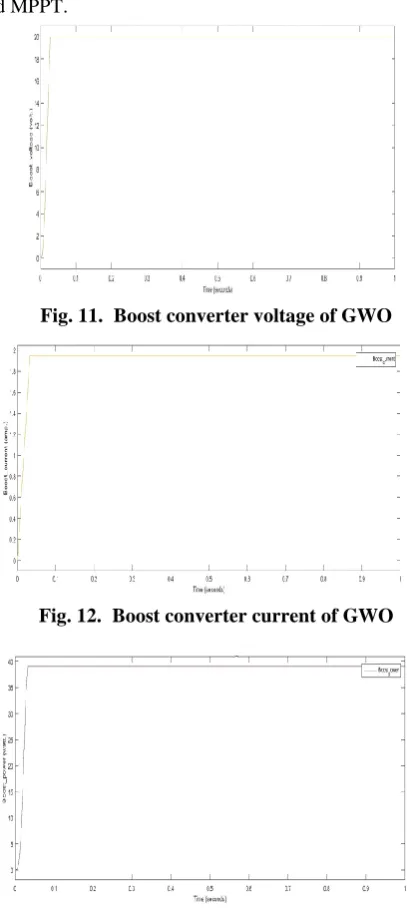
The proposed GWO MPPT algorithm is the solution for the above mentioned problem. The Fig. 11, 12 and 13 shows the transient analysis of major parameters like voltage, current and power respectively with GWO MPPT technique. The paper shows the attention that the proposed MPPT technique is more fast and precise than the PSO MPPT technique.
[image:5.595.347.507.49.130.2]The main parameters used in the proposed MPPT technique are represented in the table- I as:
Table- I: Parameters of GWO algorithm
Parameters Value
Maximum iteration
50
Number of Search agent
30
A
(Co-efficient vector)a
r
a
.
1
2
C
(Co-efficient vector)2
.
2
r
2 1
,
r
r
Random variables in [0 1]a Linearly decreases from 2 to 0
[image:5.595.325.529.216.672.2]The output boost converter voltage is obtained as 20 volt, boost converter current is as 1.95 Amp and the converter power is obtained as 39 watt. The voltage value is same as PSO MPPT but the plot obtained is more linear than with PSO MPPT. The current value increases to 1.99 Amp, so the boost converter power will increase to 39.5 watt. So more power will be delivered in case of GWO based MPPT than PSO based MPPT.
Fig. 11. Boost converter voltage of GWO
Fig. 12. Boost converter current of GWO
[image:5.595.89.251.696.784.2]Table- II: Comparison results Shadin
g pattern
Tracking technique
Maximum power (W)
Maximum voltage (V)
Maximum current (A)
1S1P PSO MPPT 39 20 1.95
1S1P GWO MPPT
40 20 1.99
2S2P PSO MPPT 40 20 2.1
2S2P GWO
MPPT 40 20 2.2
V. CONCLUSION
The simulation of the proposed GWO MPPT algorithm implemented in standalone PV system shows that the parameters like maximum power (Pmax) and maximum
current (Imax) has a larger value as compared with PSO based
MPPT technique. Simulation shows that for 1 series 1 parallel prototype, the Pmax has value of 40 W (where it is 39W in case
of PSO). Similarly Imax has increased to 1.99 A (where it is
1.95A). This experimental result can also be verified from that waveform in MATLAB SIMULINK platform. Simulation data shows that the proposed converter is able to maintain maximum voltage of 20V constantly at tracking point.
REFERENCES
1. R. Faranda and S. Leva, “Energy comparison of MPPT techniques for PV systems,” WSEAS Transactions on power Systems, Vol. 3, no. 6, pp. 446-455, 2008.
2. S. V. Dhople and D. Garcia, “Estimation of photovoltaic system reliability and performance metrics,” IEEE Trans. Power Syst., Vol. 27, No. 1, pp. 554-653, February 2012.
3. T. Esram and P. L. Chapman, “Comparison of photovoltaic array maximum power point tracking techniques”, IEEE Trans. Energy Convers., pp. 439-449, 2007.
4. H. Abidi, A. B. Ben Abdelghani and D. Montesions, “MPPT algorithm and photovoltaic array emulator using DC/DC converters”, Electro technical Conference (MELECON), 16th IEEE Mediterranean, pp. 566-571, 2012.
5. A. Durgadevi, S. Arulselvi and S. Natarajan, “Study and implementation of maximum power point tracking (MPPT) algorithm for photovoltaic systems,” Electrical Energy Systems (ICEES), 1st International Conference on, pp. 241-244, 2011.
6. D.P. Hohmand, M.E. Roop, “Comparative study of maximum power point tracking algorithm,” Progress in Photovoltaic: Research and Application, vol. 11, no. 1, pp. 47-62, 2003.
7. H.A.C. Braga and I. Barbi, “A 3-KW unity power factor rectifier based on a two-cell boost converter using a new parallel connection technique,” IEEE Transactions on Power Electronics, 14 (1) pp. 209-217, 1999.
8. P. Thounthong, P. Sethaku, S. Rael and B. Davat, “Design and implementation of 2-phase interleaved boost converter for fuel cell power source,” Proc. International Conference on Power Electronics, Machines and Drives, PEMD, pp. 91-95, 2008.
9. U. Kishan, C. Pang, S. V. Pavan and K. Mohan, “Comparison of MPPT Techniques for SEPIC Converter Based Photovoltaic System”, 2016 Online International Conference on Green Engineering and Technologies (IC-GET).
10. K. Ishaque, Z. Salam, M. Amjad and S. Mekhilef, “An improved particle swarm optimization (PSO)-based MPPT for PV with reduced steady-state oscillation”, IEEE Trans. Power Electron., pp. 3627-3638, 2012.
11. P. Selvapriyanka and G. Vijayakumar, “particle based optimization based MPPT for PV system under partial shading condition”, IJIRSET. Vol. 3, special Issue 1, Jan. 2014.
12. P. K. Tripathy, et al., “Multi-objective Particle swarm optimization with time variant inertia and acceleration co-efficient,” Information Sciences, vol. 177, pp. 5033-5049, 2007.
13. S. Mirjalili, S. M. Mirjalili. And A. Lewis, “Grey wolf Optimizer”, Adv. Eng. Software, vol. 69, pp. 46-61, 2014.
14. [14] S. Hota, M. K. Sahu, J. M. R. Malla, “A standalone PV system with a ybrid P&O MPPT optimization technique” Engineering
Technology & Applied Science Research (ETASR), Vol. 7, No. 6, pp. 2109-2112, 2017.
15. M.K. Sahu, S. Hota, J. M. R. Malla, S. Behera, “Modelling and Simulation of P&O and PSO based MPPT Technique of a Standalone PV System”, IJRTE, Vol. 8, No. 3, Sept. 2019.
16. P. Ducange, M. Fazzolari, B. Lazzerini, F. Marcelloni. "An intelligent system for detecting faults in photovoltaic fields", 11th International Conference on Intelligent Systems Design and Applications, 2011.
AUTHORSPROFILE
Dr. Manoj Kumar Sahu is currently working as Associate prof. and Head in the Dept. of Electrical Engineering in CAPGS, BPUT, Odisha, India. He has done his B.Tech from VSSUT, Burla in the year 1997 and M.Tech. from KIIT University in 2007. After having experience in teaching and research, he has done Ph.D. from Utkal University in 2014. He has a long 20 years of experience in both teaching and research. He has published 22 no. of papers in both national and international journals & conferences. He is the life member of ISTE(India) & IE(India). His research interest includes inverter controlled of electrical drives, control of induction motor drives, solar energy PV system, etc. Mail id.: [email protected]
Mobile No: +91-9437225468
Er. Shubhakam Hota is currently working as Assistant Professor in the Dept. of Electrical Engineering in DRIEMS, Odisha , India . He has done his B.Tech from CEC, BPUT, Odisha, in the year 2014 and M.Tech. from CAPGS, BPUT in 2017. He has 02 years of experience in both teaching and research. He has published 05 no of papers in both national and international level.
Mail Id: [email protected]
Mobile No: +91-9348781774
Er. Jagan Mohana Rao Malla is currently working as Associate Professor and HOD in RITW, Hyderabad, India in the Dept. of Electrical and Electronics Engineering. He has done his B.Tech from SRKR Engineering College, A.P., India in 2003 and M.Tech. from GEC, Gudlavalleru, A.P. in the year 2010. At present he is perusing his research work at BPUT. He has 15 years of experience in teaching and research. He has published 15 papers in international journal and conferences.
Mail Id: [email protected]
Mobile No: +91-7799476923,7680923199
Prof. Anup Kumar Panda was born in 1964. He received a BSc. degree in Electrical Engineering from the University College of Engineering (at present VSSUT University), Burla, Sambalpur University, India in 1987. He received a M.Tech (Power Electronics and Drives) from the Indian Institute of Technology, Kharagpur, India in 1993 and a Ph.D. in 2001 from Utkal University. He has 30 years of experience in teaching and research. He has published over fifty articles in journals and conferences. At present he is continuing as a professor in the department of electrical engineering at the National Institute of Technology, Rourkela. His research interests include power electronics, Power quality improvements in power system and electrical drives, etc. He is the member of FIET (UK), FIE, FIETE, Senior Member IEEE (USA).
Mail Id: [email protected]
Prof. Sribatsa Behera is currently working as Professor in the Department of Instrumentation and Electronics Engineering, CET, BPUT, Govt. of Odisha, Bhubaneswar, India. He has done his B.Tech from UCE Burla (At present VSST, Burla), M. Tech. from IIT Khragpur and Ph.D. from IIT Kanpur. He has more than 30 years of experience in teaching and research. His area of interest is power electronics, AC/DC drives, control system, microprocessor and solar PV technology, etc.
![Fig. 2. PV cell equivalent model [14]](https://thumb-us.123doks.com/thumbv2/123dok_us/8179031.254361/2.595.59.257.189.333/fig-pv-cell-equivalent-model.webp)
![Fig. 7. Boost converter operation at switch OFF [14]](https://thumb-us.123doks.com/thumbv2/123dok_us/8179031.254361/3.595.63.287.647.714/fig-boost-converter-operation-switch.webp)