Transport and reduction of nitrate in clayey till
underneath forest and arable land
Peter R. Jørgensen
a,*, Johanne Urup
b, Tina Helstrup
b,
Marina B. Jensen
c, Finn Eiland
d, Finn P. Vinther
daDanish Geotechnical Institute, Maglebjergvej 1, DK-2800, Lyngby, Denmark
bGeological Institute, University of Copenhagen, Øster Voldgade 10, 1350 Copenhagen K, Denmark cRoyal Danish Veterinary and Agricultural University, Thorvaldsensvej, 28, DK-2000 Copenhagen F, Denmark
dDanish Institute of Agricultural Research, Research Centre Foulum, DK-8830 Tjele, Denmark
Received 20 May 2003; received in revised form 30 December 2003; accepted 9 January 2004
Abstract
Transport and reduction of nitrate in a typically macroporous clayey till were examined at variable flow rate and nitrate flux. The experiments were carried out using saturated, large diameter (0.5 m), undisturbed soil columns (LUC), from a forest and nearby agricultural sites. Transport of nitrate was controlled by flow along the macropores (fractures and biopores) in the columns. Nitrate reduction (denitrification) determined under active flow mainly followed first order reactions with half-lives (t1/2) increasing with depth (1.5 – 3.5 m) from 7 to 35 days at the forest site and 1 – 7 h at
the agricultural site. Nitrate reduction was likely due to microbial degradation of accumulated organic matter coupled with successive consumption of O2 and NO3 in the macropore water
followed by reductive dissolution of Fe and Mn from minerals along the macropores. Concentrations of total organic carbon measured in soil samples were near identical at the two study sites and consequently not useful as indicator for the observed differences in nitrate reduction. Instead the high reduction rates at the agricultural site were positively correlated with elevated concentration of water-soluble organic carbon and nitrate-removing bacteria relative to the forest site. After high concentrations of water-soluble organic carbon in the columns from the agricultural site were leached they lost their elevated reduction rates, which, however, was successfully re-established by infiltration of new reactive organics represented by pesticides. Simulations using a calibrated discrete fracture matrix diffusion (DFMD) model could reasonably reproduce the denitrification and resulting flux of nitrate observed during variable flow rate from the columns.
D2004 Elsevier B.V. All rights reserved.
Keywords:Transport; Reduction; Nitrate; Clayey till; Forest and arable land
0169-7722/$ - see front matterD2004 Elsevier B.V. All rights reserved. doi:10.1016/j.jconhyd.2004.01.005
* Corresponding author. Hedeselskabet, Ringstedvej 20, DK-4000 Roskilde, Denmark. E-mail address:[email protected] (P.R. Jørgensen).
1. Introduction
In many areas of Denmark and other northern hemisphere countries, deposits of clay-rich till constitute the parent material of highly productive agricultural soils and underlying clay-rich aquitards. These aquitards provide varying degrees of protection of deeper aquifers against nitrate pollution from agriculture depending on properties such as fracturing, thickness, hydrology, geo-biochemistry and mineralogy.
Nitrate reduction is part of the denitrification process, which can take place under anaerobic conditions mainly developing during water-saturated conditions (see Korom, 1992, for review of processes). The overall denitrification process can be described as:
2NO3 þ12Hþþ10e!N2þ6H2O ð1Þ
N2O is an intermediate product in the transformation from NO3to N2.
Electrons needed for denitrification can originate from microbial oxidation of organic matter (electron donor):
5CH2Oþ4NO3 !2N2þ4HCO3 þCO2þ3H2O ð2Þ
for which reaction the Gibbs standard free energy is 448 kJ mol1CH2O representing
the organic matter(Berner, 1980).
Fractures and biopores (macropores) have been shown to constitute zones of increased densities of bacteria associated with downward transport and accumulation of organic material from natural vegetation and agricultural (and industrial) production (see e.g. Canadell et al., 1996; Jørgensen et al., 1998a,b, 2002; Vinther et al., 1999; Jensen et al., 1999). The occurrence of this sub-environment is visually apparent in most sub-soil profiles of oxidized till as a distinct bleached pattern of local chemical alteration along macropore walls (microsites) extending from the root zone and sometimes down to 10 m depth or more (e.g. Bru¨mmer, 1974; Jørgensen and Fredericia, 1992; Blume, 1988). Several studies have shown that locally increased potentials for denitrification are frequently associated with the microsites (e.g. Fujicawa and Hendry, 1991; Ernstsen et al., 1998a,b). Besides hosting microsites the macropores also typically conducts more than 90% of downward water flow in the tills (e.g. Jørgensen et al., 1998a,b,c; Sidle et al., 1998; Jørgensen et al., 2002). In previous nitrate studies, however, the correlation between microsites and preferential flow paths in the soil has not been investigated and consequently the implications of observed nitrate reduction rates for downward nitrate fluxes in the aquitards, is largely unknown.
The overall aim of this study is to investigate the dynamic relation between transport and reduction of nitrate, and the resulting nitrate flux as recorded during active flow along macropores in the aquitards of a forest and nearby agricultural sites. Specific objectives were (1) to study the influence of land use inherent in columns on the reduction of nitrate applied to the till, (2) evaluate the role of macropores and associated bleached microsites along macropores and bulk matrix to the overall transport and reduction of nitrate, and (3) assess key parameters controlling nitrate reduction. A further objective was to evaluate discrete fracture matrix diffusion (DFMD) modeling as numerical approach (seeJørgensen et al., 2004 for comparison of different numerical approaches for simulation of non-reactive solute transport at variable flow and time) for studies and assessment of nitrate transport and vulnerability of aquifers situated underneath clayey till aquitards.
2. Materials and methods
2.1. Soil materials
Large undisturbed till columns (LUC), 0.5 m high and 0.5 m in diameter, were excavated from 1.7 to 4 m depth in a beech forest and from arable land near the villages of Hinnerup and Grundfør, respectively, in the western part of Denmark (Fig. 1). Additional small soil samples were collected from 10 to 20 cm increments by inserting steel tubes (diameter: 6 cm) approximately 10 cm into the vertical wall of the excavations at both sites. The upper 3 to >10 m of the geological profile at the two study sites is clayey till with 17 – 25 % clay. The till is water saturated from approximately 0.5 and 2 m depth at the forest and agricultural sites, respectively, at high water table during winter, and from 3 to 3.5 m depth at lowest water table in summer at both sites. At the forest site the till layer is >10 m thick and the lower seasonal water table is represented by the lower boundary of yellowish brown oxidized till, while at greater depth (>3.5 m) the till is grey and unoxidized due to permanent water saturation. The clayey till of the agricultural site overlies a sandy aquifer at approximately 3.5 m depth. Both the clay and the sand unit are oxidized throughout this profile. At both field sites the dominant direction of hydraulic gradient is downward indicating a flow direction from the ground surface into the underlying aquifers. A geological description of the area is provided by Gravesen (1996).
At both study sites numerous biopores (mainly root channels) and vertical fractures were observed in the clays throughout 1010 m wide and 3 – 4 m deep excavations made at each site. Pronounced secondary chemical alteration of the macropore walls(Fig. 2) is occurring both along the fractures and root channels, and resembles the redox features (microsites) described in clayey till byJørgensen and Fredericia, (1992). These are generally developed along macropores in near surface clayey deposits (Madsen, 1983).
carbon (TOC) by standard procedure(Klute, 1986)and for water-soluble organic carbon by shaking the samples for 1 h with demineralized water at a soil-to-water ratio of 1:2 and measuring the carbon content of the filtrates by UV-persulfate oxidation with IR detection of CO2 (Dohrmann DC-180 Total Organic Carbon Analyzer, Certex). The content of
adenosine tri-phosphate (ATP), a measure of microbial biomass, in soil samples was determined as described byLind and Eiland (1989). Similarly, the effluent solution from the column experiments (se below) were analysed for dissolved organic carbon (DOC) and ATP. Nitrate reducing bacteria were enumerated as described byVinther et al. (1999). The soil samples for the study were collected in autumn immediately after harvest from the agricultural site and in winter from the forest site.
2.2. Column experiments
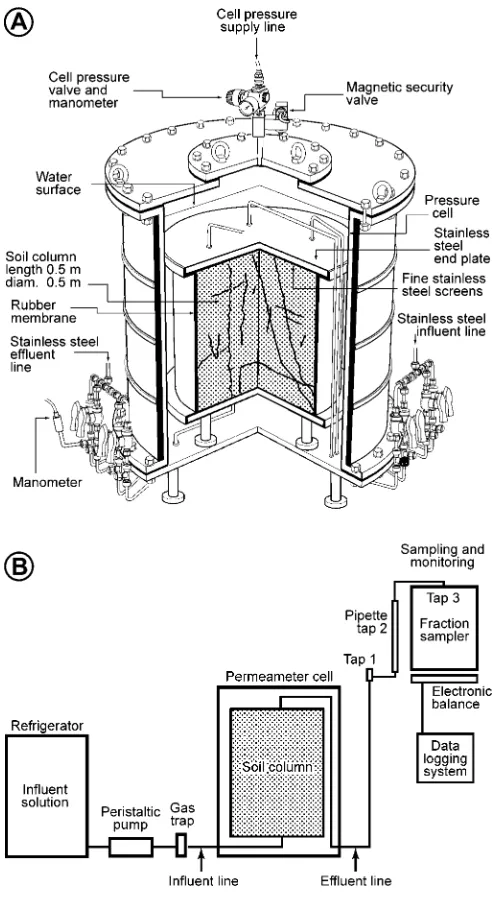
[image:4.468.109.356.68.398.2]The large undisturbed columns (LUC) were used for experiments with transport and reduction of applied nitrate during controlled saturated flow using well defined hydraulic
gradients. The columns are assumed to be representative for the till matrix and macropores by containing approximately the same high density of these structures as observed at the field sites (Jørgensen et al., 2004). Fig. 3A shows an ‘‘open cut’’ of the large column permeameter, which allow for controlled studies of flow and solute transport in undis-turbed soil columns under well-defined boundary condition. In all columns 96% to >99% of the water flow occurred as preferential flow along isolated biopores embedded in the clayey matrix or in root channels following fracture planes (seeFig. 5,Jørgensen et al., 2004). The sampling and set-up of the LUC and hydraulic properties of the columns is described in detail byJørgensen et al. (2004).
[image:5.468.61.413.71.302.2]The nitrate investigations with the columns were performed with constant influent concentrations of nitrate for each column. The experimental device used for the experi-ments is shown inFig. 3B. On-line refrigeration of the influent solution and insulation of the influent and effluent flow lines was combined with cooling the complete LUC system in order to maintain a temperature at 12F2 jC during the experiments. Flow during the experiments was controlled with peristaltic pumps, and corresponding hydraulic gradients were monitored during experiment to see that hydraulic properties of the columns were not changing during experiments(Jørgensen et al., 2004). Discrete samples of effluent were collected with a fraction collector (3700 Portable Sampler, ISCO) for analysis of nitrate, while samples for analysis of redox-sensitive parameters were collected in vacutainers injected from outlet ports directly on the effluent line (‘‘taps’’ inFig. 3B). The water used for influent solution in the experiments was obtained from the study sites or a confined
aquifer at a site that is geologically similar to the site where the columns were taken. Major ions measured for the influent (in mg l1) were Ca2 +: 94 – 96, Mg2 +: 22 – 25, Na+: 33 – 105, K+: 4.3 – 5.2, Fe2 +: 0.04 – 0.06, Mn2 +: < 0.005 – 0.01, SO42: 14 – 23, HCO3: 378 –
391, O2: 7 – 11. DOC was 10 – 30 mg/l and the pH was 7.8 (F0.1).
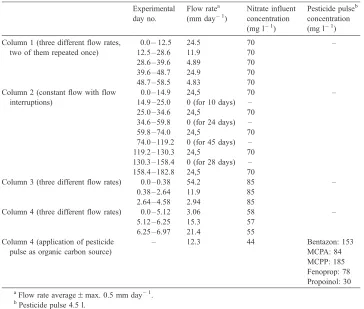
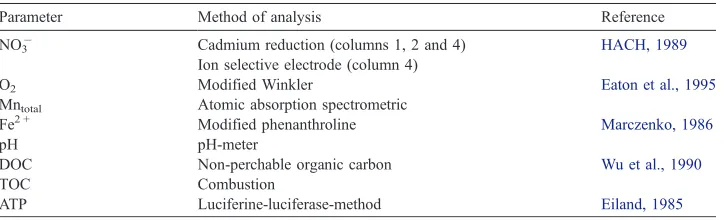
[image:6.468.108.355.70.520.2]Influent concentrations together with flow sequences applied for the experiments are shown inTable 1. The different flow sequences inTable 1 have been chosen in order to increase the number of flow situations relevant for field condition of the nitrate transport, and to provide the data for testing the ability of the DFMD model to reproduce such transport. Influent and effluent chemical analysis and methods of analysis are listed in Table 2. Normalized concentrations (C/Co) of nitrate and bromide were calculated as (CeffluentCbackground)/(CinfluentCbackground).
2.3. Transport model
2.3.1. Model code
[image:7.468.55.419.304.613.2]Evaluation of nitrate effluent concentrations and reduction in the columns was carried out using the Discrete Fracture Matrix Diffusion (DFMD) model code FRACTRAN (Sudicky and McLaren, 1992). The model assumes flow and transport along parallel plate fractures as well as in the matrix, coupled with Fickian diffusion between the fractures and matrix (matrix diffusion). The model describes degradation of solutes as a first order
Table 1
Flow rates and solute concentrations applied to the columns Experimental day no.
Flow ratea (mm day1)
Nitrate influent concentration (mg l1)
Pesticide pulseb concentration (mg l1) Column 1 (three different flow rates, 0.012.5 24.5 70 –
two of them repeated once) 12.5 – 28.6 11.9 70 28.6 – 39.6 4.89 70 39.6 – 48.7 24.9 70 48.7 – 58.5 4.83 70
Column 2 (constant flow with flow 0.0 – 14.9 24,5 70 – interruptions) 14.9 – 25.0 0 (for 10 days) –
25.0 – 34.6 24,5 70 34.6 – 59.8 0 (for 24 days) – 59.8 – 74.0 24,5 70 74.0 – 119.2 0 (for 45 days) – 119.2 – 130.3 24,5 70 130.3 – 158.4 0 (for 28 days) – 158.4 – 182.8 24,5 70
Column 3 (three different flow rates) 0.0 – 0.38 54.2 85 – 0.38 – 2.64 11.9 85
2.64 – 4.58 2.94 85
Column 4 (three different flow rates) 0.0 – 5.12 3.06 58 – 5.12 – 6.25 15.3 57
6.25 – 6.97 21.4 55
Column 4 (application of pesticide – 12.3 44 Bentazon: 153
pulse as organic carbon source) MCPA: 84
MCPP: 185 Fenoprop: 78 Propoinol: 30 aFlow rate averageFmax. 0.5 mm day1.
b
reaction. The governing flow and transport equations for the model is given bySudicky and McLaren (1992).
2.3.2. Model calibration and estimation of nitrate reduction
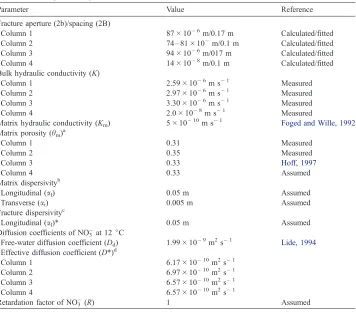
Calibration of FRACTRAN to describe the dilution of the tracers by physical processes (matrix diffusion and dispersion processes) was carried out on the basis of observed flow and bromide (non-reactive tracer) transport for each of the large undisturbed columns (Jørgensen et al., 2004) Table 3. It was shown that the calibrated model could reasonably reproduce the bromide transport data observed from the experiments under the variable flow rates and different flow sequences applied to each column. Because nitrate and bromide has similar physical properties any loss of nitrate greater than the calibrated model would account for (physical processes) was attributed to chemical reduction of nitrate. Consequently, the portion of nitrate attenuation specifically caused by chemically/ microbial reduction could be isolated and estimated by varying the degradation rate parameter in the calibrated model until the simulations would fit the nitrate transport data. This allows for comparison of nitrate reduction between the columns despite of the different flow sequences that were carried out for each column(Table 1).
3. Results and discussion
3.1. Nitrate fluxes
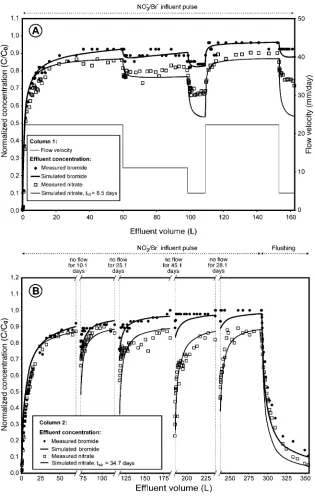
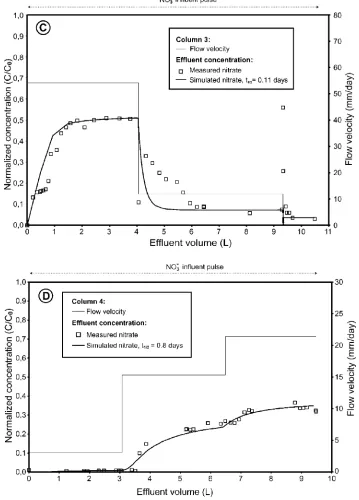
Fig. 4A – D shows normalized effluent breakthrough of nitrate from the forest and agricultural columns (seeTable 1for applied solute concentrations and flow rates).
In the experiment with an incremental series of different flow rates (Fig. 4A) the difference between normalized concentrations of nitrate and bromide in the effluent is seen to be greater for low than for high flow rates despite constant influent concentrations of the solutes. This is due to increased diffusion of the nitrate into the matrix and more time for reduction at low flow rate.
[image:8.468.53.415.96.206.2]The same result is seen from the experiments with flow interruptions of different length (Fig. 4B), where much lower concentration appears for nitrate relative to bromide after long flow interruptions than after short interruption. Furthermore, while the bromide
Table 2
Measured solute parameters and applied analytical methods
Parameter Method of analysis Reference
NO3 Cadmium reduction (columns 1, 2 and 4) Ion selective electrode (column 4)
HACH, 1989
O2 Modified Winkler Eaton et al., 1995
Mntotal Atomic absorption spectrometric
Fe2 + Modified phenanthroline Marczenko, 1986
pH pH-meter
DOC Non-perchable organic carbon Wu et al., 1990
TOC Combustion
concentration in the effluent solution gradually builds up to the same level as the influent bromide concentration (due to saturation of the column matrix with bromide), the nitrate flattens out at a lower, however constant, concentration when flow was restarted after each flow interruption. This indicates that nitrate is removed from the mobile pore water at constant rate by chemical or microbial reaction.
When application of the two tracers was stopped during continued flow, an initial rapid drop in concentrations appeared for both traces due to flushing of the compounds from the macropores. Hereafter the nitrate concentration was declining more rapidly than the bromide concentration. This is in agreement with that less accumulation has occurred in the matrix for nitrate than for bromide, because nitrate has been removed by reduction.
[image:9.468.60.416.95.407.2]Fig. 4C and D shows normalized effluent nitrate concentrations observed during continuous infiltration of the nitrate into the two columns from the agricultural site during
Table 3
Soil and solute input model parameters used for FRACTRAN simulations
Parameter Value Reference
Fracture aperture (2b)/spacing (2B)
Column 1 87106m/0.17 m Calculated/fitted
Column 2 74 – 8110m/0.1 m Calculated/fitted
Column 3 94106m/017 m Calculated/fitted
Column 4 14108m/0.1 m Calculated/fitted
Bulk hydraulic conductivity (K)
Column 1 2.59106m s1 Measured
Column 2 2.97106m s1 Measured
Column 3 3.30106m s1 Measured
Column 4 2.0108m s1 Measured
Matrix hydraulic conductivity (Km) 51010m s1 Foged and Wille, 1992 Matrix porosity (hm)a
Column 1 0.31 Measured
Column 2 0.35 Measured
Column 3 0.33 Hoff, 1997
Column 4 0.33 Assumed
Matrix dispersivityb
Longitudinal (al) 0.05 m Assumed
Transverse (at) 0.005 m Assumed
Fracture dispersivityc
Longitudinal (al)* 0.05 m Assumed
Diffusion coefficients of NO3 at 12jC
Free-water diffusion coefficient (Dd) 1.9910 9
m2s1 Lide, 1994
Effective diffusion coefficient (D*)d
Column 1 6.171010m2s1
Column 2 6.971010m2s1
Column 3 6.571010m2s1
Column 4 6.571010m2s1
Retardation factor of NO3(R) 1 Assumed
a
Matrix porosity and measured total porosity are assumed equal values. ba
lis estimated to be 0.1 of the column length andatto be 0.1 ofal(Fetter, 1993). ca
l* is assumed equal toal. dD*=D
a series of different flow rates (bromide transport data form these columns was obtained from separate experiments presented byJørgensen et al. (2004), in which study they are refereed to as columns 1 and 2).
From the data inFig. 4 it immediately appears that the nitrate reduction rates in the agricultural columns are significantly higher than in the forest columns. The transport data show that at the low flow rate for both columns the nitrate breakthrough concentrations stabilizes at very low levels, indicating that almost complete reduction of the influent nitrate is occurring during passage through the columns. Increasing the flow rate resulted in increasing effluent concentrations, which flattened out during maintained flow. This indicates that a new level of equilibrium between nitrate infiltration and reduction was reached at each new flow rate applied. Decreasing the column temperature from 12 to 8jC in order to test the influence of soil temperature on the nitrate reduction and resulting flux increased the nitrate flux by 40 – 50% (not shown).
3.2. Nitrate reduction and pore water reactions
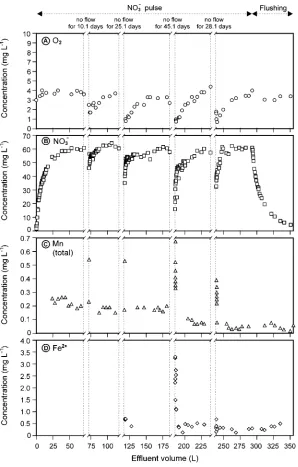
Fig. 5shows the effluent concentrations of O2, Mn(tot.) and Fe2 +from the deep forest
column measured simultaneously with the effluent NO3. The figure reveals that the low
nitrate concentrations, which develops during each flow interruption, are accompanied by decreased concentrations (0.5 – 1.5 mg/l) of oxygen and increased concentrations of Mn(tot.) and Fe2 +. These observations suggest that successive reductive consumption of O2,NO3in pore water and Mn and Fe in minerals (electron acceptors) was occurring as
result of microbial degradation of organic matter (electron donor) as described by Jørgensen and Fredericia (1992). Since near 99% of flow was conducted by the macro-pores in the column, these observations suggest that the nitrate reduction and Fe/Mn reduction was occurring in the matrix along the macropores. According to the metabolic energy yielded from bacterial reduction of O2, NO3, Mn4+and Fe3+, these compounds
would be consumed in order from O2to Fe3+, (e.g.Kormo, 1992). InsteadFig. 5indicates
that the individual reactions were occurring simultaneously in the pore-water. A likely explanation for this is that the effluent solution from the column integrates a large number of reactive microsites, which are different with respect to water flux, type and amount of organic matter, and redox potential. Eventually the measurements reveals that the concentration of both Mn(tot.) and Fe2 + in the effluent decreases gradually along the series of flow interruptions. This is consistent with progressing depletion of Mn/Fe minerals resulting in the bleaching observed along the fractures and biopores (seeFig. 2).
3.3. Organic carbon and bacteria
The role of bacteria and denitrification for the observed nitrate reduction was further evaluated from measurements of ATP (adenosine-tri-phosphate), N2O
(interme-diate product of denitrification from NO3 to N) and DOC taken from the effluent of
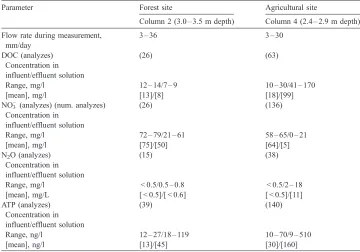
the deep columns from both study sites (Table 4). The measurements show that the slowest reduction of nitrate (found in the forest columns) was associated with corresponding low ATP and N2O concentrations (low microbial activity) and low
high rate of nitrate reduction was accompanied by approximately 3 – 20 times higher concentrations of ATP and N2O, respectively, and higher concentrations of DOC than
[image:13.468.89.387.69.536.2]for the forest site (Table 4).
The column effluent measurements are in agreement with vertical profiles of the soil samples obtained from the two field sites(Fig. 6A – C). The profiles reveals two to three orders of magnitude higher concentration of nitrate reducing bacteria (6A), and 2 – 10 times higher concentrations of water-soluble organic carbon (6B) at the agricultural site than at the forest site. This is in agreement with Vinther et al. (1999) who found that the numbers of denitrifying bacteria and nitrate reducing bacteria were very low ( < 104 cells g1 soil) in the same forest soil as studied in this investigation as compared to the 105– 106 cells g1 soil which is generally found in agricultural soils. Further, Vinther et al. (1999)found that the numbers of denitrifying bacteria and the content of ATP were significantly higher along macropore channels than in the matrix soil, and that the low concentration of DOC in the forest soil was a limiting factor for the denitrification. This is in accordance with Burford and Bremner (1976) who found a linear relationship between denitrification capacity, defined as the evolution of gaseous nitrogen over 7 days from samples amended with nitrate, and soil content of water-soluble carbon.
[image:14.468.51.411.97.349.2]The total organic carbon (6C) content is near identical at the two sites, and hence, this parameter was not useful as an indicator for the greatly enhanced denitrification potential at the agricultural site. The laboratory and field data (Table 4 and Fig. 6) consistently supports that nitrate is microbiologically reduced by denitrification and that the higher nitrate reduction rates in columns from the agricultural site is caused by the higher concentration of water-soluble carbon at this site.
Table 4
Comparison of N, organic, and microbial parameters observed from deep agricultural and forest site columns
Parameter Forest site Agricultural site
Column 2 (3.0 – 3.5 m depth) Column 4 (2.4 – 2.9 m depth)
Flow rate during measurement, 3 – 36 3 – 30
mm/day
DOC (analyzes) (26) (63)
Concentration in influent/effluent solution
Range, mg/l 12 – 14/7 – 9 10 – 30/41 – 170
[mean], mg/l [13]/[8] [18]/[99]
NO3 (analyzes) (num. analyzes) (26) (136)
Concentration in influent/effluent solution
Range, mg/l 72 – 79/21 – 61 58 – 65/0 – 21
[mean], mg/l [75]/[50] [64]/[5]
N2O (analyzes) (15) (38)
Concentration in influent/effluent solution
Range, mg/l < 0.5/0.5 – 0.8 < 0.5/2 – 18
[mean], mg/L [ < 0.5]/[ < 0.6] [ < 0.5]/[11]
ATP (analyzes) (39) (140)
Concentration in influent/effluent solution
Range, ng/l 12 – 27/18 – 119 10 – 70/9 – 510
Fig. 6. Vertical profiles from the forest and agricultural study sites of (A) most probable number (MPN) of nitrate reducing bacteria; (B) water-soluble organic carbon; and (C) total organic carbon (TOC).
Jør
gensen
et
al.
/
Journal
of
Contamin
ant
Hydr
ology
73
(2004)
207–226
Interview with the farmer of the agricultural site indicated that the soil had not been treated with manure, which suggests that the increased concentration of water-soluble organic carbon most likely was the result of decaying root remains after repeated seasonal removal of the crops from the land. The very low hydraulic conductivity with depth at the agricultural (correlating with low values of soil vane shear, seeJørgensen et al., 2004) site may have favored accumulation of water-soluble organic carbon in the profile as result of slow leaching and prolonged periods of water-saturated conditions. This emphasizes the potential importance of land use, and soil mechanical and hydraulic properties to the type and reactivity of organic matter available as electron donors.
3.4. Loss and regain of reduction capacity
During maintained flow with the agricultural columns the initial high concentration of dissolved organic carbon leached from these columns were to a great extent depleted after percolation of approximately 180 l influent solution. Simultaneously with the DOC depletion, the denitrification potential ceased. In contrast with this observation, both DOC and denitrification rate for the forest columns were low and stable throughout percolation of approximately the same amount of water.
[image:16.468.85.382.424.583.2]In order further to investigate the relation between organic carbon and the nitrate reduction, the organically depleted deep column from the agricultural site was infiltrated with a pulse of pesticides(Table 1)in addition to nitrate to represent a renewed source of dissolved organic matter.Fig. 7shows that after the pesticides were infiltrated, the nitrate in the column effluent disappeared almost immediately, showing that the denitrification potential was effectively renewed. This emphasizes the role of easily water extractable or dissolved organic carbon in the soil, however, quick loss and renewal of denitrification potential also suggest that the denitrification potential in agricultural sub-soil may vary in time and space depending on the short-term history of land use.
3.5. Modeling of nitrate reduction rates
Using the calibrated FRACTRAN model the observed nitrate effluent concentration from the experiments were simulated by varying the degradation rate parameter as the only model variable to fit the effluent nitrate concentrations observed from each column at the various flow rates(Fig. 4). The resulting estimates of nitrate reduction rate constants and corresponding half-lives derived from this procedure are shown inTable 5.
The estimations show that at both sites the rate of denitrification is high down to at least 4 m depth; half-lives increase with depth from 7 to 35 days at the forest site and from 1 to 7 h at the agricultural site. Hence, the rate is two orders of magnitude higher at the agricultural site than at the forest site, which points to the positive correlation between the very high denitrification rates and the elevated concentrations of water soluble organic carbon from the agricultural site (Fig. 6B). From the overall good agreement between the observed and simulated concentrations the evaluation show that the calibrated FRACTRAN model provides a reasonable approximation to the highly variable nitrate fluxes observed during different flow rates with the columns. The reduction rates applied to fit the data were unique and consistent for each column. The ability of the model to reproduce the flow and nitrate data shows that the nitrate reduction in the columns largely followed the first order reduction rate described by the model.
4. Implications to groundwater risks
In order to evaluate the nitrate transport rates obtained from the experiments closer to field conditions FRACTRAN simulations were carried out for the lower boundary of a hypothetical 5 m thick water-saturated clay layer. The simulations used the soil and fracture parameters together with the nitrate reduction rate determined from the deep column from the forest site (Table 5). Hence, the simulations were using the slowest reduction rate (t1/2= 34 days) estimated for the two study sites. The simulations revealed
that at steady state vertical flow of 4 mm/day (approximately two times the average infiltration rate during winter in the study area), the nitrate from the lower boundary of the clay layer did not exceed 1 mg/l in response to an upper boundary nitrate concentration of 80 mg/l (representing the mean root zone concentration in agricultural soils and locally in forest soils;Gundersen and Bashkin, 1993).
[image:17.468.56.418.98.150.2]The groundwater recharge in Denmark, however, is significantly influenced by rainstorm events with common infiltration rates of 5 – 30 mm/day (GEUS, 2002).
Table 5
Nitrate reduction rates for the columns estimated by DFMD modeling
Denitrification Forest site Agricultural site Column 1
(1.5 – 2.0 m depth)
Column 2 (3.0 – 3.5 m depth)
Column 3 (1.7 – 2.2 m depth)
Column 4 (2.4 – 2.9 m depth)
Simulation of a 2 day storm of 30 mm/day following a 120 days period with continuous infiltration of 80 mg nitrate/l at 4 mm/day, produced an increase of the nitrate concen-trations from the lower boundary of the clay layer from 1 mg/l to a maximum of 3 mg/ l during a period of 10 days after the rainstorm. Additional simulations for the same flow conditions indicated that the reduction of nitrate determined from the LUC’s would reduce mean root zone nitrate concentrations of 80 mg/l below the EU drinking water standard (5 mg/l) during passage of 2 .5 – 5 m clay and less 1 m clay, respectively, for the forest and agricultural land use. As mentioned previously approximately 40 – 50% higher nitrate fluxes were monitored for the columns at temperatures (8 – 10jC) corresponding to the seasonal temperature minimum in sub-soil oxidized clayey till in Denmark. However, despite this reduction in denitrification rate the model simulations suggest that during downward water movement at water saturated conditions in the soil, average agricultural root zone concentrations of nitrate would be significantly reduced during passage through the top 3 – 10 m oxidized zone of the clayey tills.
In the columns of the current investigation preferential flow paths were represented by a high density of fractures and biopores with apertures, which compares well with apertures reported from other Danish clayey till sites (e.g.Jørgensen et al., 1998c; Sidle et al., 1998). However, even higher flow rates (>1 km/day) have been reported to occur along deep root channels in clayey till byJørgensen et al. (2002). Where such channels combine with thick oxidized channel rims, this may cause higher fluxes of nitrate from tills into groundwater than indicated from the columns and simulations of the current study.
5. Summary and conclusions
This study has investigated the role of macropores (fractures and biopores) to downward transport and reduction of nitrate in water saturated clayey till from a forest and an agricultural study site. It was found that very high denitrification and transport rates were occurring along the macropores, which represented 96 – 99% of total water flow in the soil. Nitrate reduction largely followed first order reactions with estimated half-lives (t1/2)
increasing with depth (1.5 – 3.5 m) from 7 to 35 days at the forest site and 1 – 7 h at the agricultural site. It was indicated from reductive dissolution of Fe and Mn minerals simultaneously with the removal of nitrate, that nitrate reduction was associated with reactions in microsites observed as bleached features along macropore flow paths.
It was found that the greatly elevated nitrate reduction rates observed for the agricultural site correlated with significantly higher concentrations of water-soluble organic carbon, higher number of nitrate removing bacteria together with indicators (ATP and N2O) of elevated bacterial activity for the agricultural site, relative to the forest
agricultural land use. The results suggest that water-soluble organic carbon in the soil may be a relevant indicator for potential denitrification capacity and rate.
It was found that the discrete fracture matrix diffusion (DFMD) model FRACTRAN could reasonable reproduce the observed nitrate fluxes from the columns observed during different flow rates. Using the nitrate reduction rates obtained from the columns it was found that during downward saturated water movement occurring mainly in winter, average agricultural root zone concentrations of nitrate (80 mg/l) would be removed or significantly reduced during passage through the top 3 – 10 m oxidized zone of the clayey tills under forest and agricultural land use.
Acknowledgements
This investigation was funded by the Danish Strategic Environmental Reseach Programme (SMP) 1992 – 1996. We would like to thank reviewer Dr. Will P. Gates, and an anonymous reviewer for their comments and suggestions, which have greatly helped to improve the manuscript.
References
Berner, R.A., 1980. Early Diagenesis. University Press, Princeton.
Blume, H.P., 1988. The fate of iron during soil formation in humid temperate environments. In: Stucki, J.W., et al. (Eds.), Iron in Soils and Clay Minerals. NATO ASI Series. Series C: Mathematical and Physical Sciences, vol. 217. Reidel, Dordrecht, The Netherlands, pp. 749 – 777.
Bru¨mmer, G., 1974. Redoxpotentiale und redoxprozess von mangan-, eisen-und schwefel verbindungen in Hydromorphen Boden und sedimenten. Geoderma 12, 207 – 222.
Burford, J.R., Bremner, J.M., 1976. Relationships between the denitrification capacities of soils and total, water-soluble and readily decomposable soil organic matter. Soil Biol. Biochem. 7, 389 – 394.
Canadell, J., Jackson, R.B., Ehleringer, J.R., Mooney, H.A., Sala, O.E., Schulze, E.D., 1996. Maximum rooting depth of vegetation types at the global scale. Oecologia (108), 581 – 595.
Eaton, A.D., Clesceri, L.S., Greenberg, A.E., Franson, H.A.H. (Eds.), 1995. Standard Methods for Examination of Water and Wastewater, 19th ed. American Healt Association, Washington, DC.
Eiland, F., 1985. Determination of adenosine triphosphate (ATP) and adenylate energy charge (AEC) in soil and use of adenine nucleotides as measures of soil microbial biomass and activity. Tidsskr. Planteavls Specialserie. Foulum, Denmark, pp. 1 – 193.
Ernstsen, V., Gates, W.P., Stucki, J.W., 1998a. Microbial reduction of structural iron in clays. A renewable source of reduction capacity. J. Environ. Qual. (27), 761 – 766.
Ernstsen, V., Binnerup, S.J., Sørensen, J., 1998b. Reduction of nitrate in clayey till controlled by geochemical and microbial barrieres. Geomicrobiology (15), 195 – 207.
Fetter, C.W., 1993. Contaminant Hydrogeology. Macmillan College Publishing, New York. 458 pp.
Foged, N., Wille, E., 1992. Forureningsbetingede ændringer af hydraulisk ledningsevne i lerede aflejringer: laboratorieforsøg (in Danish). Geoteknisk Institut. Lossepladsprojektet. Rapport P7-2. 48 pp.
Fujicawa, J.I., Hendry, M.J., 1991. Denitrification in clayey till. J. Hydrol. 127, 337 – 348.
GEUS, 2002. Early Warning Monitoring System for Leaching of Pesticide. GEUS, Copenhagen, Denmark (preliminary report).
Gravesen, P., 1996. Buried valley fill aquifers in eastern and northern Jutland, Denmark. NHP-Report No. 40, Nordic Hydrological Conference, Akureyri, Iceland, vol. 2, pp. 658-667.
HACH, 1989. Water Analysis Handbook, p. 691.
Hoff, A., 1997. Radon transport in fractured soil: Laboratory experiments and modeling. PhD thesis Risø. National Laboratory, Roskilde, Denmark, 126 pp.
Jensen, M.B., Hansen, H.C.B., Jørgensen, P.R., Magid, J., 1999. Leaching of phosphate in structured soil—a two step process. Nord. Hydrol. 30, 361 – 378.
Jørgensen, P.R., 1995. Flow and contaminant transport in fractured clayey till. PhD thesis, University of Copen-hagen, Denmark.
Jørgensen, P.R., Fredericia, J., 1992. Migration of nutrients, pesticides and heavy metals in fractured clayey till. Geotechnique 42 (March), 67 – 77.
Jørgensen, P.R., McKay, L.D., Spliid, N.H., 1998a. Evaluation of chloride and pesticide transport in a fractured clayey till using large undisturbed columns and numerical modeling. Water Resour. Res. (34), 539 – 553. Jørgensen, P.R., Broholm, K., Sonnenborg, T.O., Arvin, E., 1998b. DNAPL transport through macroporous,
clayey till columns. Ground Water 36 (4), 651 – 660.
Jørgensen, P.R., Baumann, J., Helstrup, T., Urupog, J., Butzbach, K., 1998c. Hydraulik i sprækket, ler (in Danish). Geol. Nyt 2, 13 – 16.
Jørgensen, P.R., Hoffmann, M., Kistrup, J.P., Bryde, C., Bossi, R., Villholth, K., 2002. Field, laboratory and modeling analysis of preferential flow and pesticide transport in a clay-rich till. Water Resour. Res. 38 (11), 1246.
Jørgensen, P.R., Helstrup, T., Urup, J., Seifert, D., 2004. Modeling of non-reactive solute transport in fractured clayey till during variable flow rate and time. J. Contam. Hydrol. 68 (3 – 4), 193 – 216.
Klute, A., 1986. Methods of Soil Analysis. Part 1: Physical and Chemical Methods American Society of Agronomy, Madison, WI.
Kormo, S.F., 1992. Natural denitrification in saturated zone: a review. Water Resour. Res. 1657 – 1668. Korom, S.F., 1992. Natural denitrification in the saturated zone: a review. Water Resour. Res. 28, 1657 – 1668. Lide, D.K., 1994. Handbook of Chemistry and Physics 1913 – 1995, 75th ed. CRC Press.
Lind, A.-M., Eiland, F., 1989. Microbiological characterization and nitrate reduction in subsurface soils. Biol. Fertil. Soils 8, 197 – 203.
Madsen, H.B., 1983. Himmerlands Jordbundsforhold. Et regionalt Studie Omhandlende Jordbundsudvikling,-klassifikation, Afgrøders Rodudvikling og Jordens Plantetilgængelige Vandmængder Danish Ministry of Agriculture, Office of Landuse, Vejle, Denmark.
Marczenko, Z., 1986. Separation and spectrophotometric determination of elements. Horwood, Chichester, p. 678.
Sidle, R.C., Nilson, M., Hansen, M., Fredericia, J., 1998. Spatially varying hydraulic and solute transport characteristics of a fractured clayey till determined by field tracer tests, Funen, Denmark Water Res. Resour. 34, 2515 – 2527.
Sudicky, E.A., McLaren, R.G., 1992. The Laplace transform Galerkin technique for large-scale simulation of mass transport in discretely fractured porous formations. Water Resour. Res. 28, 499 – 514.
Vinther, F.P., Eiland, F., Lind, A.-M., Elsgaard, L., 1999. Microbial biomass and denitrification related to macro-pores in agricultural and forest soils. Soil Biol. Biochem. 31, 603 – 611.