City, University of London Institutional Repository
Citation
:
Hoare, Z. & Hoe, J. (2013). Understanding quantitative research: part 2. Nursing Standard, 27(18), pp. 48-55. doi: 10.7748/ns2013.01.27.18.48.c9488This is the accepted version of the paper.
This version of the publication may differ from the final published
version.
Permanent repository link: http://openaccess.city.ac.uk/16530/
Link to published version
:
http://dx.doi.org/10.7748/ns2013.01.27.18.48.c9488Copyright and reuse:
City Research Online aims to make research
outputs of City, University of London available to a wider audience.
Copyright and Moral Rights remain with the author(s) and/or copyright
holders. URLs from City Research Online may be freely distributed and
linked to.
Understanding quantitative research: part 2
Authors Zoë Hoare
Clinical trials statistician, Bangor University, Bangor.
Juanita Hoe
Senior clinical research associate, Research Department of Mental Health Sciences, University College London, London.
Correspondence to: [email protected]
Keywords
Data interpretation, parametric statistical tests, quantitative research, statistics
Abstract
This article, which is the second in a two-part series provides an introduction to understanding quantitative research, basic statistics and terminology used in research articles. Critical appraisal of research articles is essential to ensure that nurses remain up-to-date with evidenced-based practice to provide consistent and high quality nursing care. Understanding statistical analysis will ensure that nurses can assess the accuracy and strength of the evidence reported. This article focuses on explaining common statistical terms and the presentation of statistical data in quantitative research.
Aims and intended learning outcomes
This article aims to provide a useful introduction for nurses who are attempting to read and review quantitative research articles. The broad nature of statistics means it is not possible to cover all aspects of statistical analysis in detail, but the article can help nurses gain a better understanding of common statistical terms and the presentation of statistics. After reading this article and completing the time out activities you should be able to:
Acknowledge the importance of assessing the appropriateness of the statistical tests performed and accurate interpretation of the findings
Recognise and identify the common statistical tests used in quantitative research.
Begin to look for errors in the reporting of statistical analysis, such as selective reporting and overestimating the strength of findings.
Introduction
Statistics are the methods and techniques used to collect, analyse, interpret and present data (Maltby et al. 2007). We are all exposed to statistics on a daily basis as the use of statistics is commonplace within the media, being used within political, health, financial or sports reports. Nurses also routinely use statistics within their practice, such as when they give health information to patients about their diagnosis or prognosis and in discussing the adverse effects of medication or treatment. However, many nurses may find understanding the presentation of statistical data within a research paper daunting. Fear of statistics is not uncommon and is due to anxiety about understanding and interpretating the statistical data and outcomes (Cruise et al., 1985; Williams 2010). In health research, statistics may be used to determine the prevalence and incidence of illness, or to establish if a new treatment is effective. Presenting the results from the statistical analysis of the data collected is a key part to establishing the evidence from the research undertaken. The results of studies must be examined carefully to ensure that the data collected are presented and interpreted accura tely. It is also important to observe whether the results are misleading, in that there is evidence of selective reporting, or the strength of the findings is overestimated. It is important to note that statistically significant findings do not always indicate clinically significant findings (McCluskey & Lalkhen, 2007). Strong research evidence will however support the implementation of evidence-based interventions in practice. Whereas, weak evidence may indicate a need for further research. A knowledge of basic statistics is therefore essential and will help nurses to understand and assess the credibility of the evidence presented.
Interpreting the data Descriptive data
Descriptive data, also known as summary statistics, is information provided about the sample population. This data usually includes the sample size and demographic characteristics, which are either described by frequencies (the number of observations) for categorical variables, such as gender and ethnicity; or by the mean (average) number and standard deviation (measure of variance) for continuous variables, such as age or years of education. Ranges that show the lowest and highest measures within that sample should also be provided, for example the range for age will show the youngest and oldest ages within the sample. Where there are two sample groups, such as the treatment and control group, it is important to look for similarities between the two groups to ensure the samples are comparable. If the mea n scores and the range of the measures obtained vary significantly between the two groups, the samples may not be considered comparable and this would introduce bias (prejudice) into the results of the trial.
United States cannot be generalised to the UK population. Although similarities may exist between the two populations, cultural differences exist. Therefore, the study would need to be replicated in the UK to see if similar results are recorded in this population.
Table 1 Common statistical terms
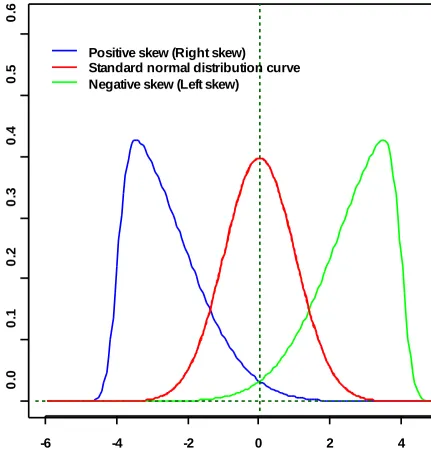
Mean To calculate the mean (average) score take all the values, add them up and divide the total by the number of values. The mean score is often thought of as the middle of a distribution, however this is only true when the distribution takes certain shapes (Figure 1).
Median This is truly the middle value of the distribution of values. To calculate the median, line all the values up smallest to largest. For an odd number of values the median becomes the middle value. For an even number of items the median becomes the mean of the two central values.
Probability The probability is the number of times an event occurred divided by the total number of times the event was attempted. A probability value will always be between 0 and 1. Zero means that the event never occurs and 1 means that the event always occurs. This is reported as the p value.
p value This is a commonly reported statistic resulting from numerous statistical tests. It can be thought of as the probability of getting this data or result by chance. Therefore, the smaller the p value the more likely the hypothesis being tested is true.
Significance level
This is the level that the p value is taken to be ‘significant’. This is usually taken to be 5% (p=0.05), but other values can be used. This level of significance is decided upon before starting any of the statistical tests.
Standard deviation
The standard deviation gives an idea of the variability of a sample. The larger the standard deviation the more indication there is that the sample is spread out around the mean.
Odds ratio Odds are the probability of an event occurring divided by the probability of that event not occurring. An odds ratio is the comparison of odds for two binary (has two categories) outcomes describing their association.
where a value of 0 indicates no correlation, a value of -1 indicates that as one value rises the other decreases and a value of +1 indicates that as one increases the other also increases.
Time out 1
Access a quantitative research article with figures and tables used to represent data from a randomised controlled trial. Read the article and examine the descriptive data presented for the intervention and control sample populations. Look for similarities within the sample groups, for example:
Are the proportion of males and females in the two groups the same?
Are the two sample groups of similar age and range of ages?
Do the two sample groups have similar mean scores for the measures used, eg. mood, dependency or quality of life?
Are there any major differences in mean scores between the two groups, indicating that the sample populations used are not matched?
Presenting the data
When looking at data tables it is worth considering how the variables have been collected. This is because gender and age are not subjective measures, but other recorded outcome measures may be, such as participants’ mood or behaviour, which may change over time. For example, the Beck Depression Inventory (Beck et al 1961) measures the severity of depression in a person. This is a subjective measurement and has the ability to vary within one individual over time. Natural variation day to day will cause these types of measures to vary, however if the measure is validated correctly then the stability of the measure should have been assessed, through thorough examination of content, comparisions and factor analysis, and it will be considered a reliable measure. Assessing the validity of a measure is ensuring that it measures what it says it measures.
The Beck Depression Inventory is a valid and reliable measure of depression and is widely used across different population groups. Alternatively, for the Body Mass Index (BMI) (Keys et al 1972) within a population, one would expect a few very low BMI scores and a few very high BMI scores, but most would be centred around the mean score. The mean score can be affected by the extreme values (outliers) pulling it higher or lower than expected. For example, mean income can be affected by a few highly paid workers when the majority are actually on a much lower wage. For this reason, social scientists tend to use the median (middle) income.
distributions depicted are skewed distributions (not equally distributed about the mean) where the mean of the distribution is not necessarily the middle, actually the means are ±4 in this case. The blue line being a positive right skew where more cases are to the left of the distribution. It is right skewed as the tail extends out further to the right than expected. The green line is a negative left skew with more cases to the right of the distribution and a longer tail out to the left of the distribution. Parametric statisticial tests typically assume that the distribution of values takes the same shape as the red distribution in Figure 1 and care should be taken when interpreting the results of the research if another shape is apparent. If the distribution of the data does not follow that of the standard normal then applying the commonly used parametric tests could cause the incorrect inferences to be drawn from the data.
Figure 1 Distribution curves
-6 -4 -2 0 2 4 6
0
.0
0
.1
0
.2
0
.3
0
.4
0
.5
0
.6
Positive skew (Right skew)
Time out 2
Access a quantitative research article that describes the measures used for the research study (this can be a cross-sectional survey, cohort study or randomised controlled trial). Does the paper state the validity and reliability of the measures and how valid they are to use with this study’s population group?
If the measure was originally designed in the US, is there evidence of further research to show the reliability and validity of using the measure with a UK population?
Hypothesis testing and statistical significance
A statistical hypothesis is an assumption about a population parameter (value), which the study will test. This assumption may or may not be true. The null hypothesis assumes that changes to the sample result purely from chance and that there is no difference between the two test scores or there is no difference from zero. The alternate hypothesis assumes that changes are influenced by some non-random cause. The alternate hypothesis states there is a difference if the test is two-sided (the direction of change is not specified and can go either way) or the test is one-sided, where there is a difference in a particular direction, for example the change in one group sample is greater than the other group sample. For example, from Table 1, a one sample t-test compares the mean scores of a parameter (value) of the sample to a hypothesised parameter (estimated value). The null hypothesis for the one sample t-test would be the mean birth weight of babies born on their due date is 3.4kg. The alternate hypothesis would be that the mean birth weight of babies born on their due date is not 3.4kg (for a two-sided test) or the mean birth weight of babies born on their due date is greater than 3.4kg (for a one-sided test).
Statistical tests usually result in a statement of the p value (probability) to show the significance of the results. The p value is the probability that the difference seen between the scores would have happened by chance, therefore the lower the p value is, the more likely that there is a real difference between the scores. It is generally accepted that whatever outcome was being tested, it is statistically significant if the p value is below 0.05.
effect of small changes on the variable measured or are stating their confidence in the results found.
Table 1 Common parametric statistical tests
Statistical test Purpose of test Example of test use
One sample t-test
Compares the mean scores of a parameter (value) of the sample to a hypothesised parameter
(estimated value).
An example of a hypothesis to test would be: is the birth weight of babies born on their due date equal to 3.4kg?
Paired t-test Compares two population means and tests that there is no difference between the two sets of
observations. This can be done in two ways either assessing the change within an individual or by matching individuals for
comparison.
To compare weight before and after a diet.
Two sample t-test
Compares two sample means from the same population.
To compare pulse rate after two types of exercise.
ANOVA (analysis of variance)
Tests whether or not the means of two or more sample groups are all equal. ANOVA is a generalisation of the t-test to allow comparison where two or more observations are made.
To compare pulse rate after two or more types of exercise.
ANCOVA (analysis of covariance)
As above, but allowing co-variates to be included in the model
To comparing pulse rate after two or more types of exercise, but allowing for age or gender.
Correlation coefficient
Measures the strength of
association between two variables. Pearsons, Spearman and Kendall correlations are the most
commonly used.
To assess the
relationship between quality of life and cognition scores
Regression A mathematical formula is found to describe the relationship between two variables allowing prediction of one from the other. Multiple
regression allows inclusion of more than one predictor and identifies the strongest relationship between variables.
Assessing the
relationship between two (or more)
variables, for example,
Time out 3
Access a quantitative research article with figures and tables used to represent data from a randomised controlled trial. Within the analysis section locate the level of significance that has been set. This may be set at p≤0.05, p≤0.01, or p≤0.001, to show statistically significant findings. Does the analysis use other statistical tests such as confidence intervals to show the significance of results? Now look within the tables or text for the results which show statistically significant findings. What are the conclusions drawn from these findings?
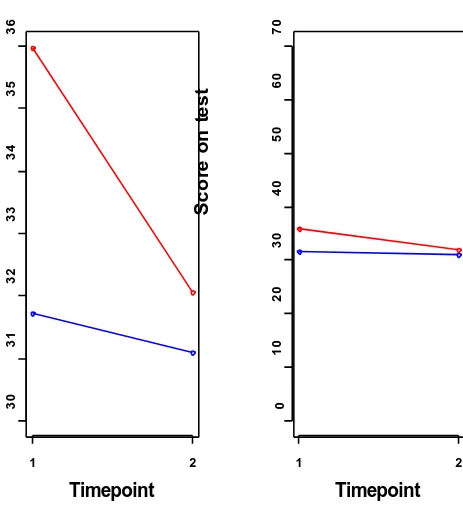
Graphs
Figure 2 Example graphs
30
31
32
33
34
35
36
Timepoint
Sc
o
re
o
n
t
e
s
t
1 2
0
10
20
30
40
50
60
70
Timepoint
Sc
o
re
o
n
t
e
s
t
1 2
Tables
same as the total number of the sample population, indicating some data is missing. Data summarised within the main text can be difficult to understand and may need reading more than once to fully comprehend what is being said.
Relational descriptions (the association between pre and post-trial measures) are potential areas where misunderstanding may occur. If the score on a scale goes up it can mean that the object of measurement is improving or deteriorating. It is therefore important to be familiar with the scales of measurement being used and their scoring, for example high scores on the Quality of Life in Dementia Scale (Logsdon et al 1999) indicate better quality of life, whereas high scores on the Mini-Mental State Examination (MMSE) (Folstein et al 1975) indicate poorer cognitive ability.
For reported data, there are a number of considerations to think about, particulary when the sample size is small, such as:
Does the range (dispersal of the highest and lowest scores) of the sample make sense? By making sense one is asking if it possible and reasonable to see these scores in the population being studied. Dementia is a disease associated with old age and a sample population aged either 60 or 65 years and above would usually be expected. It is not, however, uncommon for people to get dementia in their 40s or 50s. Therefore, in a study of people with dementia showing a lower end of the age range of 42 years, consideration should be given to whether the study has included just one or two participants with early onset dementia (possibly affecting the mean age) or whether the study specifically looked to recruit from a sample population of people with early onset dementia.
Are the numbers what one would expect to see for the sample used? For a dementia study recruiting those with mild to moderate dementia, one would not expect to see very low cognition scores indicating severe dementia. The (MMSE) (Folstein et al 1975) has cut-offpoint of 24-20 for mild dementia, 19-10 for moderate dementia and 9-0 for severe dementia. In a study recruiting people with mild to moderate dementia, a score range of between 24-10 points would therefore be expected.
Are the measures related to one another in the right way? In a dementia study, there may be more than one measure of cognition. A lower score on the MMSE indicates greater cognitive impairment while a higher score on another scale such as the Blessed Dementia Scale (Blessed et al 1968) indicates worse cognition, so one would not expect to see low scores on both of these measures.
Was there any missing data (look at n)? If there is then one should look specifically at the text to find out what has been done to handle the missing data or has the issue of missing values just been ignored. Is the mean sitting in the ‘middle’ of the range, if not, in which direction
might the data be skewed? If the data are skewed then it might not be sensible to use standard statistical tests.
indicates that the scores are close to the mean, whereas high standard deviation indicates that the scores are spread out over a larger range of values.
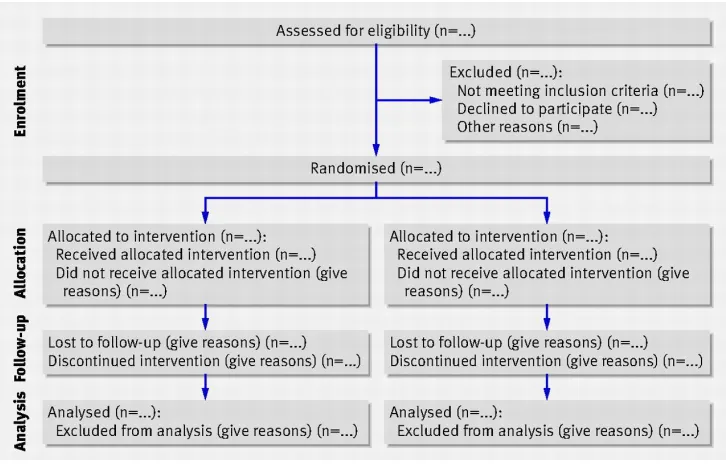
[image:13.596.92.455.334.566.2]The reporting of randomised controlled trials is guided by the CONSORT statement (Schulz 2010). This statement describes the principles and recommendations for reporting trial data and ensuring transparency of the steps taken to collect and collate data for the trial. Items of particular note within the statement are the CONSORT flowchart (CONSORT 2012) (Figure 3) and the checklist. The checklist covers two A4 pages and would not be easily reproduced here – it is easily found on the internet. The flowchart gives an indication of the flow of participants through the trial: from referral for recruitment to the study, through to the final follow-up assessments. The checklist shows all the items that should be reported throughout a trial to enable a full appraisal of the quality and robustness of a clinical trial.
Figure 3 Consort flowchart
(Schultz et al 2010)
Time Out 4
Access a quantitative research article with figures and tables used to represent data from a randomised controlled trial. Read the article and look at how the statistics are reported. How helpful are the figures and tables in explaining the results? Has the data analysed been presented according to the CONSORT flowchart?
Assessing bias
There are several types of bias that can have an effect on the outcome of a study (Table 2). Making sure the study is well planned and organised, r un appropriately and uses appropriate research methods will control for the majority of these types of bias, while the remainder should be controlled for in the way the analysis is conducted and reported.
Blinding a trial, if done successfully, can elimi nate many types of bias. People who are involved in a clinical trial include the participants, clinicians, researchers and the analyst. It may or may not be possible to blind the participants and clinicians. For example, in drug trials, placebo drugs are often offered so that the clinicans and participants are unaware of which drug has been prescribed to which participant. For psycho-social interventions it is often impossible to deliver the intervention blinded, as both the clinician and the participants are aware that they are delivering and receiving the intervention being trialled. Assessment interviews to collect outcome data may, however, be collected by blinded researchers.
There are often blind and unblind researchers in the clinical trial team. Unblind researchers are responsible for dealing with the managemant of data and are allowed to see which treatment group a participant has been allocated to, to arrange attendance at interventions sessions. The blind researcher would be responsible for collecting the research data and does not have any knowledge which group the participant is allocated too, for example the intervention or control group. The blinded researcher would therefore not be influenced b y any pre-conceived ideas that he or she holds about the intervention.
The analyst responsible for assessing the results of the data collected should remain blind for as long as possible. This is usually until at least the main part of the statisticial analysis has been completed. This means that there is no possible way any steps taken in the statistical analysis can have influenced the results.
Bias within the analysis of data is particularly evident with the handling of missing data; whether the study indicates what type of analysis the authors did and whether this takes into account any missing values. Missing data may be because of research participants (cases) not completing all the measures or dropping out of the trial. There is much literature available about issues to consider when faced with missing data (Le Fanu 2002, Wood et al 2004, Altman and Bland 2007). In brief, complete case analysis excludes cases with any missing data and only uses those cases that completed the trial, which can be biased if that data was not missing completely at random (the reasons for the absence of the data is unrelated to the outcome of the trial).
important to identify the reasons for the missing data, for example whether all women refused to answer a specific question. If this was the case, then any analysis that does not take this into account will be biased; simply adding gender in as a covariate may be enough to ensure this bias is accounted for.
Table 2 Common sources of bias
Type of bias How the bias
manifests
Explanation of how the bias is introduced
Selection bias Is the research biased by selection of the sample to be used?
Previous knowledge of the likely effects of the treatment intervention may cause a clinician to select or avoid the recruitment of particular participants. Within case control studies, this may be a selection of the particular cases to be included and reasons should be given for exclusion. For a randomised controlled trial (RCT), only certain subjects getting selected for certain treatment may be seen, however with rigorous allocation concealment (blinding) this selection bias can be reduced if not eliminated.
Ascertainment bias
Does knowledge of the group assignment by the person assessing the outcomes influence the assessments?
Recording of relevant measurements should be completed by someone who is unaware (blinded) of the treatment being received to reduce this type of bias. This can be mitigated to a certain extent by including a variable that indicates the level of perception a researcher has in relation to the treatment received, for example does the researcher think the participant was in the treatment or control group?
Performance bias
If the participant knows what treatment he or she is receiving, does this affect his or her
performance on the subject under research?
This is a complicated question and the perception of being on a trial is enough to improve some scores. If randomisation happens before the baseline
assessments are completed in an RCT, it is difficult to factor into any analysis whether the participant knowing what treatment he or she was going to recieive has affected how the individual
responded to the questionnaires. Publication
bias
Are studies that show significant results more likely to get published within better quality journals, that have higher impact factors?
Publishing non-significant results can be as important as publishing the significant results. Repeated analyses on the same data will more than likely find something significant eventually. Linking the
Time out 5
Access a quantitative research article with a detailed description of the methods and analysis used in the research.
Please read the research article and identify what possible bias or errors there may be within the study.
Conclusion
An understanding of basic statistics will help nurses to interpret the strength of findings within a research paper. Staying abreast of developments in hea lth research and using this knowledge to improve patient care can be both challenging and rewarding for nursing staff. Key to this is having a good understanding of the significance of the findings, which allows nurses to confidently assess the strength of the research evidence and whether its implementation in practice is supported. Statistics is a complex subject and is not always easy to comprehend, but it does become easier to understand with familiarity. The broad scope of this subject means it is not possible to incorporate all aspects of statistical analysis, but the article provides an overview of common statistical terms relevant to presenting statistical data within quantitative research papers. We strongly encourage nurses to build their knowledge of statistics and take advantage of opportunities to use this when appraising the evidence of research papers.
References
Altman DG, Bland MJ (2007) Statistics notes: missing data. British Medical Journal. 334, 7590, 424.
Beck AT, Ward CH, Mendelson M, Mock J, Erbaugh J (1961) An inventory for measuring depression. Archives General Psychiatry. 4, 561-571.
Blessed G, Tomlinson BE, Roth M (1968) The association between quantitative measures of dementia and of senile change in the cerebral grey matter of elderly subjects. British Journal of Psychiatry. 114, 512, 797-811.
CONSORT (2012) Consort: Transparent Reporting of Trials.
www.consort-statement.org (Last accessed: October 15 2012.)
Cruise JR, Cash RW, and Bolton LD (1985) Development and validation of an instrument to measure statistical anxiety. in Proceedings of the Section on Statistical Education, American Statistical Association, 92-98.
Greenhalgh T (1997) How to read a paper. Statistics for the non-statistician. I: different types of data need different statistical tests. British Medical Journal. 315, 7104, 364-366.
Keys A, Fidanza F, Karvonen MJ, Kimura N, Taylor HL (1972) Indices of relative weight and obesity. Jounal of Chronic Diseases. 25, 6, 329-343.
Le Fanu J (2002) The case of the missing data. British Medical Journal. 325, 7378, 1490-1493.
Logsdon RG, Gibbons LE, McCurry SM, Teri L (1999) Quality of life in Alzheimer’s disease: patient and caregiver reports. Journal of Mental Health and Aging. 5, 1, 21-32.
Maltby J, Day L, Williams G (2007) Introduction to statistics for nurses. Pearson Higher Education
McCluskey A & Lalkhen AG (2007) Statistics IV: Interpreting the results of statistical tests. Continuing Education in Anaesthesia, Critical Care & Pain 7:6: 208-212
URL: http://ceaccp.oxfordjournals.org/content/7/6/208.full.pdf+html
Schulz KF, Altman DG, Moher D; CONSORT Group (2010) CONSORT 2010 Statement: updated guidelines for reporting parallel group randomised trials. British Medical Journal. 340, c332.
Williams S (2010) Statistics Anxiety and Instructor Immediacy. Journal of Statistics Education. 18:2:1-18.
URL: http://www.amstat.org/publications/jse/v18n2/williams.pdf