City, University of London Institutional Repository
Citation
: Gan, T., Wu, Y., Sun, Z. ORCID: 0000-0002-3862-7939, Jin, D., Song, H. and
Jia, M. (2018). Shock wave boundary layer interaction controlled by surface arc plasma actuators. Physics of Fluids, 30(5), 055107.. doi: 10.1063/1.5013166This is the accepted version of the paper.
This version of the publication may differ from the final published
version.
Permanent repository link:
http://openaccess.city.ac.uk/20337/Link to published version
: http://dx.doi.org/10.1063/1.5013166
Copyright and reuse:
City Research Online aims to make research
outputs of City, University of London available to a wider audience.
Copyright and Moral Rights remain with the author(s) and/or copyright
holders. URLs from City Research Online may be freely distributed and
linked to.
1
Shock Wave
Boundary
Layer Interaction Controlled by Surface Arc
Plasma Actuators
Tian Gan,1 Yun Wu,2, a) Zhengzhong sun,3 Di Jin,1 Huimin Song,1 and Min Jia,1
1 Science and Technology on Plasma Dynamics Laboratory, Air Force Engineering University, 710038,
Xi’an, China
2Science and Technology on Plasma Dynamics Laboratory, Xi’an Jiaotong University, 710049, Xi’an,
China
3Department of Mechanical Engineering and Aeronautics, City, University of London, EC1V 0HB,
London, UK
ABSTRACT
An array of 16 surface arc plasma actuators (SAPAs) is employed to control the shock wave boundary layer interaction (SWBLI) at a 26° compression ramp in a Mach 2.0 flow. A new electrical circuit is used to actuate all the 16 SAPAs. The electrical measurement reveals significant augmentation in peak current (200 A) and energy deposition of 1.05 J, which is the nominal characteristics of the setup. The SAPA array is later applied for SWBLI control. The actuator array is placed upstream of the SWBLI and operates at four different frequencies, namely 500 Hz, 1 kHz, 2 kHz and 5 kHz. In the wind tunnel experiment, high-speed schlieren at 25,000 frames per second is used for flow visualization. The shock wave system is modified significantly by the controlling gas blobs (CGBs) generated by SAPAs. The foot portion of the separation shock wave disappears and the oblique shock wave bifurcates when the CGBs passes through the interaction region. The shock weakening effect is further verified through the rms of the schlieren intensity of the same phase.
Keywords: shock wave boundary layer interaction, surface arc plasma actuator, supersonic flow control, active flow control
2 I. INTRODUCTION
Shock wave-boundary layer interaction (SWBLI) is a fundamental phenomenon in supersonic and hypersonic aerodynamics and is present in various aerodynamic applications, such as the supersonic inlet and the highly-loaded turbo-machinery. The occurrence of SWBLI is usually undesirable as it causes several adverse effects [1]. The shock wave induces an adverse pressure gradient (APG) and separates the
boundary layer flow, which causes performance deterioration in the aerodynamic applications, for example the supersonic inlet. In the worst circumstances, the inlet may suffer the unstart problem in the case of massive separation. The SBWLI is also known to be unsteady in nature. It is widely acknowledged that the flow in the interaction region oscillates at low frequencies in the domain which are less than 1 kHz [2,3], which is different from the high frequency fluctuations [4] in the supersonic turbulent
boundary layer. This low-frequency oscillation contributes to flow unsteadiness. Moreover, it also needs to be considered from the structural point of view, as the resulting undulating pressure imposes additional periodic or aperiodic loads [5] towards the flow surface and potentially results in structure fatigue and
unsteady moments, for example in shock buffeting over the wing [6], where large scale shock movement
takes place.
Passive and active flow control strategies are normally employed to address the mentioned adverse effects above caused by SWBLI. Vortex generator (VG), a category of passive device, is commonly used. It operates by generating streamwise vortices that enhance the mixing between the freestream and the near-wall flow and deliver a fuller boundary layer profile [7,8], which is preferred to
counteract the APG. Although the VG has a promising ability in separation reduction, its intrusion into the flow inevitably induces parasitic drag. The active flow control strategy in the form of ejection/bleeding are non-intrusive to the flow field [9,10], hence no shape drag will result. However,
ejection consumes a considerable amount of the precious pressurized air from the engine, while bleeding removes a good portion of the ingested flow mass. In addition, the ejection of flow is a steady control mechanism [11]. Therefore, it may have problems dealing with the unsteady flow features in SWBLI.
The Plasma-Based Actuator’s (PBA) high repetition rate enables itself as an unsteady control mechanism to address the unsteady flow features. Moreover, its strong forcing (significant heating effect and large jet velocity) makes it suitable for flow control applications in the high-speed flow regime, especially the SWBLI. The Localized Arc Filament Plasma Actuators (LAFPAs) were firstly used to control the compressible jet flow and the associated noise emission [12]. In that study, a circular array of 8
3
control mechanism of LAFPA was discussed, and it was concluded that the boundary layer modification was caused by the heat addition. Regarding the SWBLI control, Sun et al. [14] compared the millisecond
and microsecond discharges for the Surface Arc Plasma Actuator (SAPAs) and examined their impact onto SWBLIs caused by both incident shock wave and the compression ramp. After being originally proposed at the Johns Hopkins University [15], the Plasma Synthetic Jet Actuator’s (PSJA) application was
also extended by other researchers into SWBLI control. An array containing three PSJAs was employed to control the ramp induced SWBLIs [16], where separation reduction and upstream motion of the shock
wave were observed.
Reviewing the past experiments, the SWBLI control delivered by the PBAs is restricted by the amount of deposited energy in each pulse and the number of actuators. As the PBA exerts flow control through Joule heating, the electric current dominates the heating process, and it is thus pivotal in the control. The PSJA was employed by Narayanaswamy et al. [17] for controlling unsteadiness of the
compression ramp SWBLI. The results show that the jet exit velocity reaches 250 m/s and has energy deposition of about 30 mJ per pulse. Webb et al. [18] applied the LAFPA to controlling the SWBLI of
impingement shock type. The current and voltage are reportedly to be 0.25 A and 7.5 kV, respectively. However, the deposited energy is not reported. Kalra et al. [19] successfully generated a “snowplough”
discharge in the presence of an external magnetic field to modify the separation bubble in a SWBLI induced by impingement shock wave. This experiment obtains a peak current of 1 A. In a similar SWBLI configuration, Sun et al. [20] achieved a stronger current of 40 A and a higher energy deposition of 18~20
mJ. Moreover, only a limited number of actuators were installed in the previous studies, which is not ideal for practical flow application, as a larger number of actuators are practically required for a bigger control surface. More actuators can also be arranged into several arrays to deliver a stronger control authority.
The present work is motivated by the two limitations above and is performed as a continuing effort in advancing the PBA technology and examining its SWBLI control outcome. Modifications to the electrical driving circuits are proposed to increase the discharge current as well as the number of actuators. In the experiments, the SAPA is adopted, partly due to its compact structure. Our experience in using the PSJA finds that after some working cycles, the PSJA becomes too hot to inhale fresh cold gas from the main stream, resulting in a choked condition. Although this choking issue can be solved by a proper cooling strategy, the SAPA is chosen as the actuator under investigation at this stage. The SAPA array is installed to control the SWBLI which is established at a 26-degree compression ramp at Mach number of 2.0.
4
section of experimental results, the electrical performance of the SAPA is revealed, which is followed by the detailed analysis of baseline SBWLI and the control outcome using SAPAs. In the experiment, the SAPAs are triggered at different frequencies, namely 500Hz, 1 kHz, 2 kHz and 5 kHz respectively, so that the frequency effect can be studied. In the end of the paper, conclusions are finally drawn, and future works are suggested.
II. EXPERIMENTAL SETUP
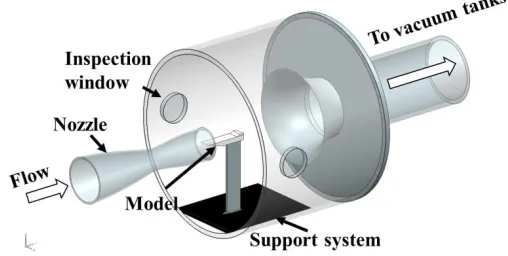
The experiments are carried out in a suction-type supersonic wind tunnel. This wind tunnel is driven by the pressure difference between the ambient air and the vacuum tank (400 m3 volume) downstream of the
[image:5.612.179.433.483.611.2]test chamber. The wind tunnel can generate flow at different Mach numbers by changing the contoured nozzles. The nozzle is of circular cross-section and has an outlet diameter of 300 mm. A cluster of eighteen layers of fine steel mesh screen is placed before the nozzle contraction section to reduce the turbulence intensity in the flow. The supersonic flow accelerated through the nozzle is ejected as a free jet into the test chamber which connects to the vacuum tank through a diffuser. The test chamber has a circular cross-section with diameter of 2 m. The area ratio between the test chamber and nozzle outlet is 44.4, which is large enough to ensure the free supersonic jet is not affected by the chamber wall. In the present experiments, the freestream Mach number is 2.0. The thickness of boundary layer is approximately𝛿=2.98 mm at the ramp location and the Reynolds number based on boundary thickness is estimated Reδ=3,270. The vacuum tank is set to a low pressure of 6,690 Pa and the room ambient pressure is 96 kPa. The duration of stable supersonic flow is approximately 1.5 seconds with the Mach 2.0 nozzle and the above pressure settings. A schematic of the wind tunnel is provided in figure 1.
Figure 1. The supersonic wind tunnel and the model installation.
5
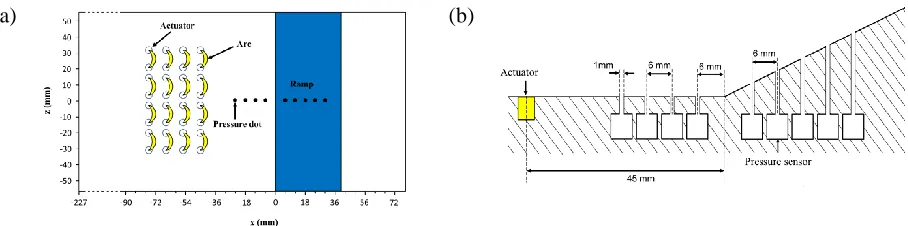
ramp piece has a height of 20 mm and is placed 227 mm downstream of the base plate leading edge. Therefore, a length of 227 mm is used to develop the turbulent boundary layer. The undisturbed turbulent boundary has a thickness of about 3 mm according to the schlieren image. The dimension of the compression ramp model is detailed in Figure 2.
[image:6.612.76.530.153.266.2](a) (b)
Figure 2. The compression ramp model: (a) top view, (b) arrangement of the pressure orifices.
A total number of 16 SAPAs are used for SWBLI control, and each SAPA contains two copper electrodes with a gap of 10 mm. The electrodes are flush mounted into the model baseplate. The SAPAs are arranged into 4 rows and each row has 4 actuators. The actuators are evenly distributed in both streamwise and spanwise directions with streamwise and lateral spacings of 11 mm and 17 mm, respectively. The most downstream actuator row is 42 mm ahead of the ramp foot. The actuators with conceptual electric arcs are also plotted in figure 2(a). The origin of the coordinate system is set at the ramp foot. The x-axis follows the freestream direction while the y-axis points to the wall-normal direction. The present coordinate system is also indicated in figure 2(a).
Nine orifices with diameter of 1 mm, referred to as P1-P9, are arranged along the model centerline for pressure measurement, as shown in figure 2(b). Four of them are located upstream of the ramp corner while the rest are distributed over the ramp surface. The most upstream orifice P1 is 24 mm upstream of the corner, and 18 mm downstream of the last actuator row. The neighboring orifices are separated by a distance of 6 mm, except the pair at the immediate upstream and downstream of the ramp corner, which are 12 mm apart. Nine CYG41000T miniature pressure sensors with 50 kHz bandwidth (manufacturer specification) are used in the experiment. The sensor has a pressure sensitive area of 6 mm2 and its output
6
be c/l ~ 2 kHz (tube length l~17 mm), which approximately suggests the upper limit of the frequency range. Since this value is above the dominate low frequency range of interest in the SWBLI unsteadiness, the other upstream sensors can be used confidently for measurement in the low-frequency domain.
Schlieren system is used for flow visualization. The present schlieren setup has the Z-type light path. The illumination is provided by a 500 Watt Gloria-X500A Xenon lamp. A Phantom V2512 ultra-high-speed camera is used for image recording. This camera enables high-ultra-high-speed imaging at 25 kHz with frame size of 1280×800 pixels, allowing a time separation of 40 µs between two consecutive images, which is deemed short enough to capture the wave motion with sufficient temporal resolution. The exposure time is set to the allowable minimum value of 1 µs, so as to reduce the temporal integration within each exposure. The camera is equipped with a 400 mm focal length Nikon lens, and it is focused onto the central plane of the test model. The spatial resolution of the schlieren image is calibrated to be 0.187 mm/pixel.
III. RESULTS AND DISCUSSIONS
A. Discharge Characteristics
In the work of Webb et al. [18], one DC power unit is used to drive 8 plasma actuators, which are in
parallel connection. Each actuator is individually equipped with a high-frequency switch. This circuit arrangement, in principle, can be extended to drive more than 8 devices, but an equivalent number of high-frequency switches are needed. This chosen circuit has the advantage of generating helical mode for jet control by defining the trigger phase; however, this has been demonstrated to be not effective in SWBLI control [21]. As a result, the actuator array in the present work is not envisaged to be triggered to
7
[image:8.612.72.504.76.173.2] [image:8.612.205.418.232.396.2](a) (b)
Figure 3. The new electric circuit (a) and the plasma arcs generated in the operation of the SAPA
array (b).
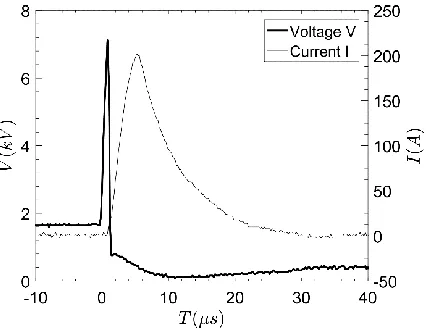
Figure 4 The voltage and current history in one discharge pulse.
8
voltage and current for the pulse reveals an energy deposition of 1.21 J and an averaged power of 40 kW. The total energy stored in the capacitor is estimated to be 2.25 J, making an efficiency of 54 %.It must be pointed out that this performance is the maximum nominal power the present circuit can deliver. The power in the subsequent pulses, however, was found to be less, because the heated control gas bulb
(CGB) generated in each pulse is smaller. Unfortunately, the voltage and current in the subsequent pulses cannot be measured in this work due to the limitation of the timing device in the laboratory. The power decay in the subsequent pulses is later understood as a result of the fact that the capacitor (see figure 3(a)) is only partially charged by the power supplies, as the interval time between the pulses is limited. It can be estimated that the period to fully charge the capacitor is about xx seconds. Thus, high frequency operation larger than xxx prevents the capacitor from being fully charged. The effect of trigger frequency on the discharge power is going to be analyzed later through the visualized CGBs.
B. Baseline SWBLI
Flow visualizations
The overall flow structure of the present SWBLI at the 26o compression ramp is represented through one
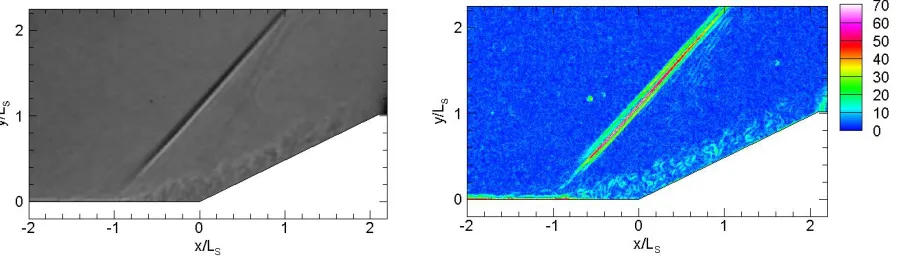
schlieren snapshot in figure 5(a), where the most prominent features are the shock wave and the highly turbulent near-wall region. The present shock wave has an angle of 50° with respect to the flat surface. The region of increased turbulence, an expected result of SWBLI, appears at the immediate downstream of the oblique shock. It has a sharp leading edge with an angle slightly smaller than the ramp angle. Flow separation usually happens inside the interaction region. As schlieren only reveals the density gradient, no flow direction information can be retrieved. Following the flow reattachment shortly after the ramp corner, the reattachment shock wave with weak intensity is present and joins the separation shock at y/LS=2.5. It should be noted that the boundary layer is also visualized, which manifests as the near wall strip brighter than the freestream background in figure 5(a).
[image:9.612.83.532.534.662.2]
Figure 5. The baseline SWBLI: (a) one random schlieren snapshot; (b) the gradient of the intensity
9
In order to enhance the perception of the flow structure, the spatial gradient of the pixel intensity in the digital schlieren image is calculated and the primary flow structures can be visualized with greater contrast. The calculation of spatial gradient of the schlieren intensity at each pixel follows the equation below:
𝐼𝑥𝑦= √( 𝜕𝐼 𝜕𝑥)
2
+ (𝜕𝑦𝜕𝐼)2
Where I is the pixel intensity in the digital schlieren image and (x, y) are pixel coordinates with unit of meter. The contour of Ixy of the schlieren image in figure 5(a) is shown in figure 5(b), where all the prominent flow structures are highlighted. The turbulent eddies in the near-wall turbulent region can be observed. Moreover, the oblique shock wave penetrates into the boundary layer and terminates at a small height from the wall, where the sonic line is located. Due to the weak intensity of the reattachment shock, only weak traces of Ixy concentration can be observed. The interaction region is measured from its leading edge till the ramp foot. It has a length of LS=19.1 mm. The LS is used as the length scale for distance normalization in the remainder of the paper. The interaction region is initially packed with intensive turbulent structures, which still exists with similar intensity over the ramp surface. Those turbulent eddies decay in intensity and they also become more sparsely separated beyond x/LS=1.
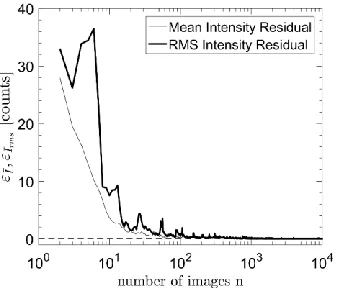
Reviewing the recording of the baseline SWBLI in the computer monitor frame by frame gives strong appreciation about the shock wave oscillation and unsteadiness of the SWBLI region, which are however less obvious through the observation of individual images. The rms statistics of the schlieren intensity field is therefore calculated to highlight the unsteadiness of the present SWBLI. The convergence of the statistics is secured by the very large image ensemble, i.e. 10,000 images captured at 25 kHz. The convergence histories for the mean and rms intensities are shown in figure 6. The quantity ε is the maximum residual, namely the maximum difference of the mean/rms pixel intensity between an ensemble of n images and an ensemble of (n-1) images. The mean intensity 𝐼̅ converges faster at the beginning. Both 𝜀𝐼̅ and 𝜀𝐼𝑟𝑚𝑠 are less than 1 count after more than 500 images,. The final values for 𝜀𝐼̅ and
𝜀𝐼𝑟𝑚𝑠are 0.0043 and 0.0047, respectively. Therefore, convergence of the mean and rms intensities is
achieved.
10
[image:11.612.219.389.123.267.2]gradually fades out after x/LS=1.0 due to the decay of the velocity shear. This location coincides with that where the turbulent eddies start to decay.
Figure 6. The convergence of the residuals for the mean and rms of the schlieren intensity.
(a) (b)
Figure 7. The converged schlieren intensity statistics: (a) the ensemble-averaged schlieren image, (b)
the rms schlieren intensity.
[image:11.612.84.541.327.477.2]11
Irms is at the immediate downstream of the shock impingement point till x/LS=-0.5. This small region of
enhanced fluctuation is likely associated with the unsteadiness of the interaction region. The near-wall region over the ramp has peak fluctuation intensity at x/LS =0.4. This downstream region is attributed by the shock induced turbulence along the ramp, which has already been revealed in the raw schlieren image. Decay of the turbulent intensity starts to take place after x/LS=1.0, which verifies the qualitative observation made on the gradient of schlieren intensity and time-averaged schlieren intensity. A region of slightly lower Irms intensity is revealed at the ramp corner from x/LS=−0.4~0.2. It is conjectured that this region suggests the size of the separation bubble caused by SWBLI, as the separated flow is of less fluctuation than the unsteady shear layer. So far, the converging schlieren technique enables in-depth flow visualization, and some further information can be retrieved which is not possible by observing the raw schlieren snapshot.
Pressure Statistics
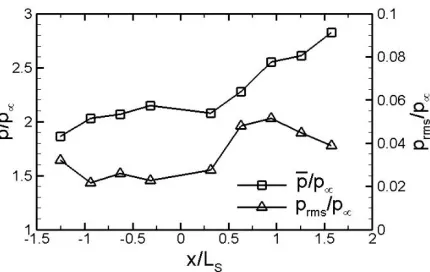
The time-averaged pressure (𝑝̅/p∞) along the ramp is analyzed, see figure 8. The mean value is averaged
in an ensemble of 150,000 samples, corresponding to a measurement duration of 0.375 second. The pressure increases upstream of the ramp and the adverse pressure gradient causes flow separation at the corner. The pressure plateau with magnitude around 𝑝̅/p∞=2.1 is deemed to be associated with the low
[image:12.612.200.415.456.592.2]momentum separated flow. This pressure plateau extends from x/Ls = -0.5 to 0.3, and it agrees approximately with the observation of the contour of Irms, where separated flow is conjectured to extend till about x/LS=0.2.
Figure 8. Time-averaged wall pressure and the rms of the instantaneous pressure.
The pressure continues to grow over the ramp surface with a steeper rate, and the pressure at P9 (x/Ls=1.57) reaches 𝑝̅/p∞=2.8. The prms is also calculated to reveal the pressure fluctuations. The prms is
12
produced at P7 with prms/p∞=0.052. The intensified level of prms over the ramp is linked to the strong flow fluctuations as revealed in the contour of Irms.
C. SWBLI Controlled by SAPAs
SWBLI Controlled by the 1st Pulse
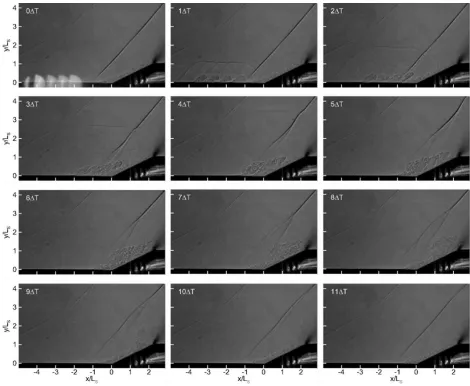
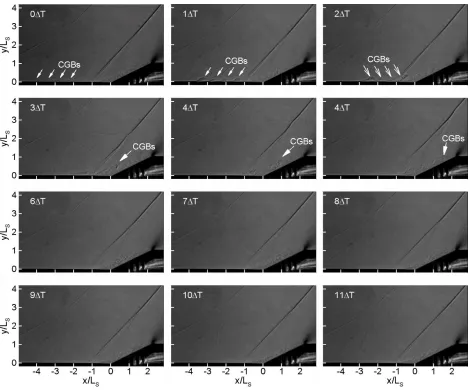
It was mentioned that more energy is deposited in the first pulse of the SAPA array as the capacitor is fully charged while it awaits the trigger signal. Therefore, the control effect of the first pulse is analyzed first, which should indicate the maximum control authority of the present driving circuit. The sequence of the time-resolved schlieren images in figure 9 visualizes the entire control process of the first pulse belonging to the 500 Hz trigger. It should be noted that the control process in the first pulse for other trigger frequencies is nearly the same, because similar amount of energy is deposited in the first pulse. The time separation ΔT between two adjacent images is 40μs (25 kfps imaging rate). The recording is triggered by the start of the wind tunnel, so the first image at t=0 does not overlap pricisely with the high-voltage trigger of the SAPAs, and it is later identified by reviewing the recording. The glare from the electric arc is recorded in the image which usually lasts about a few micro-seconds, the temporal delay between the first image and the high-voltage trigger should be within a few micro-seconds. For the convenience of dicussion, the first snapshot is labelled here as the temporal origin.
At t=0ΔT, the precursor heimispheric shock waves that generated in the rapid compression of the gas around the electrodes are already produced and they are visualized behind the glare. At this moment, the CGB is emerging due to the Joule heating in the plasma arcing process, but the SWBLI region at downstream is not affected yet. As revealed in an eariler study[22], the CGBs are produced with negligible
momentum. They are thus passively carried by the mainstream towards the SWBLI region.
The plasma arcing process has already completed at t=1ΔT, and the CGBs are fully generated. The CGB array obatins a height of 0.5LS and has already travelled a distance of about 1.0LS downstream from the actuator location. The first row CGBs (ordered from right to left) reach the foot of separation shock wave and the CGBs can be distinguished individually. The precursor shock waves, on the other hand, expand at the speed of Ma=1.0, and they merge into an umbrella shape. The right-leg of the precursor shock also intersects with the main separation shock wave at a height of y/Ls=0.8, but no significant deformation of both shocks is present.
13
[image:14.612.70.540.113.499.2]interaction. At a higher position of about y/LS=1.8, the merged precursor shock wave intersects the separation shock wave, and the latter undulates.
Figure 9. Schlieren visualization of SAPA control for the first pulse of the 500 Hz trigger.
In the next snapshot at t=3ΔT, the CGBs start to take over the SWBLI region. The individual CGBs are no longer distinguishable, and they all merge into a bigger cloud shape after interaction with the shock wave. The precursor shock waves expand further and intersect the sepation shock wave at
14
[image:15.612.77.530.196.289.2]In the following snapshot untill t=11ΔT, the merged CGBs are visualized as a turbulent strucutre different from the near wall turbulent region. They move over the ramp surface and finally leave the field of view. Within this period, the shock wave has experienced significant moudlation, for example, the foot portion of the separation shock is weakened and the shock wave bifurcates. As soon as the CGBs have passed the ramp, the shock wave returns to its original status in the baseline case.
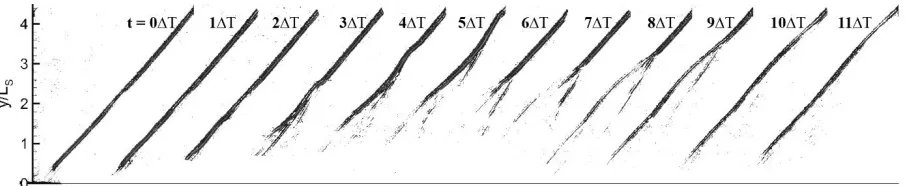
Figure 10. The evolution of the shock wave.
In order to provide a clearer analysis of shock wave manipulation, the shock waves are extacted from the original schlieren images and are shown together in the synthetic image in figure 10. The extraction is based on the threshold value of the spatial gradient of the schlieren intensity, namely Ixy=30. According to figure 10, the shock wave modulation can be analysed in two stages: the first stage is when
15
Although it is likely to be caused by the heating effect from the CGBs, detailed understanding requires the velocity field to be revealed.
The Frequency Effect
[image:16.612.175.438.359.616.2]In the experiment, it is found that the operating frequency influences the control outcome except that of the first pulse. The frequency effect is thus examined through the CGBs generated under four different frequencies, namely 500Hz, 1 kHz, 2 kHz and 5 kHz. The resulted CGBs are compared in figure 11, where the CGBs in the first pulse of each frequency are also attached for comparison. As explained in the above section, the image acquisition is not triggered by the plasma actuator, the schlieren images containing the freshly generated CGBs in each frequency do not belong to the same phase, but with temporal delay no larger than the imaging interval time (Δt = 40 μs). For example, the captured CGBs in the 1 kHz and 2 kHz cases are slightly more upstream and the precursor shock waves are closer to the CGBs. Therefore, these two snapshots are captured nearer to the SAPA trigger in time, and the CGBs show up as crystal bulbs.
Figure 11. The CGBs produced at different frequencies. The first pulse for each frequency is also included for
comparison.
16
[image:17.612.72.542.226.616.2]frequency, the CGBs in the subsequent pulses are of the same phase as their first pulse counterpart. One random pulse is selected and the CGBs in that pulse are shown in the right column of figure 11. Note that they are of the same phase as the CGBs in the first pulse as shown in the left column of figure 11. Increasing the frequency apparently reduces the size of the CGB. The CGBs at 500 Hz have a height half of that produced in the first pulse. But they are hardly observable at 2 kHz. The size reduction of the CGB is caused by the incomplete charge of the capacitor, because the time interval is reduced when the frequency goes up. The energy deposition is affected accordingly. This consequence is essentially not expected and solely caused by the characteristics of the capacitor.
Figure 12. Schlieren visualization of SAPA control for a random pulse at 500 Hz.
17
shock wave evolution also happens. As it shares similarity as that described in figure 10, it is not repeated here. The schlieren images in the other frequencies are not shown to maintain the clarity. Moreover, as the CGBs at higher frequencies have even smaller sizes, the control effect is less appreciable in the raw schlieren images. Instead, the control effect at higher frequencies will be assessed through a statistical approach.
The present large data ensemble allows the analysis of the control process through the phase-averaged flow. Each phase contains 200 images in the 500Hz case, as the present image ensemble is comprised of 10,000 images. According to the residual in the calculation of rms of schlieren intensity in the baseline SWBLI in figure 6, an ensemble of 200 images already has a residual below 1 count, which can be confidently deemed converged. The rms of the schlieren images in the consecutive phases in the 500Hz control is calculated and are shown in figure 13. Also as revealed earlier, the converged rms schlieren intensity of each phase represents the mean flow structure from a statistical point of view. Three major flow elements can be observed in figure 13, namely the shock wave, near-wall turbulent region after SWBLI and the CGBs. The shock wave here has stronger Irms than the other two. A smaller Irms occurs at the location of bifurcation point. The downstream shock branch is weaker and is not shown. The CGBs show up as a high concentration of Irms and go through the ramp surface. However, the CGBs merge with the wall fluctuation region from t=6ΔT, whereas those in the first pulse are distinguishable till their departure of the ramp,
[image:18.612.78.539.424.617.2]
Figure 13. The rms of schlieren images in the same phase for 500 Hz control.
18
the present recording rate offers less temporal resolution for a larger operating frequency. Hence the phase averaging and rms is calculated over the same temporal span of 0~50ΔT for all the frequencies. The selected temporal span is 1, 2, 4 and 10 times of the period for the 500Hz, 1 kHz, 2 kHz and 5 kHz actuations, respectively.
[image:19.612.73.515.309.594.2]In the 500Hz actuation case, the weak strip of Irms at y/Ls=2.2 corresponds to the triple point. The strip of slightly higher intensity at y/Ls=1.6 starts to be affected between t=2~10ΔT, suggesting that the CGBs exert shock weakening effect before leaving the ramp. In the remainder of the period, the shock foot regains its intensity. Increasing the actuation frequency also reduces the shock intensity. For example, the shock wave is weakened from 2~10ΔT for the 1 kHz case. However, the shock intensity recovers between the two pulses in figure 14(b). Even weaker effect can be seen in the 2000Hz and 5000Hz cases. The decreasing effect is attributed to the less powerful CGBs at higher actuation rates, therefore the capacitor issue need to be addressed.
19 IV. CONCLUSIONS
An array containing 16 SAPAs has been employed to control the SWBLI at a 26° compression ramp. A second DC power is used in addition to the primary high-frequency high-voltage power supply in the modified driving circuit. All the 16 actuators have been successfully triggered through the present driving circuit. Measurement of the discharge voltage and current reveals significant augmentation in the nominal energy deposition. Time-resolved schlieren visualization of the first pulse at 500 Hz reveals the control process, which represents the maximum control authority that the present SAPA array can deliver. The CGBs generated by the SAPAs are clearly visualized and they are carried downstream by the mainstream flow. The CGBs exert significant influence onto the shock wave when they pass through the SWBLI region. The foot region of the shock wave is removed. Meanwhile, the separation shock bifurcates, and the bifurcation point moves upward. Following the downstream motion of the CGBs, the shock foot recovers and gradually returns to the original baseline status. The shock wave removal by the CGBs is a rather exciting result, and it is understood as the local heating effect due to the presence of the CGBs which are comprised of hot gases. The increase of local sonic speed results in subsonic or lower Mach numbers at the ramp foot. Since the shock wave is removed or weakened, the induced pressure gradient is alleviated, and reduction of flow separation is expected. However, the separation reduction effect still has to be further validated as no flow direction information is available through schlieren visualization. The control effect executed by the first pulse is the same for different operating frequencies, as the capacitor is fully charged while it awaits the first high voltage trigger.
It is later realized that the subsequent pulses exhibit less powerful control than that of the first pulse. The control authority reduces gradually with the increase of SAPA’s operation frequency, which although unexpected, is due to the incomplete charge of the capacitor, as the larger repetition rate results in shorter interval time to charge the capacitor. As such, the energy deposition in the subsequent pulses reduces; resulting in smaller CGBs. Increasing the frequency up to 5 kHz sees weaker CGBs. The schlieren visualization reveals that the CGBs in the subsequent pulses in the 500 Hz case are able to control the shock wave in a similar way as the first pulse, but with reduced effect.
The large image ensemble of the present high-speed schlieren allows converged schlieren intensity field. The converged rms of schlieren intensity reveals some flow structures that are not
immediately observable in the schlieren snapshot, such as the separation region. High intensity of Irms is
present at the shock location due to the shock oscillation. The location of peak Irms denotes the mean
shock location and the intensity of Irms,max suggests the strength of the shock wave. Knowing the benefits
20
the snapshot belonging to the same phase in a control cycle. Reduction of the Irms intensity at the foot region can be clearly seen for the phases when the CGBs pass through the SWBLI region; However, the effect is weakened with larger frequency, which is attributed to the incomplete charge of the capacitor.
The future work needs to address two issues encountered in the present experiment. One is the use of capacitor that has better charge performance. The other one is to verify the alleviation of flow separation attributed by the weakened shock wave. The latter can be solved by velocity measurement using PIV.
ACKNOWLEDGEMENT
This research is supported by the Natural Science Foundation of China through Grants 51790511,
51522606, 51507187, 51336011, 11472306, 51611130198, 51407197, the UK Royal Society International Exchange Scheme IE150612, and the UK EPSRC Grant EP/R013608/1.
REFERENCES
[1] D. Dolling, Fifty years of shock-wave/boundary-layer interaction research: what next? AIAA Journal, 39(8): 1517-1531 (2001)
[2] M.E. Erengil and D. Dolling. Correlation of separation shock motion with pressure fluctuations in the incoming boundary layer, AIAA Journal, 29: 1868-77 (1991)
[3] M.E. Erengil and D. Dolling, Unsteady wave structure near separation in a Mach 5 compression ramp interaction, AIAA Journal, 29: 728–735(1991)
[4] N.T. Clemens and V. Narayanaswamy, Low-frequency unsteadiness of shock wave/turbulent boundary layer interactions, Annual Review of Fluid Mechanics, 46: 469-492(2014)
[5] L. Brusniak and D.S. Dolling, Engineering estimation of fluctuating loads in shock wave/turbulent boundary-layer interactions, AIAA Journal, 34(12):2554-2561 (2015)
[6] B. H. K. Lee, Self-sustained shock oscillations on airfoils at transonic speeds, Progress in Aerospace Sciences, 37: 147–96 (2001)
21
[8] Z. Sun, F.F.J. Schrijer, F. Scarano, and B. W. van Oudheusden, Decay of the supersonic turbulent wakes from micro-ramps, Physics of Fliuds, 26, 025115 (2014)
[9] L.J. Souverein, and J.F. Debieve, Effect of air jet vortex generators on a shock wave boundary layer interaction, Experiments in Fluids, 48(5):1553-1064 (2010)
[10] M.J. Rimlinger, T.I.-P. Shih, and W.J. Chyu, Shock-wave/boundary-layer interactions with bleed through rows of holes, Journal of propulsion and power, 12(2):217-224 (1996)
[11] S.B. Verma, C. Manisankar, and P. Akshara, Control of shock-wave boundary layer interaction using steady micro-jets, Shock waves, 25(5):535-543 (2015)
[12] M. Samimy, J.H. Kim, J. Kastner, I. Adamovich, and Y. Utkin, Active control of high-speed and high-Reynolds-number jets using plasma actuators, Journal of Fluid Mechanics, 578:305-330 (2007)
[13] N. Webb, C. Clifford, and M. Samimy, Control of oblique shock wave/boundary layer interactions using plasma actuators, Experiments in Fluids, 54:1545 (2013)
[14] Q. Sun, Y. Li, B. Cheng, W. Cui, W. Liu, and Q. Xiao, The characteristics of surface arc plasma and its control effect on supersonic flow, Physics Letters A, 378: 2672-2682 (2014)
[15] K.R. Grossman, B.Z. Cybyk, and D.M.V. Wie, Sparkjet actuators for flow control, AIAA Paper 2003-57
[16] B.R. Greene, N.T. Clemens, P. Magari, D. Micka, Control of mean separation in shock boundary interaction using pulsed jet, Shock waves, 25(5):495-505 (2015)
[17] V. Narayanaswamy, Investigation of a pulsed-plasma jet for separation shock/boundary layer interaction control, Ph.D. Thesis, The University of Texas at Austin (2010)
[18] N. Webb, Control of the interaction between an oblique shock wave and a supersonic turbulent boundary layer by localized arc filament plasma actuators, 2009, Dissertation
[19] C.S. Kalra, S.H. Zaidi, R.B. Miles, S.O. Macheret, Shockwave-boundary layer interaction control using magnetically driven surface discharges. Experiments in Fluids, 20:552 (2011)
[20] Q. Sun, W. Cui, Y.H. Li, B.Q. Cheng, D. Jin, J. Li, Shockwave-boundary layer interaction control by plasma aerodynamic actuation: An experimental investigation. Chin. Phys. B, 23(7): 552-559 (2014)
[21] N. Webb, C. Clifford, M. Samimy, Control of oblique shock wave/boundary layer interaction using plasma actuators, Experiments in Fluids, 54:1545 (2013)