METHODOLOGY
A fast and cost-effective microsampling
protocol incorporating reduced animal usage
for time-series transcriptomics in rodent malaria
parasites
Abhinay Ramaprasad
1,2*, Amit Kumar Subudhi
1, Richard Culleton
2and Arnab Pain
1*Abstract
Background: The transcriptional regulation that occurs in malaria parasites during the erythrocytic stages of infec-tion can be studied in vivo with rodent malaria parasites propagated in mice. Time-series transcriptome profiling commonly involves the euthanasia of groups of mice at specific time points followed by the extraction of parasite RNA from whole blood samples. Current methodologies for parasite RNA extraction involve several steps and when multiple time points are profiled, these protocols are laborious, time-consuming, and require the euthanization of large cohorts of mice.
Results: A simplified protocol has been designed for parasite RNA extraction from blood volumes as low as 20 μL (microsamples), serially bled from mice via tail snips and directly lysed with TRIzol reagent. Gene expression data derived from microsampling using RNA-seq were closely matched to those derived from larger volumes of leucocyte-depleted and saponin-treated blood obtained from euthanized mice with high reproducibility between biological replicates. Transcriptome profiling of microsamples taken at different time points during the intra-erythrocytic
devel-opmental cycle of the rodent malaria parasite Plasmodium vinckei revealed the transcriptional cascade commonly
observed in malaria parasites.
Conclusions: Microsampling is a quick, robust and cost-efficient approach to sample collection for in vivo time-series transcriptomic studies in rodent malaria parasites.
Keywords: Rodent malaria parasites, Transcriptomics, Time-series, Plasmodium, Malaria, Microsampling
© The Author(s) 2019. This article is distributed under the terms of the Creative Commons Attribution 4.0 International License (http://creat iveco mmons .org/licen ses/by/4.0/), which permits unrestricted use, distribution, and reproduction in any medium, provided you give appropriate credit to the original author(s) and the source, provide a link to the Creative Commons license, and indicate if changes were made. The Creative Commons Public Domain Dedication waiver (http://creat iveco mmons .org/ publi cdoma in/zero/1.0/) applies to the data made available in this article, unless otherwise stated.
Background
High-throughput gene expression analysis is a powerful tool for profiling the transcription of thousands of genes at a particular point in time. Variations in gene expres-sion in the malaria parasite across different life stages or conditions can reveal important aspects of gene regula-tion and funcregula-tion.
Combined analysis of the transcriptome and pro-teome at different stages of Plasmodium falciparum have revealed that there is extensive transcriptional [1–4] and post-transcriptional [5–8] regulation of the genome [9]. Messenger RNA levels of various genes peak at differ-ent stages during the intraerythrocytic developmdiffer-ental cycle (IDC), forming a transcriptional cascade in P. fal-ciparum [10] and other human malaria parasite species [11, 12]. Such time-series transcriptome studies, includ-ing perturbation experiments [13–15] can be performed with human malaria parasites, but only in in vitro or ex vivo cultures. Few studies have profiled gene expres-sion in vivo in clinically relevant field isolates [16–18] to infer gene function, but gene expression changes due to
Open Access
*Correspondence: [email protected]; arnab.pain@kaust. edu.sa
particular environmental conditions or gene knockouts require controlled experimental settings.
Rodent malaria parasites (RMPs) can be used as trac-table in vivo model systems for the study of the biology of malaria parasites [19–21]. RMPs are propagated in mice and mosquitoes under laboratory conditions, thus providing easy access to all the developmental stages of the parasite’s complex life cycle. Stage-specific tran-scriptional control has been observed in RMPs during their IDC [22–24], vector [22, 25–27] and liver stages [28]. Thus, genome-wide transcription profiling in RMP models, in conjunction with manipulation of genetic or environmental factors of the host and/or the parasite, can provide valuable mechanistic insights into various aspects of parasite biology including antigenic variation and immunopathology [29–33], vector transmission [34– 37] and drug resistance [38].
The extraction of parasite RNA from blood stages of RMPs involves several steps. Peripheral, parasitized whole blood from infected mice is collected at a desired time point during the course of infection through termi-nal sampling methods involving exsanguination [39]. In the case of profiling life-stage specific gene expression in RMPs that exhibit asynchronous parasite development in the blood (Plasmodium berghei and Plasmodium yoelii), schizonts separated via a density gradient column by cen-trifugation are either injected into the host and followed up in vivo or parasite stages are density-purified post blood collection. They can also be maintained as syn-chronous ex vivo cultures [23, 24].
In order to study stage-specific gene expression in synchronous parasites, such as Plasmodium chabaudi
and Plasmodium vinckei, and more importantly, gene expression changes in vivo during the course of an infec-tion or in response to perturbainfec-tions, transcriptomic profiling can be performed directly after blood collec-tion. Blood samples are first depleted of host leukocytes using either commercially available Plasmodipur filters (EuroProxima CAT#8011) or custom-made CF11 cel-lulose columns [40]. In addition to leukocyte depletion, host globin RNA within parasitized erythrocytes can be removed by releasing the parasites from the RBCs via saponin lysis prior to RNA isolation. RNA is extracted from the purified parasites using the guanidinium thio-cyanatephenol–chloroform method [41, 42] (with TRI-zol Reagent) or with column-based RNA extraction kits. RNA transcripts are then identified and their levels measured through microarray hybridization [22] or next-generation sequencing of RNA-seq libraries [23, 24]. While profiles from both methods correlate well [3, 43], RNA-seq involves direct, deep sequencing of RNA tran-scripts and offers an unbiased and highly resolved picture of the parasite’s transcriptional landscape by providing
information on genes expressed at low levels, alternative splicing events and antisense transcription at single base-pair resolution [3, 4, 43, 44].
As these experiments require exsanguination, large cohorts of mice are required for each time point (Fig. 1a). Thus, the number of animals that need to be euthanized directly increases with the number of biological repli-cates and time points, imposing ethical and cost con-straints on the study design. Sampling different animals at different time points also increases the probability that inter-animal variation, often leading to variability of the results.
Exsanguination involves deep terminal anesthesia of the mouse, and the performance of surgical procedures. This, along with the leukocyte depletion and saponin lysis steps, makes the entire procedure time-consuming, and requires considerable technical expertise. Thus, mul-tiple sampling at short time intervals requires significant cost, time-investment and high level of technical exper-tise. A simplified protocol, therefore, has been developed for time-series transcriptomics of RMPs that uses a serial blood microsampling approach for sample collection (Fig. 1a).
Microsamples are usually blood volumes of less than 50 μL which can be collected at multiple time points from a single mouse using less invasive procedures, such as tail snip or tail vein sampling. Microsampling tech-niques are quicker, cause less stress to the animal, allow multiple samples from the same animal through time and have been shown to significantly reduce animal usage in pharmacokinetic studies [45–48]. Here, the feasibility of sequencing parasite RNA transcripts from blood vol-umes as low as 20 μL has been evaluated and an assess-ment has been made whether data thus obtained reflects the true global gene expression hallmarks of the parasite. The impact of processing of blood samples without leu-kocyte depletion has also been assessed.
Methods
Laboratory animals and rodent malaria parasites
6- to 8 week old female CBA mice (SLC Inc., Shizuoka, Japan) were used in all experiments. Mice were housed at 26 °C and maintained on a diet of mouse feed (CLEA Rodent 499 Diet CE-2 from CLEA Japan, Inc.) and water. Mice infected with malaria parasites were given 0.05% para-aminobenzoic acid (PABA)-supplemented water to assist parasite growth.
Blood sampling
Comparison of microsampling and terminal sampling methods
In order to compare microsampling with terminal bleed sampling, blood sampling was performed in mice infected with either wild-type P. chabaudi parasites (Sam-ples I and II) or genetically modified P. chabaudi para-sites (PCHAS_1433600 gene knockout; Samples III and IV). On the fourth day post infection, each mouse was restrained and 1–2 mm of the distal portion of the tail was excised with sanitized scissors. Twenty microlitres of blood was subsequently collected from the tail by pipette and deposited in 500 μL of phosphate buffered saline (PBS) solution. Whole blood was briefly spun down in a tabletop microcentrifuge, supernatant removed and the RBC pellet resuspended in 500 μL TRIzol reagent (Ther-moFischer Cat#15596026). TRIzol lysates were tempo-rarily stored at 4 °C (for periods up to 48 h), or for longer periods at − 80 °C.
Thin blood films on glass slides were taken just before blood collection of blood, fixed with methanol and Giemsa-stained for estimating parasitaemia. Following this, mice were immediately anaesthetized with an intra-peritoneal injection of 0.2 mL of 10% sodium pentobar-bital solution in PBS solution. Once completely sedated, a vertical incision was made from the bottom of the rib cage to the right shoulder, forming a cavity. The brachial artery was cut and around 0.5–0.6 mL of blood was col-lected into 3 mL citrate saline solution (8.5 g of NaCl, 15 g trisodium citrate in 1 L of distilled water, pH 7.2) on ice with a sterile Pasteur pipette. The complete procedure was carried out with the mouse under isoflurane anaes-thesia via inhalation. Mice were euthanized by cervical dislocation.
Parasitized blood was centrifuged at 2300g for 5 min and the pellet washed once with 10 mL PBS solution to remove blood serum. The RBC pellet was obtained by further centrifugation at 2300g for 5 min and was then resuspended in 10 mL PBS solution. Cellulose columns (Sigma Cat# C6288) were prepared and equilibrated with PBS solution, following which blood solution was passed through the column to deplete mouse leukocytes. RBCs were then gently lysed with 0.15% saponin solution, cen-trifuged at 3400g for 5 min and ghost RBCs carefully removed leaving behind the parasite pellet. The parasite pellet was treated with 1 mL TRIzol reagent and stored at 4 °C.
Time‑series transcriptomics
Plasmodium vinckei infections were initiated in three CBA mice. On day four post infection, 20 μL blood was collected via tail snip at four time points; 06:00 h, 12:00 h, 18:00 h and 24:00 h. Blood samples were processed
as before and TRIzol lysates were stored at 4 °C. Blood slides were taken just before blood collection and para-sitaemia and proportions of different life stages (rings, early trophozoites, late trophozoites and schizonts) were measured. Mice were euthanized by cervical dislocation at the completion of the last sampling time point.
RNA extraction, library preparation and sequencing of RNA isolated from TRIzol was performed according to the manufacturer’s protocol (Invitrogen). The RNA pel-let was resuspended in 15 μL nuclease-free water, RNA quantity measured by Qubit fluorometer and RNA integ-rity measured by Agilent Bioanalyser (Agilent RNA 6000 Nano kit Cat#5067-1511).
Strand-specific mRNA sequencing was performed from total RNA using a TruSeq Stranded mRNA Sample Prep Kit LT (Illumina Cat#RS-122-2101) according to the manufacturer’s instructions. Briefly, polyA + mRNA was purified from total RNA using oligo-dT dynabead selec-tion. First strand cDNA was synthesized using randomly primed oligos followed by second strand synthesis where dUTPs were incorporated to achieve strand-specificity. The cDNA was adapter-ligated and the libraries ampli-fied by PCR. Libraries were sequenced in an Illumina Hiseq 2000 with paired-end 100 bp read chemistry.
RNA‑seq read mapping and gene expression analysis Strand-specific RNA-seq paired-end reads were mapped onto the reference genomes, P. chabaudi AS version 3
(http://www.gened b.org/Homep age/Pchab audi) and
P. vinckei vinckei CY genome (ENA study accession— PRJEB27301) using TopHat2 v2.0.13 [49] with options “–library-type =fr-firststrand” and “–no-novel-juncs”. Differential expression analysis was carried out using cuffdiff2 v2.2.1 [50] with “-u -b” parameters. Transcript integrity number (TIN) was calculated from the mapped reads using RSeqC [51]. Pearson correlation coefficients were calculated using cor function in R stats package [52] and visualized using corrplot package [53] in R. Multidi-mensional scaling was performed using cmdscale and dist
functions in stats R package. To create a phaseogram, the phase of gene expression was calculated using the ARSER [54] package and the genes were ordered according to their phase. Heatmaps were created using heatmap.2
function in gplots package [55] and graphs plotted using
ggplot2 [56] in R.
Real‑time qPCR using Biomark HD system
of forward and reverse primers of genes of interest to increase the number of copies to a detectable level. Prod-ucts were diluted fivefolds prior to amplification using SsoFast EvaGreen Supermix with low ROX and target specific primers in 96.96 Dynamic arrays on a Biomark HD microfluidic quantitative RT-PCR system (Fluid-igm) (run as technical duplicates). Expression data for each gene was retrieved in the form of Ct values (cycle threshold). The gene expression (in the form of dCt val-ues using PCHAS_1202900 as housekeeping gene) of 91 genes were assessed and compared between 2 and 4 biological replicates of microsamples and terminally bled samples as a validation of comparisons done by RNA-seq. The dCt values for terminally bled samples are uniformly lower than the microsamples (despite starting with equal amounts of template cDNA), which might be due to the fact that the terminally bled samples have a higher par-asite-to-host RNA ratio due to leukocyte depletion and saponin lysis steps.
Subsampling and cost estimation
Gene-wise fragment counts were inferred using feature-Counts [57] and subsampling analysis was performed using subSeq v1.4.1 [58]. Random subsampling of dif-ferent sizes (1, 3.16, 10, 31.6 and 100% of the total reads) was performed for the 12 P. vinckei samples with up to 10 replications at each subsampling step. For each sub-sampling step, differential expression analysis was per-formed for each pairwise comparison among the four time points with a q-value cutoff of 0.05 using two tools, DESeq 2 [59] and edgeR [60]. Cost estimation was done with the following conditions- (i) target sequencing depth of 3000,000 paired-end 100 bp reads per sample, (ii) sequencing cost per gigabasepair is $22 [61] and (iii) Cost of one 6-week old female CBA/J mouse is $31.68 (https ://www.jax.org/strai n/00065 6).
Results
Two sets of experiments were designed to assess the quality and reliability of the transcriptomic read-outs obtained from the microsampling approach. First, the
gene expression profiles obtained through microsam-pling were compared with that of the routinely applied technique of terminal bleeding, in mice infected with P. chabaudi parasites. In a second experiment, microsam-pling was performed with mice infected with P. vinckei
parasites to assess whether the microsampling protocol can reliably identify gene expression changes that occur during P. vinckei’s intraerythrocytic developmental cycle.
Comparison of microsampling and terminal sampling methods
Twenty microlitres of blood was collected via tail snip from P. chabaudi-infected mice, washed with PBS and immediately lysed with 0.5 mL TRIzol reagent. Follow-ing microsample collection, mice were anaesthetized and exsanguinated via incision of the brachial artery. Around 0.5 mL of blood was collected from each mouse, washed twice with PBS and passed through home-made CF11 cellulose columns to remove leukocytes. The RBCs were then gently lysed using saponin and the harvested para-site pellet was immediately lysed with 1 mL TRIzol rea-gent (see Fig. 1a).
The P. chabaudi microsamples were taken at a low par-asitaemia of 4–8% and this was reflected in the total RNA yield from these samples, with most yielding around 1 μg total RNA (see Table 1). Upon performing Illumina RNA sequencing and mapping RNA-seq reads onto the
P. chabaudi reference genome, it was found that a low percentage of the reads (4–12%) were of parasite origin in the P. chabaudi samples, resulting in low fragment cover-age for each gene (most genes had less than 50 fragments mapped onto them).
There was strong correlation between the normalized gene-wise Fragments Per Kilobase of transcript per Mil-lion mapped reads (FPKM) values of microsamples and terminal bleed samples (see Fig. 1c). Pearson correlations of 0.9 to 0.92 were obtained for the four mice that were profiled, based on the expression values of 3936 genes. A positive correlation was also obtained independently by quantitative real-time PCR (qRT-PCR) of 91 genes (see Additional file 1). However, out of all the genes with
(See figure on next page.)
reads in terminal bleed samples, 942 genes had no reads in the microsamples, owing to the lower fragment depths in microsamples.
Time‑series transcriptomics in Plasmodium vinckei
Plasmodium v. vinckei CY develops synchronously dur-ing blood stage growth [62], similar to P. chabaudi, and in contrast to P. yoelii and P. berghei that show asynchro-nous growth in vivo. The four time points sampled, there-fore, correspond to roughly dominant populations of ring (6 h), early trophozoite (12 h), late trophozoite (18 h) and schizont (24 h) stages. Twenty microlitre samples (micro-samples) were taken via tail snip from three mice infected with P. vinckei at four time points; 6 h, 12 h, 18 h and 24 h during the 4th day post infection, and lysed with TRIzol, as before.
First, the yield and quality of RNA obtained from microsamples were assessed. Plasmodium vinckei sam-ples were at a higher parasitaemia (at around 25%) than
Plasmodium chabaudi samples. This was reflected in the total RNA yield from these samples, with the major-ity yielding around 10 μg respectively (Table 1). Qual-ity assessment of total RNA using Bioanalyser found no evidence of degradation and showed rRNA elec-tropherogram peaks of both mouse and Plasmodium
origin as expected, (Fig. 1d). Higher percentages (55– 75%) of the total reads were mapped onto the P. vinckei
genome, resulting in higher fragment depth (most genes
with more than 424 mapped fragments) compared to P. chabaudi (Table 1).
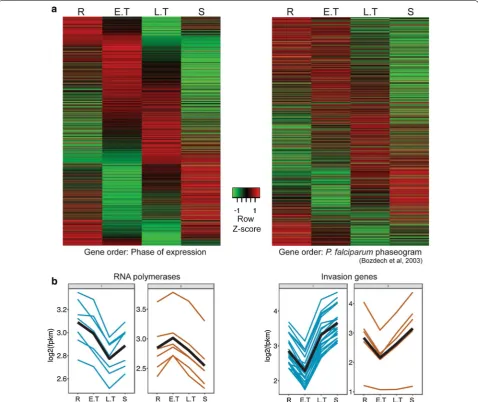
Multidimensional scaling of the samples from the four time points showed a good level of dissimilarity between their expression profiles reflecting stage-specific gene expression in the parasite. Tight correlations were also obtained among the three biological replicates at all four time points (Pearson correlations ranging from 0.97 to 0.99) (Fig. 1b). Of a total of 5073 genes in P. vinckei, 4328 genes were significantly differentially expressed (p value less than 0.05) at least in one time point (616 genes were not differentially expressed and only 129 genes had 0 FPKM value at least in one time point). As in other Plas-modium species [1, 3, 10, 11, 23, 24] stage-specific gene expression was inferred in P. vinckei by constructing a phaseogram, where the differentially expressed genes are ordered according to the time point at which their expression peaks (Fig. 2a). For example, as reported pre-viously [1], RNA polymerases (part of the transcription machinery) were highly expressed during the ring and early trophozoite stages and invasion-related genes dur-ing the late trophozoite and schizont stages (see Fig. 2b).
Next, a comparison was made between P. vinckei gene expression and the transcriptional cascade shown in P. falciparum [63]. Two thousand four hundred and eighty (2480) P. vinckei genes were ordered according to the expression values of their one-to-one orthologues in
P. falciparum (from a total of 2712 P. falciparum genes
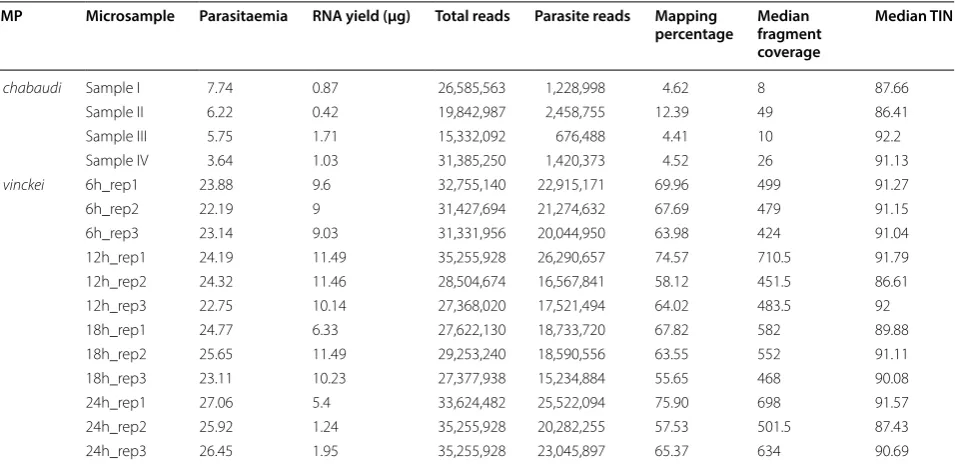
Table 1 Microsample characteristics and RNA-seq mapping statistics
Microsamples from Plasmodium chabaudi AS had low parasitaemia and therefore, a low percentage of reads mapping to the P. chabaudi genome. In contrast,
Plasmodium vinckei vinckei CY microsamples had lesser host contamination resulting in higher median fragment coverage across its transcripts. Transcript integrity number (TIN) was calculated using RSeQC [51] and all samples showed a high TIN value, indicating little to no evidence of RNA degradation
RMP Microsample Parasitaemia RNA yield (μg) Total reads Parasite reads Mapping
percentage Median fragment coverage
Median TIN
P. chabaudi Sample I 7.74 0.87 26,585,563 1,228,998 4.62 8 87.66
Sample II 6.22 0.42 19,842,987 2,458,755 12.39 49 86.41
Sample III 5.75 1.71 15,332,092 676,488 4.41 10 92.2
Sample IV 3.64 1.03 31,385,250 1,420,373 4.52 26 91.13
P. vinckei 6h_rep1 23.88 9.6 32,755,140 22,915,171 69.96 499 91.27
6h_rep2 22.19 9 31,427,694 21,274,632 67.69 479 91.15
6h_rep3 23.14 9.03 31,331,956 20,044,950 63.98 424 91.04
12h_rep1 24.19 11.49 35,255,928 26,290,657 74.57 710.5 91.79 12h_rep2 24.32 11.46 28,504,674 16,567,841 58.12 451.5 86.61 12h_rep3 22.75 10.14 27,368,020 17,521,494 64.02 483.5 92 18h_rep1 24.77 6.33 27,622,130 18,733,720 67.82 582 89.88 18h_rep2 25.65 11.49 29,253,240 18,590,556 63.55 552 91.11 18h_rep3 23.11 10.23 27,377,938 15,234,884 55.65 468 90.08
24h_rep1 27.06 5.4 33,624,482 25,522,094 75.90 698 91.57
[image:6.595.61.539.101.334.2]profiled in [63]), and a similar temporal expression cas-cade as in [63] was obtained (see Fig. 2a).
Minimum sequencing depth and cost estimation
The absence of any host depletion step reduces the pro-portion of sequencing reads of parasite origin and the final read coverage of parasite transcripts. In order to
assess the impact of host contamination, the minimum depth of sequencing coverage required per sample to gain robust results during gene expression analysis was estimated.
Random subsampling of different sizes (1, 3.16, 10, 31.6 and 100% of the total reads) was performed for the 12 P. vinckei samples and differentially expressed genes were Fig. 2 Time-series transcriptome of Plasmodium vinckei vinckei CY. a Heat maps showing gene expression in P. vinckei at 6 h time points during the 24 h asexual cycle, each corresponding to a dominant population of rings (R), early trophozoites (E.T), late trophozoites (L.T) and schizonts (S) respectively. Gene expression values have been centered and normalized as Z-scores with the average level of expression among the genes set as zero (black) and higher and lower levels shown as red and green respectively. On the left panel, all significantly regulated P. vinckei genes (4328 genes) were ordered from top to bottom according to their phase of expression to create a phaseogram. On the right panel, P. vinckei genes with one-to-one orthologs in P. falciparum 3D7 (2480 genes) were ordered based on P. falciparum 3D7 phaseogram shown in [1]. Both kinds of ordering display the transcriptional cascade in P. vinckei, closely reflecting that of P. falciparum. Gene-wise FPKM values are given in Additional files 3 and 4).
[image:7.595.59.538.88.490.2]inferred in each case at a significance level (q-value) of 0.05. It was observed that the number of differentially expressed genes and their expression values (in all pair-wise comparisons between the four time points) did not change drastically in subsamples of and above 31.6% of the total reads, which is equivalent to around 3 mil-lion paired-end reads per sample (see Additional file 2). Setting this as the target sequencing depth for an RMP transcriptome, sequencing and animal costs alone were calculated for different host contamination levels (10 to 80%) for a microsampling experiment and compared with a terminal blood sampling experiment. As the number of time points or biological replicates increase in the study design, microsamples with host contamination levels less than 70% would cost the same or less than terminal blood sampling (see Additional file 2). Differences in other costs incurred for animal housing and laboratory reagents between the two protocols were assumed to be negligible. These estimates were also made without considering the substantial manpower costs associated with the terminal blood sampling procedure.
Discussion
Serial profiling of gene expression during the course of infection of rodent malaria parasites can be a power-ful tool for studying host–parasite interactions and gene regulation during the clinically important blood stages of the parasite. Blood sampling in time-series experiments is usually carried out through terminal techniques in order to obtain sufficient blood volumes for subsequent host leukocyte removal and for isolating large quantities of total RNA to satisfy the input requirements of micro-array or sequencing protocols.
However, when the study design involves several time points or biological replicates, terminal blood sampling becomes laborious and requires large numbers of mice. Here we propose microsampling as a quick, easier, non-invasive alternative, which allows serial sampling of small blood volumes from the same animal. The microsampling of blood from mice provides robust results in pharma-cokinetic studies [45–48], but its application for tran-scriptomic profiling has not been evaluated.
Given that only a small fraction of the parasite popula-tion is sampled during microsampling compared to ter-minal techniques, it is possible that the former method may provide a biased or highly variable gene expression profile. However, above experiments demonstrate that microsamples from biological replicates show highly similar expression profiles and also reflect closely the expression levels obtained from terminal blood sam-pling. Correlations of 0.9–0.92 between microsamples and terminal bleed samples have been shown. It is possi-ble that some of the variation observed may be due to the
20–30 min time lag between microsampling and terminal bleed points due to the anaesthetizing and exsanguina-tion of mice for blood collecexsanguina-tion.
Gene expression analysis of microsamples collected from four time points or life stages across the 24 h life cycle of P. vinckei showed most of its genes differentially expressed and forming a transcriptional cascade typi-cal of a malaria parasite. Moreover, orthologous genes between P. vinckei and P. falciparum showed similar expression profiles in their respective life stages. Thus, the protocol was able to capture the transcriptional regulation occurring in P. vinckei life stages but at lower cost, time and effort than previous protocols for profiling stage-specific gene expression in RMPs.
This simplified approach offers several advantages over standard techniques. It drastically reduces the num-ber of animals used. In the time-series experiment in
P. vinckei, only three mice were used, whereas 12 mice (four time points and three biological replicates) would have been required in the case of terminal blood collec-tion. This relaxes ethical and cost constraints on study designs. More time points and biological replicates could be included for performing transcriptome analysis and drawing conclusions with better statistical power. This allows for significantly reduced animal usage without drastically reducing the sensitivity and specificity of the gene expression assays, thus following the principles of the 3Rs (https ://www.nc3rs .org.uk/the-3rs). Microsam-pling is very quick and it takes less than 5 min to collect, wash and stabilize the sample in TRIzol. This reduces the time elapsed between sample collection and cell lysis, thus providing a “snapshot” of gene expression at a par-ticular time point. While 20 μL blood volumes have been used here, with the availability of efficient RNA extrac-tion and low-input RNA library preparaextrac-tion kits, it is also possible to process microsamples of less than 20 μL.
Quick sampling and low sample volumes will enable gene expression profiling at more frequent time points. Microsampling techniques are less invasive and do not require warming of the animal, thus reducing animal stress. While tail snip blood collection has been used here, other suitable methods [64], such as tail vein sam-pling, saphenous vein sampling and capillary microsa-mpling [65], can be adopted to further reduce animal stress. These collection methods are also simple and do not require expertise in surgical procedures. This proto-col also allows for expression profiling at multiple time points from the same host, thus reducing animal-to-ani-mal variation.
is, therefore, required per sample to compensate for host contamination and to achieve a suitable sequenc-ing depth of the parasite’s transcriptome. By randomly reducing the number of reads in the dataset, it is esti-mated that only 3 million paired-end reads are required for robust differential expression analyses. Increasing the number of replicates could further reduce this minimum sequencing depth.
Around 20% of the genes did not have fragment cov-erage in microsamples with P. chabaudi at low parasitae-mias suggesting that host contamination at parasitaeparasitae-mias of below 7% would render this methodology unfeasible, requiring extremely large amounts of sequencing to achieve sufficient sequencing depth for parasite tran-scripts. The protocol is well-suited for higher parasitae-mias as shown in the P. vinckei microsamples that yielded sufficient fragment coverage for almost all of the genes.
Based on current animal and sequencing costs, it can be said that any study with host contamination as high as 70% would still be economically viable, especially when the significant reduction in manpower costs is consid-ered. Host reads would of course be informative in stud-ies that profile both host and parasite transcriptomes simultaneously to study host response to infection.
Conclusions
RNA extraction, sequencing and expression analyses can be performed with 20 μL of malaria parasite infected blood in a robust, reproducible and cost-efficient way. The protocol presented here may also be adapted to pro-file the in vivo transcriptome of other blood-borne path-ogens, such as trypanosomes in rodent models. Blood collection and TRIzol lysis can be performed within 5 min allowing snapshots of gene expression to be taken quickly, at more frequent time points, and using less manpower. Serial bleeding of the same mice throughout the study reduces the number of animals used and ani-mal-to-animal variation.
Additional files
Additional file 1. Correlation between microsamples and terminally bled samples.
Additional file 2. Subsampling and cost estimation for microsampling protocol.
Additional file 3. Gene expression data of P. vinckei. FPKM values of P. vinckei genes ordered according to their phase of expression.
Additional file 4.P. vinckei genes ordered according to the gene expres-sion of their orthologs in P. falciparum.
Additional file 5. RNA polymerases and invasion related genes whose expression profiles are shown in Fig. 2b.
Authors’ contributions
AR, RC and AP designed the methodology. AR collected, analyzed and inter-preted the data. AKS designed and performed real-time qPCR experiments. AR wrote the manuscript and all authors contributed to it. All authors read and approved the final manuscript.
Author details
1 Pathogen Genomics Laboratory, Biological and Environmental Sciences and Engineering (BESE) Division, King Abdullah University of Science and Technology (KAUST), Thuwal, Kingdom of Saudi Arabia. 2 Malaria Unit, Department of Pathology, Institute of Tropical Medicine (NEKKEN), Nagasaki University, 1-12-4 Sakamoto, Nagasaki 852-8523, Japan.
Acknowledgements
The authors would like to acknowledge the Bioscience Core Laboratory (BCL) at King Abdullah University of Science and Technology for their help with next generation sequencing.
Competing interests
The authors declare that they have no competing interests.
Availability of data and materials
All raw sequencing fastq files are available through the European Nucleotide Archive study accession number: PRJEB27301.
Consent for publication Not applicable.
Ethics approval and consent to participate
Laboratory animal experimentation was performed in accordance with the Japanese Humane Treatment and Management of Animals Law (Law No. 105 dated 19 October 1973 modified on 2 June 2006), and the Regulation on Animal Experimentation at Nagasaki University, Japan. The protocol was approved by the Institutional Animal Research Committee of Nagasaki Univer-sity (permit: 12072610052).
Funding
RC was supported by a Grant (JP16K21233) from the Japan Society for the Pro-motion of Science. This work was supported by KAUST faculty baseline fund (BAS/1/1020-01-01) and Competitive Research Fund (URF/1/2267-01-01) to AP.
Publisher’s Note
Springer Nature remains neutral with regard to jurisdictional claims in pub-lished maps and institutional affiliations.
Received: 31 October 2018 Accepted: 18 January 2019
References
1. Bozdech Z, Llinas M, Pulliam BL, Wong ED, Zhu J, DeRisi JL. The tran-scriptome of the intraerythrocytic developmental cycle of Plasmodium falciparum. PLoS Biol. 2003;1:E5.
2. Le Roch KG, Zhou Y, Blair PL, Grainger M, Moch JK, Haynes JD, et al. Discovery of gene function by expression profiling of the malaria parasite life cycle. Science. 2003;301:1503–8.
3. Otto TD, Wilinski D, Assefa S, Keane TM, Sarry LR, Bohme U, et al. New insights into the blood-stage transcriptome of Plasmodium falciparum using RNA-Seq. Mol Microbiol. 2010;76:12–24.
4. Sorber K, Dimon MT, Derisi JL. RNA-Seq analysis of splicing in Plasmodium falciparum uncovers new splice junctions, alternative splicing and splic-ing of antisense transcripts. Nucleic Acids Res. 2011;39:3820–35. 5. Le Roch KG, Johnson JR, Florens L, Zhou Y, Santrosyan A, Grainger M, et al.
Global analysis of transcript and protein levels across the Plasmodium falciparum life cycle. Genome Res. 2004;14:2308–18.
7. Bunnik EM, Chung D-WD, Hamilton M, Ponts N, Saraf A, Prudhomme J, et al. Polysome profiling reveals translational control of gene expression in the human malaria parasite Plasmodium falciparum. Genome Biol. 2013;14:R128.
8. Caro F, Ahyong V, Betegon M, DeRisi JL. Genome-wide regulatory dynam-ics of translation in the Plasmodium falciparum asexual blood stages. eLife. 2014;3:e04106.
9. Gardner MJ, Hall N, Fung E, White O, Berriman M, Hyman RW, et al. Genome sequence of the human malaria parasite Plasmodium falcipa-rum. Nature. 2002;419:498–511.
10. Llinas M, Bozdech Z, Wong ED, Adai AT, DeRisi JL. Comparative whole genome transcriptome analysis of three Plasmodium falciparum strains. Nucleic Acids Res. 2006;34:1166–73.
11. Bozdech Z, Mok S, Hu G, Imwong M, Jaidee A, Russell B, et al. The transcriptome of Plasmodium vivax reveals divergence and diversity of transcriptional regulation in malaria parasites. Proc Natl Acad Sci USA. 2008;105:16290–5.
12. Lapp SA, Mok S, Zhu L, Wu H, Preiser PR, Bozdech Z, et al. Plasmodium knowlesi gene expression differs in ex vivo compared to in vitro blood-stage cultures. Malar J. 2015;14:110.
13. Oakley MSM, Kumar S, Anantharaman V, Zheng H, Mahajan B, Haynes JD, et al. Molecular factors and biochemical pathways induced by febrile temperature in intraerythrocytic Plasmodium falciparum parasites. Infect Immun. 2007;75:2012–25.
14. Natalang O, Bischoff E, Deplaine G, Proux C, Dillies M-A, Sismeiro O, et al. Dynamic RNA profiling in Plasmodium falciparum synchronized blood stages exposed to lethal doses of artesunate. BMC Genomics. 2008;9:388. 15. Hu G, Cabrera A, Kono M, Mok S, Chaal BK, Haase S, et al. Transcriptional
profiling of growth perturbations of the human malaria parasite Plasmo-dium falciparum. Nat Biotechnol. 2010;28:91–8.
16. Ndam NT, Bischoff E, Proux C, Lavstsen T, Salanti A, Guitard J, et al. Plasmodium falciparum transcriptome analysis reveals pregnancy malaria associated gene expression. PLoS ONE. 2008;3:e1855.
17. Yamagishi J, Natori A, Tolba MEM, Mongan AE, Sugimoto C, Katayama T, et al. Interactive transcriptome analysis of malaria patients and infecting Plasmodium falciparum. Genome Res. 2014;24:1433–44.
18. Mok S, Ashley EA, Ferreira PE, Zhu L, Lin Z, Yeo T, et al. Population transcriptomics of human malaria parasites reveals the mechanism of artemisinin resistance. Science. 2015;347:431–5.
19. Langhorne J, Buffet P, Galinski M, Good M, Harty J, Leroy D, et al. The relevance of non-human primate and rodent malaria models for humans. Malar J. 2011;10:23.
20. Matz JM, Kooij TW. Towards genome-wide experimental genetics in the in vivo malaria model parasite Plasmodium berghei. Pathog Glob Health. 2015;109:46–60.
21. Stephens R, Culleton RL, Lamb TJ. The contribution of Plasmo-dium chabaudi to our understanding of malaria. Trends Parasitol. 2012;28:73–82.
22. Hall N, Karras M, Raine JD, Carlton JM, Kooij TWA, Berriman M, et al. A comprehensive survey of the Plasmodium life cycle by genomic, tran-scriptomic, and proteomic analyses. Science. 2005;307:82–6.
23. Otto TD, Bohme U, Jackson AP, Hunt M, Franke-Fayard B, Hoeijmakers WA, et al. A comprehensive evaluation of rodent malaria parasite genomes and gene expression. BMC Biol. 2014;12:86.
24. Hoo R, Zhu L, Amaladoss A, Mok S, Natalang O, Lapp SA, et al. Integrated analysis of the Plasmodium species transcriptome. EBioMedicine. 2016;7:255–66.
25. Mair GR. Regulation of sexual development of Plasmodium by transla-tional repression. Science. 2006;313:667–9.
26. Mair GR, Lasonder E, Garver LS, Franke-Fayard BMD, Carret CK, Wiegant JCAG, et al. Universal features of post-transcriptional gene regula-tion are critical for Plasmodium zygote development. PLoS Pathog. 2010;6:e1000767.
27. Silvie O, Briquet S, Müller K, Manzoni G, Matuschewski K. Post-transcrip-tional silencing of UIS4 in Plasmodium berghei sporozoites is important for host switch. Mol Microbiol. 2014;91:1200–13.
28. Tarun AS, Peng X, Dumpit RF, Ogata Y, Silva-Rivera H, Camargo N, et al. A combined transcriptome and proteome survey of malaria parasite liver stages. Proc Natl Acad Sci USA. 2008;105:305–10.
29. Lawton J, Brugat T, Yan YX, Reid AJ, Bohme U, Otto TD, et al. Charac-terization and gene expression analysis of the cir multi-gene family of Plasmodium chabaudi chabaudi (AS). BMC Genomics. 2012;13:125. 30. Brugat T, Reid AJ, Lin JW, Cunningham D, Tumwine I, Kushinga G, et al.
Antibody-independent mechanisms regulate the establishment of chronic Plasmodium infection. Nat Microbiol. 2017;2:16276. 31. Lin J-W, Sodenkamp J, Cunningham D, Deroost K, Tshitenge TC,
McLaughlin S, et al. Signatures of malaria-associated pathology revealed by high-resolution whole-blood transcriptomics in a rodent model of malaria. Sci Rep. 2017;7:41722.
32. Spence PJ, Jarra W, Levy P, Reid AJ, Chappell L, Brugat T, et al. Vector transmission regulates immune control of Plasmodium virulence. Nature. 2013;498:228–31.
33. Miller Jessica L, Sack Brandon K, Baldwin M, Vaughan Ashley M, Kappe Stefan HI. Interferon-mediated innate immune responses against malaria parasite liver stages. Cell Rep. 2014;7:436–47.
34. Lindner SE, Mikolajczak SA, Vaughan AM, Moon W, Joyce BR, Sullivan WJ, et al. Perturbations of Plasmodium Puf2 expression and RNA-seq of Puf2-deficient sporozoites reveal a critical role in maintain-ing RNA homeostasis and parasite transmissibility. Cell Microbiol. 2013;15:1266–83.
35. Roques M, Wall RJ, Douglass AP, Ramaprasad A, Ferguson DJP, Kain-dama ML, et al. Plasmodium P-type cyclin CYC3 modulates endomi-totic growth during oocyst development in mosquitoes. PLoS Pathog. 2015;11:e1005273.
36. Guttery DS, Roques M, Holder AA, Tewari R. Commit and transmit: molecular players in Plasmodium sexual development and zygote dif-ferentiation. Trends Parasitol. 2015;31:676–85.
37. Modrzynska K, Pfander C, Chappell L, Yu L, Suarez C, Dundas K, et al. A knockout screen of ApiAP2 genes reveals networks of interacting transcriptional regulators controlling the Plasmodium life cycle. Cell Host Microbe. 2017;21:11–22.
38. Shaw PJ, Chaotheing S, Kaewprommal P, Piriyapongsa J, Wongsom-bat C, Suwannakitti N, et al. Plasmodium parasites mount an arrest response to dihydroartemisinin, as revealed by whole transcriptome shotgun sequencing (RNA-seq) and microarray study. BMC Genomics. 2015;16:830.
39. Parasuraman S, Raveendran R, Kesavan R. Blood sample collection in small laboratory animals. J Pharmacol Pharmacother. 2010;1:87–93. 40. Venkatesan M, Amaratunga C, Campino S, Auburn S, Koch O, Lim P, et al. Using CF11 cellulose columns to inexpensively and effectively remove human DNA from Plasmodium falciparum-infected whole blood samples. Malar J. 2012;11:41.
41. Chomczynski P. A reagent for the single-step simultaneous isolation of RNA, DNA and proteins from cell and tissue samples. Biotechniques. 1993;15:532–7.
42. Chomczynski P, Sacchi N. Single-step method of RNA isolation by acid guanidinium thiocyanate-phenol-chloroform extraction. Anal Biochem. 1987;162:156–9.
43. Zhu L, Mok S, Imwong M, Jaidee A, Russell B, Nosten F, et al. New insights into the Plasmodium vivax transcriptome using RNA-Seq. Sci Rep. 2016;6:20498.
44. Siegel TN, Hon C-C, Zhang Q, Lopez-Rubio J-J, Scheidig-Benatar C, Mar-tins RM, et al. Strand-specific RNA-Seq reveals widespread and devel-opmentally regulated transcription of natural antisense transcripts in Plasmodium falciparum. BMC Genomics. 2014;15:150.
45. Bateman KP, Castonguay GV, Xu L, Rowland S, Nicoll-Griffith DA, Kelly N, et al. Reduction of animal usage by serial bleeding of mice for pharma-cokinetic studies: application of robotic sample preparation and fast liquid chromatography–mass spectrometry. J Chromatogr B Biomed Sci Appl. 2001;754:245–51.
46. Peng SX, Rockafellow BA, Skedzielewski TM, Huebert ND, Hageman W. Improved pharmacokinetic and bioavailability support of drug discov-ery using serial blood sampling in mice. J Pharm Sci. 2009;98:1877–84. 47. Rahavendran SV, Vekich S, Skor H, Batugo M, Nguyen L, Shetty B, et al.
Discovery pharmacokinetic studies in mice using serial microsa-mpling, dried blood spots and microbore LC-MS/MS. Bioanalysis. 2012;4:1077–95.
•fast, convenient online submission
•
thorough peer review by experienced researchers in your field
• rapid publication on acceptance
• support for research data, including large and complex data types
•
gold Open Access which fosters wider collaboration and increased citations maximum visibility for your research: over 100M website views per year
•
At BMC, research is always in progress.
Learn more biomedcentral.com/submissions
Ready to submit your research? Choose BMC and benefit from: 49. Kim D, Pertea G, Trapnell C, Pimentel H, Kelley R, Salzberg SL. TopHat2:
accurate alignment of transcriptomes in the presence of insertions, dele-tions and gene fusions. Genome Biol. 2013;14:R36.
50. Trapnell C, Hendrickson DG, Sauvageau M, Goff L, Rinn JL, Pachter L. Dif-ferential analysis of gene regulation at transcript resolution with RNA-seq. Nat Biotechnol. 2013;31:46–53.
51. Wang L, Wang S, Li W. RSeQC: quality control of RNA-seq experiments. Bioinformatics. 2012;28:2184–5.
52. Becker RA, Chambers JM, Wilks AR. The New S Language: a programming environment for data analysis and graphics. California: Wadsworth Brooks, Pacific Grove Ca; 1988. p. 702.
53. Wei T, Simko V. corrplot: visualization of a correlation matrix. 2016. 54. Yang R, Su Z. Analyzing circadian expression data by harmonic
regres-sion based on autoregressive spectral estimation. Bioinformatics. 2010;26:i168–74.
55. Warnes GR, Bolker B, Bonebakker L, Gentleman R, Liaw WHA, Lumley T, et al. gplots: various R programming tools for plotting data. 2016. 56. Wickham H. ggplot2: elegant graphics for data analysis. 2009. 57. Liao Y, Smyth GK, Shi W. FeatureCounts: an efficient general purpose
program for assigning sequence reads to genomic features. Bioinformat-ics. 2014;30:923–30.
58. Robinson DG, Storey JD. SubSeq: determining appropriate sequenc-ing depth through efficient read subsamplsequenc-ing. Bioinformatics. 2014;30:3424–6.
59. Love MI, Anders S, Huber W. Differential analysis of count data—the DESeq2 package. Genome Biol. 2014;15:550.
60. Robinson MD, McCarthy DJ, Smyth GK. edgeR: a Bioconductor package for differential expression analysis of digital gene expression data. Bioin-formatics. 2010;26:139–40.
61. Goodwin S, McPherson JD, McCombie WR. Coming of age: ten years of next-generation sequencing technologies. Nat Rev Genet. 2016;17:333–51.
62. Gautret P, Deharo E, Chabaud AG, Ginsburg H, Landau I. Plasmodium vinckei vinckei, P. v. lentum and P. yoelii yoelii: chronobiology of the asexual cycle in the blood. Parasite. 1994;1:235–9.
63. Noedl H, Se Y, Schaecher K, Smith BL, Socheat D, Fukuda MM, et al. Evidence of artemisinin-resistant malaria in western Cambodia. N Engl J Med. 2008;359:2619–20.
64. Patel NJ, Wickremsinhe E, Hui YH, Barr A, Masterson N, Ruterbories K, et al. Evaluation and optimization of blood micro-sampling methods: serial sampling in a cross-over design from an individual mouse. J Pharm Pharm Sci. 2016;19:496–510.