Triggering active galactic nuclei in galaxy clusters
Madeline A. Marshall,
1‹Stanislav S. Shabala,
1Martin G. H. Krause,
1,2Kevin A. Pimbblet,
3,4,5Darren J. Croton
6and Matt S. Owers
7,81School of Physical Sciences, Private Bag 37, University of Tasmania, Hobart, TAS 7001, Australia 2Centre for Astrophysics Research, University of Hertfordshire, College Lane, Hatfield, Herts AL10 9AB, UK
3Milne Centre for Astrophysics, University of Hull, Cottingham Road, Kingston-upon-Hull HU6 7RX, UK
4School of Physics, Monash University, Clayton, VIC 3800, Australia
5Monash Centre for Astrophysics (MoCA), Monash University, Clayton, VIC 3800, Australia
6Centre for Astrophysics and Supercomputing, Swinburne University of Technology, PO Box 218, Hawthorn, VIC 3122, Australia
7Department of Physics and Astronomy, Macquarie University, NSW 2109, Australia
8Australian Astronomical Observatory, PO Box 915, North Ryde, NSW 1670, Australia
Accepted 2017 November 20. Received 2017 November 16; in original form 2017 May 8
A B S T R A C T
We model the triggering of active galactic nuclei (AGN) in galaxy clusters using the semi-analytic galaxy formation model SAGE. We prescribe triggering methods based on the ram pressure galaxies experience as they move throughout the intracluster medium, which is hypothesized to trigger star formation and AGN activity. The clustercentric radius and velocity distribution of the simulated active galaxies produced by these models are compared with those of AGN and galaxies with intense star formation from a sample of low-redshift relaxed clusters from the Sloan Digital Sky Survey. The ram pressure triggering model that best explains the clustercentric radius and velocity distribution of these observed galaxies has AGN and star formation triggered if 2.5×10⁻¹⁴Pa<P
ram <2.5×10⁻¹³Pa andPram>2Pinternal; this is consistent with expectations from hydrodynamical simulations of ram-pressure-induced star formation. Our results show that ram pressure is likely to be an important mechanism for triggering star formation and AGN activity in clusters.
Key words: galaxies: active – galaxies: clusters: general – galaxies: evolution – galaxies: for-mation.
1 I N T R O D U C T I O N
Recent decades have brought recognition of the important role active galactic nuclei (AGN) play in regulating the cosmic star formation histories of their host galaxies and larger scale environments (e.g. Boehringer et al.1993; Silk & Rees1998; Bower et al.2006; Croton et al.2006; Vogelsberger et al.2014; see Fabian2012; Heckman & Best2014, for reviews). Whilst a consensus on the existence of a relationship between AGN presence and host galaxy environment is yet to be reached, the majority of the current evidence seems to suggest that the presence of AGN has a strong environmental dependence, with factors such as the local galaxy density and one-on-one interactions highly influencing the likelihood of a galaxy hosting an AGN (Sabater, Best & Argudo-Fern´andez2013). AGN are powered by the accretion of gas on to the supermassive black holes that reside at the centres of most galaxies. For this to occur, there must be an abundant supply of gas in the central regions of the galaxy (e.g. Reichard et al.2009). The environmental
E-mail:[email protected]
dence of AGN activity is a consequence of this requirement, with the availability of gas dependent on environmental effects; for ex-ample, ram pressure stripping in the inner regions of clusters may deplete a galaxy’s gas supply, whilst galaxy mergers may inject a new supply of gas to the galaxy.
AGN and star formation are triggered by processes which in-crease the supply of gas to the centres of galaxies. For example, mergers and interactions of galaxies are expected to induce AGN activity, since they provide a torque on the gas which can fun-nel it into the centre of the galaxy (Hernquist & Mihos 1995). This is supported by observations, with an observed increase in the prevalence of AGN in interacting galaxy pairs (Ellison et al.2011; Sabater et al.2013) and ‘lopsided’ galaxies (Reichard et al.2009), which are indicative of galaxy interactions. Observations and sim-ulations show that mergers also trigger episodes of star formation (e.g. Doyon, Joseph & Wright1994; Mihos & Hernquist1996), with an AGN preceded by a starburst a common evolutionary sequence during gas-rich mergers (Hopkins et al.2006; Melnick et al.2015). Alongside galaxy mergers, the ram pressure that cluster galaxies experience as they move through the intracluster medium (ICM) may induce AGN and star formation. This pressure is able to strip gas from galaxies (ram pressure stripping), which may cause tails of stripped gas to form behind the galaxy as it moves in the clus-ter, as has been observed for galaxies in the Virgo cluster (e.g. Kenney, van Gorkom & Vollmer2004; Crowl et al.2005; Chung et al. 2007). Ram pressure stripping leads to a decreased preva-lence of radiative-mode AGN activity in the centres of clusters (Ellison et al.2011; Ehlert et al.2014; Khabiboulline et al.2014), since the ram pressure has depleted the gas supply of these central galaxies. However, models and hydrodynamical simulations show that lower ram pressures can compress the gas in the galaxy, and actually induce star formation (e.g. Fujita & Nagashima1999; Kro-nberger et al.2008; Kapferer et al.2009; Tonnesen & Bryan2009; Bekki 2014), which is also supported by observations (e.g. Lee et al.2017). These moderate ram pressures could also conceivably lead to higher black hole accretion, and hence trigger AGN activity, since ram pressure can lead to angular momentum loss in gas clouds (Tonnesen & Bryan2009) and trigger gravitational instability in the galactic disc (Schulz & Struck2001), potentially leading to gas be-ing deposited into the galaxy centre. Additional processes such as frequent high-speed galaxy encounters (galaxy harassment; Moore et al.1996) and tidal interactions between the galaxy and the cluster potential (Byrd & Valtonen1990) may also induce gas flows to the centre of a galaxy, triggering AGN.
Ram-pressure- and merger-induced AGN activity are dependent on the galaxy’s location within the cluster. Hence, studies of the lo-cation of AGN in clusters are important for determining the mecha-nism by which they are triggered. Pimbblet et al. (2013) considered a sample of emission-line AGN in six relaxed clusters from the Sloan Digital Sky Survey (SDSS) in 0.070 < z < 0.089. They found that the radial AGN fraction increases steeply in the central 1.5 virial radii (rvir) of clusters, but flattens off quickly and even decreases beyond this radius. Ruderman & Ebeling (2005) studied X-ray AGN in 24 virialized clusters in 0.3<z<0.7 and found a radial AGN density profile with a pronounced peak in the centre (r<0.5 Mpc), with a secondary broad peak at approximately the virial radius (2–3 Mpc). They attribute the central spike to close encounters between infalling galaxies and the giant cD-type ellip-tical galaxy at the cluster centre, and suggest that the secondary peak at the viral radius is due to an increase of galaxy mergers in these regions. A similar result is found by Ehlert et al. (2013) who investigated 43 of the most massive and X-ray luminous clusters in 0.2<z<0.7; they found an excess of X-ray AGN in the cluster centres, and a secondary excess at around the viral radius. Pentericci et al. (2013) found that moderately luminous X-ray AGN are found in the outer regions of clusters atz∼ 0.5–1.1 relative to normal galaxies, but have the same velocity distribution.
Pimbblet et al. (2013) found that the most powerful AGN re-side in the cluster infall regions. Haines et al. (2012) also reach the same conclusion for X-ray and optical AGN; these were found to have a higher velocity dispersion in comparison to the general clus-ter population and avoid the phase space with low relative velocities and clustercentric radii. In addition, Martini et al. (2002) found a higher mean velocity offset for X-ray AGN in a massive cluster A2104 (z=0.154) than for other cluster members, suggesting that some of the AGN may be falling into the cluster. These studies suggest that AGN are triggered by some mechanism which acts on galaxies during their infall, producing AGN around the virial radius of the cluster; this provides a vital clue as to how cluster AGN are triggered. Comparing expectations of the various hypoth-esized triggering methods to such observational samples may give an important insight into the triggering mechanisms of AGN in clusters. Similar analyses for star-forming galaxies are more com-plicated, due to the difficulty in separating induced and secular star formation activity.
In this paper, we test the relationship between AGN activity and the location of cluster galaxies in the position–velocity phase space. In particular, we test the hypothesis that ram pressure effects on satellite (i.e. not cluster-central) galaxies can trigger galaxy ac-tivity, by simulating ram pressure triggering on model galaxies and comparing the spatial distribution of the resulting active galaxies to observations. This paper is organized as follows. In Section 2, we outline the semi-analytic model used to simulate the evolution of cluster galaxies, and detail the method used for triggering AGN. The model is validated in Section 3 with a comparison to the Pimb-blet et al. (2013) observations, with predictions of the model and a comparison with additional data sets given in Section 4. The impli-cations of these results are discussed in Section 5, before concluding in Section 6. Throughout this paper we assumeh=0.73,m=0.25
and=0.75.
2 AG N T R I G G E R I N G I N A S E M I - A N A LY T I C G A L A X Y E VO L U T I O N M O D E L
2.1 Model galaxies
2.1.1 Semi-Analytic Galaxy Evolution Model
The Semi-Analytic Galaxy Evolution model, or SAGE, originally introduced in Croton et al. (2006) and updated in Croton et al. (2016), models galaxy formation and evolution in a cosmological context. SAGE analytically models the baryonic physics involved in galaxy formation and evolution, such as gas infall and cooling, star formation, black hole growth, AGN and supernova feedback, and reionization. To do so, semi-analytic models are implemented on the output of anN-body cosmological simulation of dark mat-ter, with the baryons added in post-processing. The Croton et al. (2016) version of SAGE can be run on a number ofN-body simu-lations, however we implement the model based on the Millennium Simulation (Springel et al.2005). This simulation contains 21603
particles with a particle mass of 8.6×10⁸h−1M
in a periodic box of (500h−1Mpc)3. Dark matter haloes within the simulation
SAGE uses the properties of each dark matter halo and subhalo in the simulation at 64 discrete redshift snapshots fromz =127 toz=0. We consider only the lowest redshift snapshots for the majority of our analysis. Properties of each galaxy given by the semi-analytic model at each snapshot include its total stellar mass, the stellar mass of the bulge, black hole mass, cold gas mass, hot gas mass and disc scale radius, alongside its position and velocity in the three dimensions of the simulation box. The properties of each cluster/dark matter halo include its virial mass and radius, with an identification system such that all cluster members can be easily identified. Galaxies can be followed from one redshift slice to another using their unique galaxy IDs.
2.1.2 Post-processing
The density profile of the ICM for each cluster is approximated using cluster density profiles determined fromChandraX-ray observa-tions (Fujita, Sarazin & Sivakoff2006; Vikhlinin et al.2006). If the virial mass and radius of the simulated cluster are within 20 per cent of those of clusters observed by Fujita et al. (2006) or Vikhlinin et al. (2006), the observed density profile for the closest matching cluster is used. Otherwise, the cluster is given the average density profile of the Vikhlinin et al. (2006) clusters withT>2.5 keV or
T<2.5 keV, dependent on the virial temperature of the simulated cluster. From the interpolated SAGE positions and velocities, the ram pressurePram = ρICMv2 for each galaxy is calculated using
its velocity with respect to the cluster and the ICM density at its distance from the cluster centre, as given from the assumed density profile.
The internal pressure of each cluster galaxy is calculated by as-suming pressure equilibrium with the surrounding ICM, which is taken to be at the virial temperature. These thermal pressures de-pend only on the galaxy’s distance from the cluster centre and the properties of the cluster, in contrast to the commonly implemented Blitz & Rosolowsky (2004) scaling relation, which instead con-siders the galaxy’s stellar mass, gas mass and radius. The thermal pressures for the galaxies considered here, which span a range of roughly five orders of magnitude, are on average 1.2+−01..91dex smaller
than the pressures calculated using the Blitz & Rosolowsky (2004) scaling relation with parameters as typically observed in galaxies; the Blitz & Rosolowsky (2004) relation relies on information such as the disc scale height, gas velocity dispersion and stellar and gas disc surface density profiles, that are unknown for our simulated galaxies. The larger Blitz & Rosolowsky (2004) internal pressures give lower ratios of the ram pressure to the internal pressure for each galaxy; the threshold pressure ratio for AGN triggering that we determine would be lower if we used these internal pressures, however the absolute ram pressure triggering range we determine would be unaffected.
2.2 AGN triggering
In this section, we describe our prescriptions for AGN triggering.
2.2.1 Ram pressure
[image:3.595.311.548.56.309.2]We trigger AGN based on the ram pressure acting upon each galaxy. Hydrodynamical simulations such as those by Kronberger et al. (2008), Kapferer et al. (2009) and Tonnesen & Bryan (2009) have shown that ram pressure can cause an increase in star formation in a galaxy, or can strip the gas from the galaxy, depending on the amount of ram pressure the galaxy experiences. We assume that ram
Figure 1. Ram pressure versus pressure ratio for each of the Kron-berger et al. (2008), Kapferer et al. (2009) and Tonnesen & Bryan (2009) simulations and the semi-analytic galaxies in our SAGE sam-ple. SAGE galaxies are colour-coded by their distance from the clus-ter centre. Labelled are the simulations which found an increase in star formation (black) and those that resulted in ram pressure stripping (white). From these simulations we determine a best-estimate range of triggering ram pressures of 2.5 × 10⁻¹⁴Pa Pram 2.5 × 10⁻¹³
Pa (outlined by dashed lines), corresponding to the medium triggering pres-sure range considered in our model. Note that the size of the points for the Kapferer et al. (2009) galaxies are smaller than the symbols for the Kronberger et al. (2008) and Tonnesen & Bryan (2009) galaxies; this is to reflect that the Kapferer et al. (2009) simulated galaxies are>0.5 dex less massive than the other simulated galaxies. With a mass of 2×10¹⁰M
, these simulated galaxies are in fact below the mass cut used by Pimbblet et al. (2013), which we adopt for our SAGE galaxies here, and hence we only show these simulated galaxies here for comparison.
pressures which cause an increase in star formation can trigger AGN activity. The ram pressures and ratios of ram pressure to in-ternal pressure of galaxies considered in these simulations are shown in Fig. 1, with simulations resulting in increased star formation and those which cause ram pressure stripping distin-guished. Fig. 1 clearly shows that above ram pressures of ap-proximately 2.5×10⁻¹³ Pa, galaxies undergo ram pressure
strip-ping, whilst below this critical value the star formation in the galaxy can be increased by the ram pressure. Note that simu-lated SAGE galaxies with low clustercentric radii are less fre-quently found at ram pressures below 10−14 Pa, with those that
exist in the simulation having low pressure ratios; galaxies with these low ram pressures are unlikely to have ram-pressure induced star formation. Therefore, taking a best-estimate range of trigger-ing ram pressures that spans an order of magnitude, we expect that ram pressure is most likely to cause an increase in star for-mation and therefore AGN activity if 2.5×10⁻¹⁴Pa Pram
2.5×10⁻¹³Pa. Guided by this expectation, we explore three
trig-gering ram pressure ranges: 2.5×10⁻¹⁵Pa<Pram<2.5×10⁻¹⁴ Pa (Low), 2.5×10⁻¹⁴Pa<Pram<2.5×10⁻¹³Pa (Medium) and
2.2.2 Pressure ratio
In addition to the variations of the triggering ram pressures, we also consider the ratio of the ram pressure to the internal pressure of the galaxy when triggering the simulated AGN. Fig. 1shows that the pressure ratio is unimportant when determining whether a galaxy undergoes ram pressure stripping in the hydrodynamic simulations. Nevertheless, our physical intuition tells us that the ram pressure must at least be comparable to the internal pressure in the galaxy to have an effect. If the ram pressure is small relative to the internal pressure, then the galaxy would not be expected to undergo a significant change in response to the ram pressure, even if its magnitude is in the triggering range. We therefore consider lower limits on the pressure ratios that can trigger AGN, heuristically chosen to be Pram
Pinternal =0, 1 or 2, in the absence of evidence for strong differences in this regard within the parameter range explored.
2.2.3 AGN luminosity model and time delay
The luminosities of the triggered AGN are not directly attainable from the simulations without making significant assumptions. To estimate the simulated AGN luminosities, we assume that the ratio of bolometric to Eddington luminosityLBol/LEdd=0.11and use the
known black hole mass to convert this to a value in L.
Studies such as Schawinski et al. (2007), Wild et al. (2010), Shabala et al. (2012), Krause (2005) and Melnick et al. (2015) suggest that star formation and AGN activity may be caused by a common mechanism, with a substantial delay between the star-burst and the onset of the AGN activity, of roughly 250 Myr. We investigate the effect of such a time delay on the resulting AGN dis-tribution. We consider the case of no time delay, in which AGN are triggered instantaneously if the ram pressure satisfies the trigger-ing conditions, and a time delay of 250 Myr, in which the galaxy’s properties 250 Myr ago are used to determine whether an AGN is triggered atz=0. Since no SAGE snapshot at a lookback time of 250 Myr ago exists, to determine the galaxy properties at this time we consider the five lowest redshift snapshots, atz=0.000, 0.020, 0.041, 0.064 and 0.089 (corresponding to lookback times of 0, 277, 560, 860 and 1175 Myr, respectively), and interpolate the positions and velocities in intervals of approximately 3 Myr.
3 M O D E L VA L I DAT I O N
3.1 Validation sample
3.1.1 The Pimbblet et al. (2013) sample
To assess the validity of ram pressure triggering of AGN and star formation, the simulated active galaxies are compared with AGN and galaxies with intense star formation from the Pimbblet et al. (2013) observational sample. This is a sample of six clusters in 0.070<z<0.089 observed in the SDSS that have no observable signs of merging or significant interactions with other clusters or subclusters. Such interactions may cause a local enhancement in AGN activity, complicating studies of the effects of the general cluster environment on AGN activity; the Pimbblet et al. (2013) sample of relaxed clusters is therefore ideal for this work (see Sec-tion 5.2). Of the galaxies targeted by the SDSS in these clusters,
1A ratio ofL
Bol/LEdd=0.1 is reasonable for radiative-mode AGN, and is
within 1σof the medianLBol/LEddfraction for the observed sample.
only galaxies with log M∗
M >10.4 and brighter thanMr= −19.96
are considered for completeness.
The Pimbblet et al. (2013) study considered only AGN and not star-forming galaxies. Pimbblet et al. (2013) select emission-line AGN using the commonly used BPT diagnostic (Baldwin, Phillips & Terlevich1981); these use the ratios of [NII]λ6583/Hα
and [OIII]λ5007/Hβto differentiate galaxies in which
photoioniza-tion is caused by hot O and B stars (star-forming galaxies) and those in which photoionization is caused by a non-thermal source, for example, AGN activity (Veilleux & Osterbrock1987). To be selected as an AGN, Pimbblet et al. (2013) required galaxies to have a signal-to-noise ratio (SNR) of greater than 3 in each of the [OIII]λ5007, [NII]λ6583, Hα and Hβ lines, and lie above the
Kauffmann et al. (2003) demarcation curve – an empirically de-termined classification for distinguishing AGN from star-forming galaxies. Galaxies above this curve are classified into three types dependent on their location in the BPT plane: Seyferts, low-ionization nuclear emission-line regions (LINERs) and transition objects (which lie between the Kauffmann et al.2003and Kewley et al.2001demarcation curves on the BPT diagram), all of which are included in the Pimbblet et al. (2013) AGN sample.
We also consider galaxies in the Pimbblet et al. (2013) sample which have star formation that is significantly greater than typical secular star formation, as given by the star formation main sequence – ‘intense star-formers’ (Section 3.1.3). We consider star-forming galaxies because we hypothesize that ram pressure can trigger both star formation and AGN activity, since the two processes are closely linked.
3.1.2 Observational selection of AGN
In order to be confident in the emission-line AGN sample selected from this data, alongside the Kauffmann et al. (2003) and signal-to-noise criteria implemented by Pimbblet et al. (2013) we impose additional, stricter criteria for AGN selection.
LINERs have ionization signatures that can be produced by low-level AGN activity, however, these can also be produced by cool-ing flows or shock-heated gas (e.g. Heckman1987; Kauffmann et al.2003), or by galaxies which have stopped forming stars, with the ionization produced by hot post-AGB stars and white dwarfs (Stasi´nska et al.2008). Therefore, LINERs are not a pure AGN population, unlike Seyfert galaxies. In order to distinguish the pop-ulation of LINERs that host AGN from those galaxies which have stopped forming stars, or ‘retired galaxies’, only galaxies with Hα equivalent widths (WHα) of magnitude greater than 3 Å are selected as AGN; this is the condition for non-retired galaxies prescribed by theWHα versus [NII]/Hα(WHAN) diagnostic (Cid Fernandes et al.2011).
Figure 2. BPT diagram for the Pimbblet et al. (2013) galaxies with SNR>3 in each of the four emission lines and with mass greater than 1010.4M
. Point colours represent Hαequivalent widths and sizes rep-resent log (LBol/LEdd), with the largest points corresponding to the largest
LBol/LEdd values. AGN (black circles) are those galaxies which satisfy:
|WHα|>3 Å (yellow-green points),LBol/LEdd>0.01 (large points), lie
above the Kauffmann et al. (2003) demarcation curve (dashed curve) and are closer to the Kewley et al. (2001) demarcation curve (dot–dashed curve) than to the Kauffmann et al. (2003) curve.
ratio of bolometric to Eddington luminosity LBol/LEdd > 0.01;2
this removes jet-mode AGN from the AGN sample. Fig.2shows the variation of Hαequivalent widths andLBol/LEddratios of the Pimbblet et al. (2013) sample across the BPT diagram.
The resulting AGN sample contains seven transition objects that lie significantly closer to the Kauffmann et al. (2003) demarcation curve than to the Kewley et al. (2001) demarcation curve. Since these are likely to be intense star-formers and not AGN, we ex-clude these galaxies from the AGN sample. Four of these transition objects are classified as intense star-formers as defined in Sec-tion 3.1.3. Including the addiSec-tional three transiSec-tion objects in the composite AGN/star-former sample has no effect on the results. Our final AGN sample contains 18 galaxies, shown on the BPT diagram in Fig.2. The galaxies hosting these AGN have observed [OIII] luminosities ranging from 106.3 to 108.6L, corresponding
to bolometric luminosities of roughly 1010–1012L
using the con-version of Heckman et al. (2004). We do not attempt to match this observed luminosity distribution when selecting the simulated AGN sample; however, the AGN luminosities of the two samples are con-sistent: the luminosities of the simulated AGN from the best-fitting ram pressure model (see Section 3.2.1) range from 109to 1012L
, with the majority between 1010and 1012L
.
2The black hole mass used to calculate the Eddington luminosity is
esti-mated via a black hole – bulge mass relation (H¨aring & Rix2004), with the bulge mass estimated using the galaxy’s total stellar mass and its bulge fraction and then converted to a black hole mass.
Figure 3. sSFR against stellar mass for the Pimbblet et al. (2013) galaxies with SNR>3 in each of the four emission lines and with mass greater than 1010.4M
. Point colours show the BPT classification of each galaxy. Intense star-formers (black circles) have sSFRs above the expected sSFR (black curve) by>1.5σ.
3.1.3 Selection of galaxies with intense star formation
In addition to selecting a sample of AGN, we also consider galax-ies with intense star formation. A connection between starburst galaxies and AGN is theoretically expected, with hydrodynamical simulations showing that gas inflows which produce a burst of star formation can also fuel the central black hole to power an AGN (e.g. Di Matteo, Springel & Hernquist2005; Hopkins et al.2006). Ob-servations investigating the relation between a galaxy’s recent star formation history and AGN activity support this hypothesis (e.g. Wild et al.2007); in other words, intense star-formers and AGN can be caused by the same mechanism.
We consider theM∗– specific star formation rate (sSFR) relation determined from a sample of∼50 000 optically selected galaxies in the local Universe (z≈0.1) which range from gas-rich dwarfs to massive ellipticals:
sSFR=sSFR0
M∗
M0 α+1
exp
−
M∗
M0 α+1
, (1)
where sSFR0=5.96×10⁻¹¹yr−1, logM0=11.03 andα= −1.35
[image:5.595.319.537.55.323.2]Figure 4. The spatial distribution of the observed galaxies in each of the six clusters considered by Pimbblet et al. (2013). The points are coloured by the velocity of each galaxy, enabling substructures of galaxies with coherent velocities to be visually identified. Galaxies from the AGN and intense star-former samples that are identified as belonging to substructure by the test discussed in the text are clearly distinguished.
3.1.4 Interactions and substructure identification
In our model, we consider AGN and star formation which are trig-gered due to an interaction with the ICM. Hence, for our purposes, observed AGN and intense star-formers that may be explained by galaxy interactions are not relevant. Active galaxies that are part of substructure may be caused by local effects due to the proxim-ity of galaxies within the substructure and increased gas densproxim-ity, with gravitational interactions, mergers and ram pressure stripping more common; this is discussed further in Section 5.2. Hence, ac-tive galaxies in substructure are not relevant for the present study. We therefore consider each of the galaxies in the AGN and in-tense star-former samples to determine whether they are under-going interactions or are incorporated in substructure within the cluster.
To identify interacting galaxies, SDSS images (SDSS Collabo-ration et al. 2016) of each AGN and star-forming galaxy are exam-ined. Galaxies that appear significantly disturbed and have a clear interacting partner (e.g. tidal tails, shells or bridges are clearly iden-tifiable) are classified as ‘pair’ galaxies, with AGN activity or star formation attributed to the interaction. Galaxies that appear signifi-cantly disturbed but have no detected nearby companion are likely to be post-mergers, and are also included in this ‘interacting’ or ‘pair’ galaxy classification.
To identify substructure, we search for galaxies around which there is an overdensity of galaxies with a coherent velocity struc-ture (see Fig. 4). To quantify the level of substructure, first the velocity dispersion of each AGN/star-forming galaxy and its 10 nearest neighbours is calculated. We then calculate the velocity
dis-persion of the AGN/star-forming galaxy and 10 other galaxies in the cluster which lie within the same range of clustercentric radii as the AGN/star-forming galaxy and its 10 nearest neighbours. This is repeated for 1000 groups of 10 galaxies to give a measure of the median and typical spread in the velocity dispersions of galaxies at those clustercentric radii. We then compare the velocity dispersion of the AGN/star-forming galaxy and its 10 nearest neighbours to the median measure. If the velocity dispersion of the neighbours is sig-nificantly (>2σ) less than the median, then the AGN/star-forming galaxy is classified as part of a substructure.
Of the 31 AGN/star-forming galaxies in the original sample, 10 are identified as ‘interacting’ or ‘pair’ galaxies and 6 are classified as part of a substructure, including 3 within both categories. Removing AGN/star-forming galaxies affected by interactions or substructure effects results in a final AGN/star-forming galaxy sample containing 18 galaxies. Their locations in phase space are shown in Fig.5.
3.1.5 Matching the simulated sample to the observations
The sample of SAGE galaxies considered in this study is cho-sen to match the Pimbblet et al. (2013) observational sample. We select SAGE clusters with virial radii between 20 per cent less than the smallest and 20 per cent larger than the largest of the Pimbblet et al. (2013) clusters, i.e. those with 1.25 <
rvir/Mpc<2.41. This results in a sample containing clusters with 2.2×10¹⁴<Mvir/M
<1.6×10¹⁵and 500< σ
v/kms−1<1150. In addition, only galaxies in these clusters withM∗> 1010.4M
Figure 5. Phase-space diagrams of the simulated AGN produced under various ram pressure triggering models, with the simulated sample matched in radial and mass distributions to the Pimbblet et al. (2013) sample. The left column shows changing ram pressure threshold, with constant pressure ratio threshold of 0. The right column shows changing ram pressure threshold, with constant pressure ratio threshold of 2. Triggering ram pressure ranges are 2.5×10⁻¹⁵Pa<P
ram<2.5×10⁻¹⁴Pa (Low), 2.5×10⁻¹⁴Pa<Pram<2.5×10⁻¹³Pa (Medium) and 2.5×10⁻¹³Pa<Pram<2.5×10⁻¹²Pa (High).
Contours show the number density of simulated AGN at levels of 20, 40, 60 and 80 per cent of the peak number density, with the individual AGN also plotted. Superimposed are the AGN and intense star-formers from the observational sample, with galaxies associated with interactions or substructure indicated. The model which best describes the observations is the 2.5×10⁻¹⁴Pa<Pram<2.5×10⁻¹³Pa,Pram/Pinternal>2 model (middle right panel). Lower triggering
ram pressures (top panels) produce AGN at larger radii, whilst higher triggering ram pressures (bottom panels) produce AGN at clustercentric radii that are too small to match observations. In comparison to thePram/Pinternal>0 models (left-hand panels), thePram/Pinternal>2 models (right-hand panels) lead to less
AGN at small radii for a constant triggering ram pressure range.
et al. (2013) to ensure completeness. Finally, only galaxies at radii less than 3rvirare considered; this excludes galaxies in the cluster outskirts so that all satellites are robustly associated with the clus-ter. This results in a sample containing 33 931 galaxies from 963 clusters.
We calculate the projected locations and velocities of our simu-lated galaxies, in order to draw direct comparisons with observa-tional data. In the simulation cube, galaxies are viewed in projection along each of thex,yandzaxes.
3.2 Location of AGN and star-forming galaxies
In the following sections, all analysis is completed with thez=0 snapshot of SAGE, unless otherwise specified.
3.2.1 Ram pressure models
We trigger our simulated galaxies as AGN under multiple triggering ram pressure and pressure ratio conditions, with the phase-space distributions of AGN produced by various combinations of these shown in Fig.5. These are without the effect of a time delay between the onset of enhanced star formation and AGN activity, which is discussed in detail in Section 3.2.2 below. These simulated galaxies have radial and mass distributions matched with the Pimbblet et al. (2013) sample.
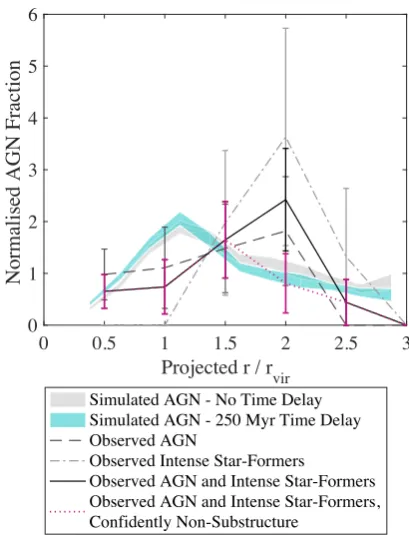
The simulated AGN in the model with triggering ram pressures of 2.5×10⁻¹⁴Pa<Pram<2.5×10⁻¹³Pa andPram/Pinternal>2 are clearly seen to fit the observations best (Fig.5, middle right panel). This best-fitting ram pressure range is consistent with expectations from hydrodynamical simulations discussed in Section 2.2.1. Lower triggering ram pressures give AGN at clustercentric radii that are too large, regardless of the triggering pressure ratios, whilst the opposite is true for high triggering ram pressures, with AGN produced at low clustercentric radii between 0 and 1rvir. Adjusting the model to allow galaxies with lower pressure ratios to become AGN results in more AGN at low radii, regardless of the triggering ram pressures. The changes in velocity distribution with triggering model are secondary to the changes in the radial distribution. For lower pres-sure ratio thresholds and fixed triggering ram prespres-sures, the AGN are found at lower projected velocities. The AGN are also found at lower projected velocities for models with lower triggering ram pressures, with a fixed pressure ratio threshold. All models have a velocity distribution that is roughly consistent with the observations. Fig.6shows the AGN fraction as a function of clustercentric radius for the simulated AGN from our best-fitting ram pressure model, alongside the fraction of AGN and intense star-formers (both individually and combined) in the observed sample. Note that the AGN fractions are normalized to the overall fraction of the sample over all radii and velocities to allow for a simple comparison. This figure shows that our model predicts a peak in the AGN fraction at lower clustercentric radii (∼1rvir) than the observed sample (∼2rvir). Modifying the model slightly would likely lead to a better match to the observations; for example, including slightly lower ram pres-sures would increase the number of simulated AGN at larger radii. However, the statistical significance of the discrepancy between the two samples is negligible; the model and observations are consistent within the errors, which are large due to the small sample size of the observations. Fig.6also shows that the observed intense star-former fraction is found to decrease with clustercentric more rapidly than the observed AGN fraction. The differing radial distributions of the observed intense star-former and AGN samples suggest that AGN and star formation are subject to somewhat different mechanisms; a larger observational sample is needed to confirm this.
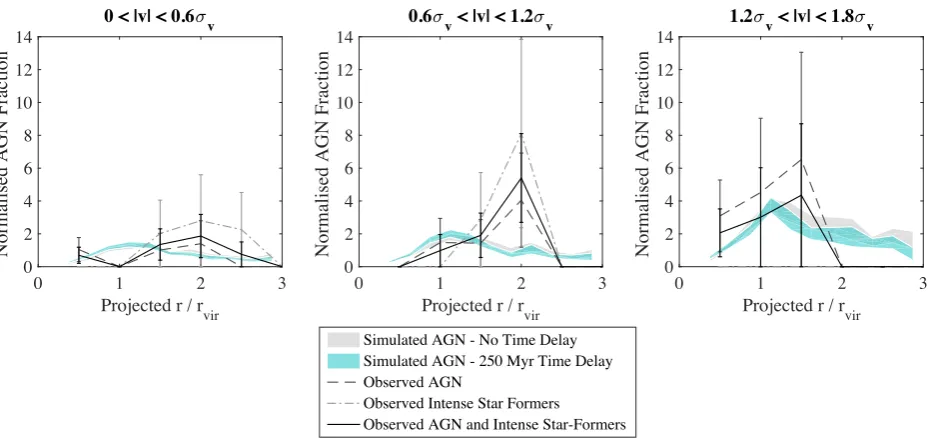
Fig.7also shows the AGNs fraction as a function of cluster-centric radius for the simulated AGN from our best-fitting ram pres-sure model and the observations, split into three velocity bins. This figure shows that the ram pressure triggering prescription predicts that for 0<v<0.6σvand 0.6σv<v<1.2σvthe AGN fraction peaks at lower radii than the observed peak (∼1rvircompared with
∼2rvir). For 1.2σv< v<1.8σv, the ram pressure triggering pre-scription predicts a peak in the correct clustercentric radius range (∼1–2rvir). The most significant difference between the
observa-Figure 6. The AGN fraction as a function of clustercentric radius for the simulated AGN from the best ram pressure model (middle right panel of Fig.5), alongside the fraction of AGN and intense star-formers (both in-dividually and combined) in the observed sample, with the AGN fractions normalized to the overall fraction of the sample. The fraction of simulated AGN from models with no time delay and a 250 Myr time delay are both shown, with no significant differences found between the two. Radial bins for the observational sample are 0–0.75rvir, 0.75–1.25rvir, 1.25–1.75rvir,
1.75–2.25rvir, 2.25–2.75rvirand>2.75rvir, whilst those for the simulated
sample are finer: 0–0.5rvir, 0.5–0.75rvir, 0.75–1rvir, 1–1.25rvir, 1.25–1.5rvir,
1.5–1.75rvir, 1.75–2rvir, 2–2.25rvir, 2.25–2.5rvir, 2.5–2.75rvirand>2.75rvir.
Error bars are Poisson. Interacting galaxies and those associated with sub-structure are not included in the observational fractions quoted. We also exclude the observed AGN and intense star-formers that (via visual inspec-tion of Fig.4) may be part of substructure but have not been identified via the selection criteria, and plot the curve for AGN and intense star-formers that we are confident are neither in substructure nor interacting.
[image:8.595.322.527.54.322.2]Figure 7. The AGN fraction as a function of clustercentric radius in velocity bins for the simulated AGN from the best ram pressure model (middle right panel of Fig.5), alongside the fraction of AGN and intense star-formers (both individually and combined) in the observed sample, with the AGN fractions normalized to the overall fraction of the sample. The fraction of simulated AGN from models with no time delay and a 250 Myr time delay are both shown, with no significant differences found between the two. Radial bins for the observational sample are 0–0.75rvir, 0.75–1.25rvir, 1.25–1.75rvir, 1.75–2.25rvir,
2.25–2.75rvirand>2.75rvir, whilst those for the simulated sample are finer: 0–0.5rvir, 0.5–0.75rvir, 0.75–1rvir, 1–1.25rvir, 1.25–1.5rvir, 1.5–1.75rvir, 1.75–2rvir,
2–2.25rvir, 2.25–2.5rvir, 2.5–2.75rvirand>2.75rvir. Error bars are Poisson. Interacting galaxies and those associated with substructure are not included in the
observational fractions quoted. No intense star-formers from the observed sample have 1.2σv<v<1.8σv.
3.2.2 Time delay
Investigations of different time delays show that any reasonable (≤250 Myr) delay between the onset of star formation and AGN activity has an insignificant effect on the observed position and velocity distributions of the AGN populations, with phase-space AGN distributions for all ram pressure triggering methods (Fig.5) undergoing no significant changes when a time delay of 250 Myr is considered. This can be clearly seen in Figs6and7, which show that under the best-fitting ram pressure model the AGN fraction as a function of clustercentric radius, both for the full velocity range and in velocity bins, is not significantly different for the cases with no time delay and a time delay of 250 Myr. A direct prediction of our model is that, since AGN and star formation are both expected to be triggered by the same mechanism, but with different time delays, we expect the AGN and star-forming galaxy distributions to be similar; that is, AGN and star-forming galaxies should be found at similar locations in clusters.
3.2.3 AGN fraction
Determining the AGN fraction produced by the model is not straightforward; the fraction of AGN is a convolution of the fraction of galaxies in which AGN are actually triggered by the ram pressure mechanism with the lifetime of AGN. Our model is unable to esti-mate the AGN duty cycle, and so assumptions must be made for this based on other studies. The fraction of simulated galaxies which sat-isfy the best ram pressure triggering condition at thez=0 snapshot is 0.156, whilst the fraction of AGN in the observed sample is 0.010, excluding AGN undergoing mergers or in substructure. Likely, not every galactic nucleus will be activated at observable luminosities, quite possibly depending on the detailed distributions of gas and stars. These AGN will then have a certain duty cycle. It is beyond the scope of the present study to disentangle these processes, so we
just give a lower limit for the duty cycle; for consistency between the observed and simulated samples, the duty cycle must be larger than 6 per cent. Whilst it is difficult to make comparisons to other stud-ies with different mass selections and AGN triggering mechanisms, this estimate is consistent with the observations of Kauffmann et al. (2004) and Ellison et al. (2008).
4 G E N E R A L M O D E L P R E D I C T I O N S
4.1 Model prediction for a complete sample of galaxies
It is important to note that the distribution of AGN in the phase space as shown in Fig.5results from galaxies that have a distribution in clustercentric radius and mass that matches that of the Pimbblet et al. (2013) sample. In reality, galaxies do not follow such a distribution: SAGE predicts many more galaxies at small clustercentric radii than those in the Pimbblet et al. (2013) sample. This is most likely due to the requirement for targeted SDSS spectroscopy; that is, not all galaxies near the cluster centre are targeted by the observations. Fibre placement constraints make it difficult to observe all galaxies in dense regions such as cluster centres, with Yoon et al. (2008) estimating that the SDSS spectroscopic completeness can be as low as 65 per cent in the cores of rich clusters. Due to the size of the fibre plugs, the physical separation of SDSS fibre centres must be at least 55 arcsec (Blanton et al.2003), which corresponds to∼40 kpc at the median redshift (z =0.076) of the Pimbblet et al. (2013) cluster sample. A phase-space diagram of the AGN distribution for the simulated galaxies without this imposed distribution is given in Fig.8. This clearly shows a peak in AGN density at around the virial radius in projection, which is roughly uniformly spread across all projected velocities from 0 to 2σv.
Figure 8. Phase-space diagrams of the simulated AGN produced by the best-fitting ram pressure method, for all galaxies with log (M∗/M)>10.4. Black contours show the number density of simulated AGN at levels of 20, 40, 60 and 80 per cent of the peak number density, with the individual AGN shown as grey dots. Relative to the phase-space diagram for the simulated sample matched in radial and mass distributions to the Pimbblet et al. (2013) sample (middle right panel of Fig.5; blue contours), the simulated AGN are shifted to lower clustercentric radii, with approximately unchanged (relative to Fig.5) velocity distributions, due to the lack of selection effects against cluster core galaxies.
AGN excess at approximately the viral radius. Ruderman & Ebeling (2005) attributed this excess to an increased prevalence of gas-rich galaxy mergers that can induce AGN activity in this cluster–field transition region. The location of this excess is broadly consistent with the expectations of our ram pressure model, which also pre-dicts an increased AGN prevalence at roughly the viral radius. We compare the radial distribution of X-ray AGN from these studies with our z= 0 and 1 (see Section 4.2) model AGN samples in Fig.9. The X-ray AGN of Ehlert et al. (2013) and Ruderman & Ebeling (2005) show a slower decrease with radius, with a peak at the cluster centre and secondary peak at higher radii. The secondary peak in the Ehlert et al. (2013) sample is consistent with the loca-tion of the peak in the ram-pressure-triggered model AGN atz=0, whilst thez=1 model AGN peak at lower radii. The secondary peak in the Ruderman & Ebeling (2005) sample is at slightly larger radii than thez=0 model AGN peak, atr2.5 Mpc compared withr 1.75 for the model. Comprehensively comparing these data sets to our model is beyond the scope of this work; however, this basic comparison with unmatched samples shows that the ram pressure triggering model is at least broadly consistent with these observations.
4.2 Cosmological evolution
Our ram pressure triggering model can be applied to various sam-ples of simulated galaxies to make predictions of the location of observed AGN or ram-pressure-induced star-forming galaxies in such systems. For example, using additional snapshots at high red-shift in SAGE, this model can also be applied to high-redred-shift clus-ters. We consider galaxies withM∗ >1010.4M
in clusters with
Mvir>5×10¹³M
atz=1, and show the resulting phase-space distribution of AGN in Fig. 10. This shows a shift of AGN to
[image:10.595.53.276.57.256.2]Figure 9. The number or number density of AGN in each observational sample as a function of radius. The peak of each distribution is normalized to unity. The normalized AGN count of the modelled AGN in the redshift 0 and 1 samples previously described are also shown.
Figure 10. Phase-space diagrams of the simulated AGN for galaxy clusters at high (z=1; solid contours) and low redshift (z=0; dotted contours), withMvir>5×10¹³M. Contours show the number density of simulated
AGN at levels of 20, 40, 60 and 80 per cent of the peak number density.
slightly larger clustercentric radii compared toz∼ 0 to between roughly 1–2rvir. This is likely due to virial radii being smaller at higher redshift for a given virial mass. Note that pre-processing and galaxy–galaxy interactions will become more important at larger redshift, and so it is likely that the assumptions of relax-ation and mergers being insignificant contributors to the observed AGN and intense star-former populations may become invalid (see Section 5.2).
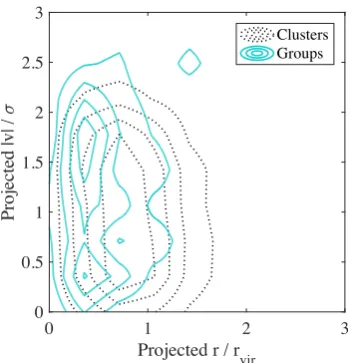
[image:10.595.339.513.350.530.2]Figure 11. Phase-space diagrams of the simulated AGN for galaxy groups atz=0, with 0.5×10¹³M
<Mvir<1.5×10¹³M, and galaxy clusters,
withMvir>5×10¹³M. Contours show the number density of simulated
AGN at levels of 20, 40, 60 and 80 per cent of the peak number density.
with comparable observations. AGN in the three clusters identified inz∼5.5–6.4 lie predominantly at radii less than 1rvir; these do not follow the expected distribution of our model, but individually are not at radii that are in conflict with the model results. It is also unclear whether this distribution is a result of selection effects.
Martini, Sivakoff & Mulchaey (2009) considered X-ray AGN in massive clusters at 0.4<z<1.3. These clusters are more massive than those in SAGE atz=1, which, alongside having no data for the general galaxy distribution in these clusters, makes a compre-hensive phase-space comparison between the model and this data set impossible. Instead, we plot the radial distribution of these AGN alongside our model AGN sample atz=1 in Fig.9. The model clearly reproduces the observed peak in the number of AGN at
r1 Mpc; the Martini et al. (2009) sample is in agreement with the ram pressure triggering model. Note that Fig.9shows a tentative trend of the AGN count peaking at lower radii for higher redshift clusters.
In our model, the AGN candidate fraction is found to increase with redshift from 15.6 per cent atz=0 to 23.3 per cent atz=1. This is qualitatively consistent with studies of AGN in clusters at redshifts up toz∼1.5, such as Eastman et al. (2007) and Galametz et al. (2009), which show that the cluster AGN fraction increases with redshift.
4.3 Galaxy groups
To consider galaxy groups, we take SAGE galaxies with M∗ > 1010.4M in groups with 0.5 × 10¹³M <
Mvir < 1.5 × 10¹³M
[image:11.595.339.520.58.245.2], and show the resulting phase-space distribution of AGN in such systems in Fig.11. This reveals a peak in expected AGN or star-forming activity at lower radii than for clusters, with most AGN having 0<r<1rvir. Since the gas density in groups is lower at a given distance from the centre than that of clusters, the ram pressure group galaxies experience at a given velocity will be lower, and so to lie in the ram pressure triggering range galaxies must lie closer to the group centre. We note that the density profile adopted in Fig.11comes from the average of cluster observations by Vikhlinin et al. (2006), and hence may not be strictly applicable.
Figure 12. Phase-space diagrams of the simulated AGN for galaxies with M∗>1010.4M
in groups with 12.7<logMvir/M<14.7 atz=1,
and with radial distribution matched to the distribution of general cluster galaxies in the Oh et al. (2014) sample. AGN from the Oh et al. (2014) observational sample are also plotted. Contours show the number density of simulated AGN at levels of 20, 40, 60 and 80 per cent of the peak number density.
Oh et al. (2014) considered X-ray AGN in galaxy groups at 0.5<z<1.1, and found them at lower radii (0.4rvir) than the general galaxy population. In order to compare this data set with our model predictions, we take galaxies in clusters of the same mass range (12.7 <logMvir/M < 14.5) in thez = 1 snapshot. We then match the radial distribution of the simulated sample to that of the observed group galaxies, which have radii less thanrvir. We implement a mass cut ofM∗>1010.4M
to the simulated galaxies as in the Pimbblet et al. (2013) sample, since stellar masses and thus a mass cut are not measured by Oh et al. (2014). The resulting AGN phase space distribution for the matched model galaxies is compared with the observed Oh et al. (2014) sample distribution in Fig.12. It can be seen that the observed AGN lie within the expected regions of phase-space by the ram pressure triggering model, with a slightly lower spread in velocities than predicted by the model; the ram pressure model is in reasonable agreement with the observed sample of groups at high redshift, providing further validation for the model. We note that the distribution of these high-redshift group AGN are not well described by either the low-redshift group sample or the high-redshift cluster samples shown in Figs10and11.
5 D I S C U S S I O N
5.1 Model predictions and implications
The model of ram pressure triggering where galax-ies are triggered as AGN or star-forming galaxies if 2.5×10⁻¹⁴Pa< Pram < 2.5×10⁻¹³ Pa andPram/Pinternal > 2
provides a good explanation of the observed distribution of AGN and intense star-formers in the radius–velocity phase space. This suggests that ram pressure might indeed act to compress the gas in a galaxy, leading to an increase in star formation and potentially inducing AGN activity.
high ram pressures (2.5×10⁻¹³Pa< Pram <2.5×10⁻¹² Pa),
such ram pressure stripping is expected to occur for galaxies at low clustercentric radii (<1rvir; see Fig.5); galaxies in the central regions of clusters are likely to undergo ram pressure stripping. This is qualitatively consistent with observational studies such as Wetzel, Tinker & Conroy (2012) which find that the fraction of quenched satellite galaxies increases with decreasing clustercentric radius; the Luo et al. (2016) ram pressure stripping model which strips gas from the outer radii of satellite galaxies wherePram>Pinternalalso produces this signature.
5.2 Complications and caveats
Several caveats are associated with our analysis. First, individual galaxy interactions are expected to (at least sometimes) trigger AGN, in addition to the ram pressure which acts on all cluster galaxies; galaxy interactions and mergers are commonly associ-ated with AGN triggering, with the AGN fraction of pair galaxies found to increase with decreasing galaxy separation (e.g. Woods & Geller2007; Ellison et al.2011). The AGN fraction of pair galaxies is found to increase by up to a factor of 2.5 for pairs with projected separations of less than 40h−1kpc (Ellison et al.2011). However,
less than 1 per cent of the simulated SAGE galaxies in our low-redshift sample at a given time have a neighbour within 40h−1kpc
and so are undergoing a merger that may trigger AGN activity. In comparison, over 10 per cent of galaxies at a given time have a ram pressure and pressure ratio in the best-fitting triggering pa-rameter range, as detailed in Section 3.2.1. Hence, too few mergers occur for this to be the dominant triggering mechanism for AGN in low-redshift clusters. This additional triggering mechanism can be ignored in our low-redshift simulations; however, this may not be the case at higher redshift where galaxy interactions are more common.
It is also important to note that our triggering models are inde-pendent of the galaxy’s gas properties. Galaxies triggered as AGN by our models are not required to have a given amount of gas; since an abundant supply of cold gas is necessary to fuel black holes and power AGN, a triggering condition that depends on the gas proper-ties of each galaxy may be more appropriate. The internal pressure assumed for each galaxy takes no account of the galaxy’s gas con-tent, whilst the Blitz & Rosolowsky (2004) pressure prescription does; if this were instead used, the triggering prescription would be more dependent on the gas properties of each galaxy. How-ever, the Blitz & Rosolowsky (2004) prescription requires detailed knowledge of the gas content, including velocity dispersions and radial distributions, and so would be difficult to implement without detailed hydrodynamical simulations. In addition, AGN properties such as luminosity may depend on the gas content of a galaxy; this could lead to an altered luminosity distribution of the simulated AGN.
Uncertainties arise in the temperature and density profiles as-sumed for each cluster, which leads to uncertainties in the ram pressure and internal pressure calculated for each galaxy. These uncertainties are expected to be less than the order of magnitude variations considered in the triggering ram pressures, however, and thus should not affect our results significantly. Uncertainties in tem-perature and density are expected to increase with radius, because at larger distances from the cluster centre they are harder to measure and substructure plays more of a role; this may cause our results to be less accurate at larger radii ( 2rvir). Since the density pro-files considered here are both smooth and spherically symmetric,
future work should consider density profiles that are more physi-cally reasonable; for example, density profiles from hydrodynami-cal cosmologihydrodynami-cal simulations would allow for a clumpy ICM, more representative of unrelaxed clusters.
An important feature of the Pimbblet et al. (2013) observations is that they are of low-redshift relaxed clusters; while this ram pres-sure triggering model reasonably predicts the AGN distribution of this sample, this is a very specific subset of the general cluster population. Unrelaxed clusters are those undergoing interactions with other clusters or subclusters. The galaxies in the cluster or subcluster can be pre-processed by their environment prior to their accretion into the primary cluster, due to gravitational interactions, mergers and ram pressure stripping (e.g. Fujita2004; Vijayaragha-van & Ricker 2013; Cybulski et al.2014). These pre-processed AGN complicate studies of the effects of the general cluster envi-ronment on AGN activity, hence the Pimbblet et al. (2013) sample of relaxed clusters is an ideal sample for determining the effects of the environment on AGN activity.
A final notable caveat is that filaments are observed in some of the Pimbblet et al. (2013) clusters (see Fig.4). AGN may be caused by pre-processing of groups in these filaments before they are accreted on to the cluster (see e.g. Porter et al.2008). This may cause AGN to lie preferentially along filaments, and although these should be identified by our substructure detection method, this could lead to an overestimate in the true amount of AGN caused by the general environment at larger radii where such filaments are found. In addition, few interloping galaxies/AGN may be present in the observations (see e.g. Pimbblet2011), which may have a minor effect on the results.
6 C O N C L U S I O N S
Hydrodynamical simulations of the effect of ram pressure on gas-rich galaxies suggest that below the regime of ram pressure stripping the enhanced pressure might lead to an elevated level of star forma-tion and the onset of AGN activity. We have tested this effect with a semi-analytic galaxy evolution model based on the Millennium simulation and compared it to an observational sample of galax-ies in low-redshift clusters. The phase-space propertgalax-ies of observed AGN populations are consistent with a triggering scenario for in-termediate ram pressures. The critical range corresponds to ram pressures expected around the virial radius in low-redshift galaxy clusters, and agrees with expectations from detailed hydrodynam-ical simulations. If AGN were triggered preferentially at high ram pressures, such as those considered relevant for ram pressure strip-ping, the model would predict an AGN population at significantly lower clustercentric radii than observed. We make predictions for high-redshift clusters and poor groups of galaxies, which are broadly consistent with observations.
Our analytical model is complementary to detailed cosmological hydrodynamic simulations (e.g. Vogelsberger et al. 2014; Crain et al.2015; Dav´e et al.2017; Kaviraj et al.2017), and may assist with interpretation of current and future observations, including with deep multiwavelength surveys of groups and clusters such as the Galaxy and Mass Assembly project (Driver et al.2013) and its successor 4MOST WAVES; and integral field surveys including SAMI (Croom et al.2012), CALIFA (S´anchez et al.2012) and MANGA (Bundy et al.2015).
to host an AGN, with six of the seven observed galaxies showing AGN signatures. Whilst this is a very small sample, it therefore seems likely that ram pressure can indeed trigger AGN activity, as predicted by our work.
AC K N OW L E D G E M E N T S
We thank the referee for their constructive comments that helped to improve the paper, and Andrew Cole and Simon Ellingsen for feedback on an earlier version of this work. MAM thanks the Uni-versity of Tasmania Foundation for Honours scholarships, and the faculty of Science, Engineering and Technology for a summer re-search scholarship. SSS and MGHK thank the Australian Rere-search Council for an Early Career Fellowship (DE130101399).
R E F E R E N C E S
Baldwin J. A., Phillips M. M., Terlevich R., 1981, PASP, 93, 5 Bekki K., 2014, MNRAS, 438, 444
Best P. N., Heckman T. M., 2012, MNRAS, 421, 1569
Best P. N., Kauffmann G., Heckman T. M., Brinchmann J., Charlot S., Ivezi´c ˇ
Z., White S. D. M., 2005, MNRAS, 362, 25
Blanton M. R., Lin H., Lupton R. H., Maley F. M., Young N., Zehavi I., Loveday J., 2003, AJ, 125, 2276
Blitz L., Rosolowsky E., 2004, ApJ, 612, L29
Boehringer H., Voges W., Fabian A. C., Edge A. C., Neumann D. M., 1993, MNRAS, 264, L25
Bower R. G., Benson A. J., Malbon R., Helly J. C., Frenk C. S., Baugh C. M., Cole S., Lacey C. G., 2006, MNRAS, 370, 645
Bundy K. et al., 2015, ApJ, 798, 7 Byrd G., Valtonen M., 1990, ApJ, 350, 89
Chung A., van Gorkom J. H., Kenney J. D. P., Vollmer B., 2007, ApJ, 659, L115
Cid Fernandes R., Stasi´nska G., Mateus A., Vale Asari N., 2011, MNRAS, 413, 1687
Crain R. A. et al., 2015, MNRAS, 450, 1937 Croom S. M. et al., 2012, MNRAS, 421, 872 Croton D. J. et al., 2006, MNRAS, 365, 11 Croton D. J. et al., 2016, ApJS, 222, 22
Crowl H. H., Kenney J. D. P., van Gorkom J. H., Vollmer B., 2005, AJ, 130, 65
Cybulski R., Yun M. S., Fazio G. G., Gutermuth R. A., 2014, MNRAS, 439, 3564
Daly R. A., 2016, MNRAS, 458, L24
Dav´e R., Rafieferantsoa M. H., Thompson R. J., Hopkins P. F., 2017, MNRAS, 467, 115
Di Matteo T., Springel V., Hernquist L., 2005, Nature, 433, 604 Diamond-Stanic A. M., Rieke G. H., 2012, ApJ, 746, 168 Doyon R., Joseph R. D., Wright G. S., 1994, ApJ, 421, 101
Driver S. P., Robotham A. S. G., Bland-Hawthorn J., Brown M., Hopkins A., Liske J., Phillipps S., Wilkins S., 2013, MNRAS, 430, 2622 Eastman J., Martini P., Sivakoff G., Kelson D. D., Mulchaey J. S., Tran
K.-V., 2007, ApJ, 664, L9
Ehlert S., Allen S. W., Brandt W. N., Xue Y. Q., Luo B., von der Linden A., Mantz A., Morris R. G., 2013, MNRAS, 428, 3509
Ehlert S. et al., 2014, MNRAS, 437, 1942
Ellison S. L., Patton D. R., Simard L., McConnachie A. W., 2008, AJ, 135, 1877
Ellison S. L., Patton D. R., Mendel J. T., Scudder J. M., 2011, MNRAS, 418, 2043
Fabian A. C., 2012, ARA&A, 50, 455 Fujita Y., 2004, PASJ, 56, 29
Fujita Y., Nagashima M., 1999, ApJ, 516, 619
Fujita Y., Sarazin C. L., Sivakoff G. R., 2006, PASJ, 58, 131
Galametz A. et al., 2009, ApJ, 694, 1309 Haines C. P. et al., 2012, ApJ, 754, 97 H¨aring N., Rix H.-W., 2004, ApJ, 604, L89
Heckman T. M., 1987, in Khachikian E. E., Fricke K. J., Melnick J., eds, Proc. IAU Symp. 121, Observational Evidence of Activity in Galaxies. Kluwer, Dordrecht, p. 421
Heckman T. M., Best P. N., 2014, ARA&A, 52, 589
Heckman T. M., Kauffmann G., Brinchmann J., Charlot S., Tremonti C., White S. D. M., 2004, ApJ, 613, 109
Hernquist L., Mihos J. C., 1995, ApJ, 448, 41
Hickox R. C., Mullaney J. R., Alexander D. M., Chen C.-T. J., Civano F. M., Goulding A. D., Hainline K. N., 2014, ApJ, 782, 9
Hopkins P. F., Hernquist L., Cox T. J., Di Matteo T., Robertson B., Springel V., 2006, ApJS, 163, 1
Kapferer W., Sluka C., Schindler S., Ferrari C., Ziegler B., 2009, A&A, 499, 87
Kauffmann G. et al., 2003, MNRAS, 346, 1055
Kauffmann G., White S. D. M., Heckman T. M., M´enard B., Brinch-mann J., Charlot S., Tremonti C., BrinkBrinch-mann J., 2004, MNRAS, 353, 713
Kaviraj S. et al., 2017, MNRAS, 467, 4739
Kenney J. D. P., van Gorkom J. H., Vollmer B., 2004, AJ, 127, 3361 Kewley L. J., Dopita M. A., Sutherland R. S., Heisler C. A., Trevena J.,
2001, ApJ, 556, 121
Khabiboulline E. T., Steinhardt C. L., Silverman J. D., Ellison S. L., Mendel J. T., Patton D. R., 2014, ApJ, 795, 62
Krause M., 2005, A&A, 436, 845
Kronberger T., Kapferer W., Ferrari C., Unterguggenberger S., Schindler S., 2008, A&A, 481, 337
Lee B. et al., 2017, MNRAS, 466, 1382
Luo Y., Kang X., Kauffmann G., Fu J., 2016, MNRAS, 458, 366 Martini P., Kelson D. D., Mulchaey J. S., Trager S. C., 2002, ApJ,
576, L109
Martini P., Sivakoff G. R., Mulchaey J. S., 2009, ApJ, 701, 66 Melnick J., Telles E., De Propris R., Chu Z.-H., 2015, A&A, 582, A37 Mihos J. C., Hernquist L., 1996, ApJ, 464, 641
Moore B., Katz N., Lake G., Dressler A., Oemler A., 1996, Nature, 379, 613
Mullaney J. R. et al., 2012, ApJ, 753, L30 Oh S. et al., 2014, ApJ, 790, 43
Pentericci L. et al., 2013, A&A, 552, A111 Pimbblet K. A., 2011, MNRAS, 411, 2637
Pimbblet K. A., Shabala S. S., Haines C. P., Fraser-McKelvie A., Floyd D. J. E., 2013, MNRAS, 429, 1827
Poggianti B. M. et al., 2017, Nature, 548, 304
Porter S. C., Raychaudhury S., Pimbblet K. A., Drinkwater M. J., 2008, MNRAS, 388, 1152
Rafferty D. A., McNamara B. R., Nulsen P. E. J., Wise M. W., 2006, ApJ, 652, 216
Reichard T. A., Heckman T. M., Rudnick G., Brinchmann J., Kauffmann G., Wild V., 2009, ApJ, 691, 1005
Ruderman J. T., Ebeling H., 2005, ApJ, 623, L81
Sabater J., Best P. N., Argudo-Fern´andez M., 2013, MNRAS, 430, 638 Salim S. et al., 2007, ApJS, 173, 267
S´anchez S. F. et al., 2012, A&A, 538, A8
Schawinski K., Thomas D., Sarzi M., Maraston C., Kaviraj S., Joo S.-J., Yi S. K., Silk J., 2007, MNRAS, 382, 1415
Schulz S., Struck C., 2001, MNRAS, 328, 185
Shabala S. S., Ash S., Alexander P., Riley J. M., 2008, MNRAS, 388, 625 Shabala S. S. et al., 2012, MNRAS, 423, 59
Shankar F., Weinberg D. H., Miralda-Escud´e J., 2009, ApJ, 690, 20 Silk J., Rees M. J., 1998, A&A, 331, L1
Vijayaraghavan R., Ricker P. M., 2013, MNRAS, 435, 2713
Vikhlinin A., Kravtsov A., Forman W., Jones C., Markevitch M., Murray S. S., Van Speybroeck L., 2006, ApJ, 640, 691
Vogelsberger M. et al., 2014, MNRAS, 444, 1518
Wetzel A. R., Tinker J. L., Conroy C., 2012, MNRAS, 424, 232
Wild V., Kauffmann G., Heckman T., Charlot S., Lemson G., Brinchmann J., Reichard T., Pasquali A., 2007, MNRAS, 381, 543
Wild V., Heckman T., Charlot S., 2010, MNRAS, 405, 933 Woods D. F., Geller M. J., 2007, AJ, 134, 527
Yoon J. H., Schawinski K., Sheen Y.-K., Ree C. H., Yi S. K., 2008, ApJS, 176, 414