UNIVERSITI TEKNIKAL MALAYSIA MELAKA
DEVELOPMENT OF FIBER OPTIC SENSOR FOR
SEMI-SYNTHETIC ENGINE OIL PERFORMANCES WITH
DIFFERENT CONCENTRATIONS
This report is submitted in accordance with the requirement of the Universiti Teknikal Malaysia Melaka (UTeM) for the Bachelor of Electrical Engineering
Technology (Telecommunication) with Honours.
by
NURUL AMEERA BINTI ABDUL RAZAK B071410526
950928-01-7176
UNIVERSITI TEKNIKAL MALAYSIA MELAKA
BORANG PENGESAHAN STATUS LAPORAN PROJEK SARJANA MUDA
TAJUK: DEVELOPMENT OF FIBER OPTIC SENSOR FOR SEMI-SYNTHETIC
ENGINE OIL PERFORMANCES WITH DIFFERENT CONCENTRATIONS
SESI PENGAJIAN: 2017/18 Semester 1
Saya NURUL AMEERA BINTI ABDUL RAZAK
mengaku membenarkan Laporan PSM ini disimpan di Perpustakaan Universiti Teknikal Malaysia Melaka (UTeM) dengan syarat-syarat kegunaan seperti berikut:
1. Laporan PSM adalah hak milik Universiti Teknikal Malaysia Melaka dan penulis. 2. Perpustakaan Universiti Teknikal Malaysia Melaka dibenarkan membuat salinan
untuk tujuan pengajian sahaja dengan izin penulis.
3. Perpustakaan dibenarkan membuat salinan laporan PSM ini sebagai bahan pertukaran antara institusi pengajian tinggi.
4. **Sila tandakan ( )
SULIT
TERHAD
TIDAK TERHAD
(Mengandungi maklumat yang berdarjah keselamatan atau kepentingan Malaysia sebagaimana yang termaktub dalam AKTA RAHSIA RASMI 1972)
(Mengandungi maklumat TERHAD yang telah ditentukan oleh organisasi/badan di mana penyelidikan dijalankan)
Alamat Tetap:
No 19 Jalan Ariffin 1, 80100 Johor Bahru, Johor.
Tarikh: 18 JANUARI 2018
Disahkan oleh:
Cop Rasmi:
Tarikh: 18 JANUARI 2018
ii
DECLARATION
I hereby, declared this report entitled “Development of Fiber Optic Sensor for Semi-Synthetic Engine Oil Performances with Different Concentrations” is the results of
my own research except as cited in references.
Signature : ……….
Author’s Name : NURUL AMEERA BINTI ABDUL RAZAK
iii
APPROVAL
This report is submitted to the Faculty of Engineering Technology of UTeM as a partial fulfillment of the requirements for the degree of Bachelor of Electronic Engineering Technology (Telecommunications) with Honors. The member of the supervisory is as follow:
………..
iv
ABSTRAK
v
ABSTRACT
Fiber optic is not only use in telecommunication, but it also can be applied in other
mediums or situations. For example, the application of bridge monitoring,
application of moisture monitoring, application of crack monitoring and else. In this
research, the fiber optic sensor had been applied with semi-synthetic engine oil with
different concentrations which is from 10% until 100%. It is new development to
implement in the automotive industry. Before proceeds with the prototype, a few data
need to be collect which is light source and power loss where it is as input and
output. Four different light sources which is 850nm, 1300nm, 1310nm and 1550nm
were tested. As a result, 1300nm was the suitable light source to implement in this
medium due to good pattern graph but with the lowest sensitivity. Meanwhile, 850nm
and 1310nm was dominantly used as the highest sensitivity but did not showed good
pattern of graph. The basic principle used in this research was the amount of
vi
DEDICATION
My effort was dedicated to beloved parents, family, lecturers and friends. I will remember for all their support, guidance and encouragement upon completing this project and report.
Special dedication to my parents
vii
ACKNOLEDEGEMENT
In the name of Allah S.W.T, the Most Gracious, who has given me a strength and ability to complete of this research. Praise to Him for seek help and guidance and under His benevolence we exist and without His help, this project could not be accomplished.
I would like to give gratitude and special thanks for my advisor, Mrs Rahaini Binti Md Said. During the completion of this research, she had given me a guidance and a lot of ideas. All the information and knowledge were valuable and had contributed to complete in this project. She never gave up for helping me even though I had a lot of weakness in myself.
Besides, my special gratitude and thanks for my classmates, friends, academic staffs, technical staffs and for all person that helping me during the process to complete my project. Their guidance, advice and support had given me to overcome the obstacle encountered during completing my project.
viii
TABLE OF CONTENT
Borang Pengesahan Status Laporan Projek Sarjana Muda i
Declaration ii
Approval iii
Abstrak iv
Abstract v
Dedication vi
Acknowledgement vii
Table of Content viii
List of Tables xi
List of Figures xii
List Abbreviation, Symbol and Nomenclatures xiv
CHAPTER 1: INTRODUCTION 1.0 Project Background 1
1.1 Problem Statement 2
1.2 Objectives 3
1.3 Scope of Study 3
CHAPTER 2: METHODOLOGY 2.0 Introduction 4
2.1 Fiber Optic 4
2.1.1 Introduction of Fiber Optic 4
2.1.2 Structure of Fiber Optic 5
2.1.3 Fiber Classification 8
2.1.4 Mode 8
2.1.5 Single Mode Fiber 10
2.2 Fiber Optic Sensor 13
2.2.1 Introduction to Fiber Optic Sensor 13
2.2.2 Classification of Fiber Optic Sensor 14
ix
2.3 Previous Sensory of Fiber Optic Sensor 16
2.3.1 Medical Smart Textiles Based on Fiber Optic 16
Technology 2.3.2 Measurement and Analysis of High Temperature 18
Using Distributed Fiber Optic Sensor 2.3.3 Study on The Sensing Coating of The Optical Fiber 19
Carbon Dioxide (Co2) Sensor 2.4 Semi Synthetic Engine Oil 20
2.5 Hexane 21
2.5.1 Introduction of Hexane 21
2.5.2 What Is the Structure of Hexane? 22
2.5.3 How Is Hexane Produced 22
2.5.4 The Downside of Hexane 22
2.6 Comparative Study of Used and Unused Engine Oil 23
(Perodua Genuine and Castrol Magnatec Oil) Based on Property Analysis Basis CHAPTER 3: METHODOLOGY 3.0 Introduction 26
3.1 Project Methodology 26
3.1.1 Develop the Sensor 27
3.1.2 Test with the sensor 28
3.1.3 Analyze the result 28
3.1.4 Report writing 28
3.2 Flowchart 29
3.3 Experiment Methodology 30
3.3.1 Stripping 30
3.3.2 Cleaning 30
3.3.3 Cleaving 31
3.3.4 Splicing 31
3.3.5 Testing 32
x CHAPTER 4: RESULT AND DISCUSSION
4.0 Overview project 33
4.1 Experiment Setup 33
4.2 Result and Analysis 10% Concentration of 35
Semi-Synthetic Engine Oil 4.3 Result and Analysis 20% Concentration of 40
Semi-Synthetic Engine Oil 4.4 Result and Analysis 30% Concentration of 45
Semi-Synthetic Engine Oil 4.5 Result and Analysis 40% Concentration of 50
Semi-Synthetic Engine Oil 4.6 Result and Analysis 50% Concentration of 55
Semi-Synthetic Engine Oil 4.7 Result and Analysis 60% Concentration of 60
Semi-Synthetic Engine Oil 4.8 Result and Analysis 70% Concentration of 65
Semi-Synthetic Engine Oil 4.9 Result and Analysis 80% Concentration of 70
Semi-Synthetic Engine Oil 4.10 Result and Analysis 90% Concentration of 75
Semi-Synthetic Engine Oil 4.11 Result and Analysis 100% Concentration of 79
Semi-Synthetic Engine Oil 4.12 Analyzing for The Best Light Source 84 CHAPTER 5: CONCLUSION AND FUTURE WORK 5.0 Introduction 87
5.1 Conclusion for Chapter 1 and 2 87
5.2 Conclusion for Chapter 3 88
5.3 Conclusion for Chapter 4 88
xi
LIST OF TABLES
4.0 Collected data for 10% of semi-synthetic engine oil 35 4.1 Responsiveness Fiber Optic Sensor at 850nm, 1300nm 38
1310nm and 1550nm for 10% of semi-synthetic engine oil.
4.2 Collected data for 20% of semi-synthetic engine oil 40 4.3 Responsiveness Fiber Optic Sensor at 850nm, 1300nm 43
1310nm and 1550nm for 20% of semi-synthetic engine oil
4.4 Collected data for 30% of semi-synthetic engine oil 45 4.5 Responsiveness Fiber Optic Sensor at 850nm, 1300nm 48
1310nm and 1550nm for 30% of semi-synthetic engine oil.
4.6 Collected data for 40% of semi-synthetic engine oil 50 4.7 Responsiveness Fiber Optic Sensor at 850nm, 1300nm 54
1310nm and 1550nm for 40% of semi-synthetic engine oil.
4.8 Collected data for 50% of semi-synthetic engine oil 55 4.9 Responsiveness Fiber Optic Sensor at 850nm, 1300nm 58
1310nm and 1550nm for 50% of semi-synthetic engine oil.
4.10 Collected data for 60% of semi-synthetic engine oil 60 4.11 Responsiveness Fiber Optic Sensor at 850nm, 1300nm 63
1310nm and 1550nm for 60% of semi-synthetic engine oil.
4.12 Collected data for 70% of semi-synthetic engine oil 65 4.13 Responsiveness Fiber Optic Sensor at 850nm, 1300nm 68
1310nm and 1550nm for 70% of semi-synthetic engine oil.
4.14 Collected data for 80% of semi-synthetic engine oil 70 4.15 Responsiveness Fiber Optic Sensor at 850nm, 1300nm 73
1310nm and 1550nm for 80% of semi-synthetic engine oil.
4.16 Collected data for 90% of semi-synthetic engine oil 75 4.17 Responsiveness Fiber Optic Sensor at 850nm, 1300nm 78
1310nm and 1550nm for 90% of semi-synthetic engine oil.
4.18 Collected data for 100% of semi-synthetic engine oil 79 4.19 Responsiveness Fiber Optic Sensor at 850nm, 1300nm 83
1310nm and 1550nm for 100% of semi-synthetic engine oil.
xii
LIST OF FIGURES
2.0 Typical Fiber Construction 5
2.1 Total Internal Reflection in An Optical Fiber 6
2.2 Typical Core and Cladding Diameters 7
2.3 The Measurement for Core and Core 7
2.4 Types of Fiber Propagation 9
2.5 Extrinsic or Hybrid Fiber Optic Sensor 15
2.6 Intrinsic or All Fiber Optic Sensor 15
2.7 Schematic Representation of The Monitoring Systems 17 2.8 The Basic Structure of Topic Implementation Plan 18
2.9 Measurement Set Up Used for CO2 Sensing 19
2.10 Synthetic Oil 20
2.11 Structure of Hexane 22
2.12 Viscosity index for both PG and CM oil 24
2.13 Severe cluster wear element in PG and CM oil 25
3.0 Methodology of the Project 27
3.1 Flowchart 29
3.2 Stripping 30
3.3 Cleaving 31
3.4 Splicing 32
xiii 4.12 Output power against time for 30% of concentration with 1550nm 48 4.13 Output power against time for 40% of concentration with 850nm 51 4.14 Output power against time for 40% of concentration with 1300nm 52 4.15 Output power against time for 40% of concentration with 1310nm 52 4.16 Output power against time for 40% of concentration with 1550nm 53 4.17 Output power against time for 50% of concentration with 850nm 56 4.18 Output power against time for 50% of concentration with 1300nm 56 4.19 Output power against time for 50% of concentration with 1310nm 57 4.20 Output power against time for 50% of concentration with 1550nm 58 4.21 Output power against time for 60% of concentration with 850nm 61 4.22 Output power against time for 60% of concentration with 1300nm 61 4.23 Output power against time for 60% of concentration with 1310nm 62 4.24 Output power against time for 60% of concentration with 1550nm 63 4.25 Output power against time for 70% of concentration with 850nm 66 4.26 Output power against time for 70% of concentration with 1300nm 66 4.27 Output power against time for 70% of concentration with 1310nm 67 4.28 Output power against time for 70% of concentration with 1550nm 68 4.29 Output power against time for 80% of concentration with 850nm 71 4.30 Output power against time for 80% of concentration with 1300nm 71 4.31 Output power against time for 80% of concentration with 1310nm 72 4.32 Output power against time for 80% of concentration with 1550nm 73 4.33 Output power against time for 90% of concentration with 850nm 76 4.34 Output power against time for 90% of concentration with 1300nm 76 4.35 Output power against time for 90% of concentration with 1310nm 77 4.36 Output power against time for 90% of concentration with 1550nm 78 4.37 Output power against time for 100% of concentration with 850nm 80 4.38 Output power against time for 100% of concentration with 1300nm 81 4.39 Output power against time for 100% of concentration with 1310nm 81 4.40 Output power against time for 100% of concentration with 1550nm 82
4.41 Sensitivity against concentration for 850nm 85
4.42 Sensitivity against concentration for 1300nm 85
4.43 Sensitivity against concentration for 1310nm 85
xiv
LIST OF ABBREVIATIONS, SYMBOLS AND
NOMENCLATURES
FOS – Fiber Optic Sensor
ASE – Amplified Spontaneous Emission OSA – Optical Spectrum Analyzer EMI – Electromagnetic Interference
SMF – Single Mode Fiber
µ – Micro
mV – Milli Volts
T/bit – Terabit
dB – Decibel
1
CHAPTER 1
INTRODUCTION
1.0 PROJECT BACKGROUND
Optoelectronics and fiber optic communications industries were two dominant items that had taken place over 20 years. The application that used in optoelectronic industry such as cameras, medical instrument, military applications and sun tracking solar panel. Then, fiber optic communications had changed the media communications industry by giving lofty implementation, more dependable telecommunication links with continually diminishing bandwidth cost. From the progressions was bringing the advantage of high-amount of manufacture to the users and a precise data constitute from glass. A line of these progression, fiber optic sensor innovation had a vast scale users of technology tie to optoelectronic and fiber optic communications industries. (E. Udd,1991)
Most of the parts associated with these industries were as often as can be produced for the utilization of fiber optic sensor. The success of fiber optic sensor technology and following extensive size of production to reinforce this business. The advantage of fiber optic was just not only their performances in telecommunication, but also can be implemented to monitor for anything and it is depending on the problem. Example of applications that can be used in fiber optic sensor are strain, temperature, velocity, vibration, dampness, chemical evaluation and else. (E. Udd,1991)
2 sensitivity, bandwidth and extreme environments. Any benefit is lacking, where the price of fiber optic sensors is very expensive. (E. Udd,1991)
Semi-synthetic engine oil is a mixture of mineral oil and synthetic oil. Typically, not more than 30% synthetic oil with mineral oil. They are thinner and increase the productivity of the fuel in the engine. Semi-synthetic engine oil can be used for all types of engines. Moreover, the cost of a semi-synthetic engine oil is cheaper than fully synthetic motor oil. By using this oil, it can be assured that it offers the best performance and protection for all vehicles. Distance changes to semi-synthetic engine oil is between 5 000km to 10 000km. Therefore, to make the performance of engine be better and protect it from something that unexpected, the engine oil need to carry out by change according to a set time. If it fails to do so, problems will occur such as the friction and wear to the piston in the engine and also the performance of the car will be poor.
This project proposed to develop the semi- synthetic engine oil detection by using the fiber sensor. The optical fiber as a device that can be used to detect the different concentration for semi- synthetic engine oil.
1.1 PROBLEM STATEMENT
These days, there are various engine oil produced. Engine oil is the important things that need to be changed due to the increase of concentration. Semi-synthetic
engine oil is a type of engine oil. Some people say that semi-synthetic engine oil
3 1.2 OBJECTIVES
The main objectives of this project are: a) To study fiber optic sensor operation.
b) To develop fiber optic sensor (FOS) for semi-synthetic engine oil performances with different concentration application.
c) To analyse the performance of fibre optic sensor (FOS) for concentration detection activity.
1.3 SCOPE
4
CHAPTER 2
LITERATURE REVIEW
2.0 INTRODUCTION
In this chapter, research has been done by others related to this study were discussed. Structural information is used to guide research in the right way. The source comes from books, journals and articles that have been written by previous researchers associated with this project. Theory and the results of this study can help them because they can be the difference between this and they seem.
2.1 FIBER OPTIC
2.1.1 INTRODUCTION TO FIBER OPTIC
5 2.1.2 STRUCTURE OF FIBER OPTIC
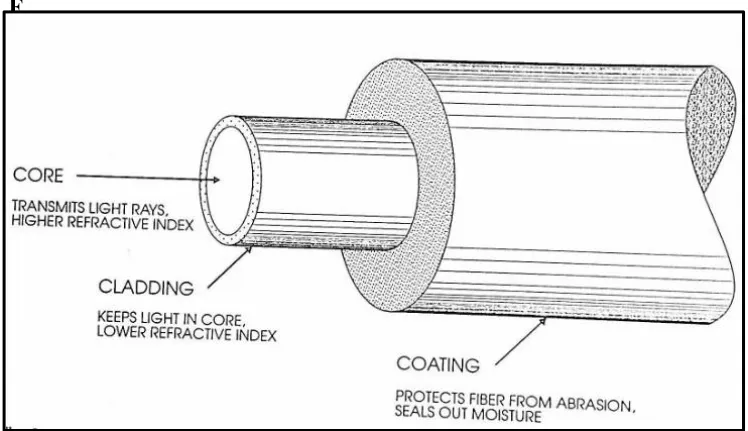
Core and cladding are two main concentric layers in optical fiber. The inner core is the light-carrying part. The surrounding cladding provides the difference in refractive index that allows total internal reflection of light through the core. The index of the cladding is less than 1 percent lower than that of the core. Typical values, for example, are a core index of 1.47 and a cladding index of 1.46. Fiber manufacturers must carefully control this difference to obtain desired fiber characteristics. (Sterling,2004)
By referred to Figure 2.0, fiber have an extra coating around the cladding. The coating, which is generally at least one or more layers of polymer, shield that core and cladding from shocks that might influence their optical or physical properties. The coating has no optical properties affecting the propagation of light within the fiber. This coating, then, is a shock absorber. (Sterling,2004)
F i g u r e
2 . 0 :
Figure 2.0: Typical Fiber Construction
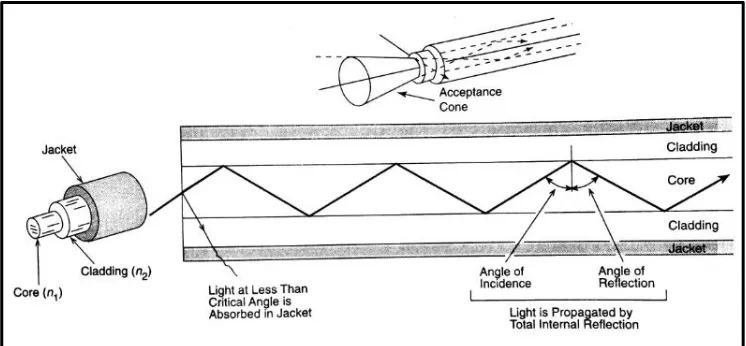
[image:20.596.145.519.406.622.2]6 reflection are equal, the reflected light will again be reflected. The light will continue zigzagging down the length of the fiber. (Sterling,2004)
Figure 2.1: Total Internal Reflection in An Optical Fiber
Light, however, striking the interface at less than the critical angle passes into the cladding, where it is lost over distance. The cladding is usually inefficient as light carrier, and light in the cladding becomes attenuated rapidly. (John`C.Huber, 1995)
Notice also, in Figure 2.1, that the light is also refracted as it passes from air into the fiber. Thereafter, its propagation is governed by the indices of the core and cladding and by Snell`s law. (John`C.Huber, 1995)
Such total internal reflection forms of the basis of light propagation through a simple optical fiber. This analysis, however, considers only
meridional rays – those that pass through the fiber axis each time they are
reflected. Other rays, called skew rays, travel down the fiber without passing through the axis. The path of a skew rays is typically helical, wrapping around and around the central axis. Fortunately, skew rays are ignored in most fiber-optic analyses. (Sterling,2004)
7 will reflect down the fiber. Light outside the cone will not meet the more the core-to-cladding interface at an angle that allows total internal reflection. This light will not propagate. (Sterling,2004)
The specific characteristics of light propagation through a fiber depend on many factors, including:
a) The size of the fiber
b) The composition of the fiber c) The light injected into the fiber
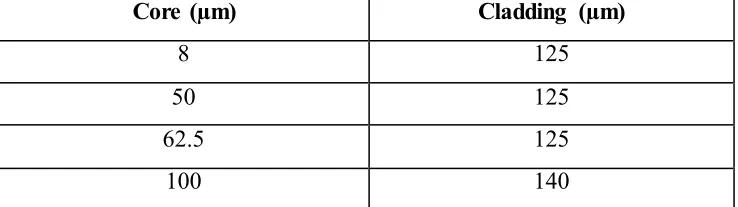
[image:22.596.153.542.420.503.2]An understanding of the exchange between these properties will clear up many aspects of fiber optics. Fibers themselves have exceedingly small diameters. Figure 2.2 shows cross sections of the core and cladding diameters of four commonly utilized fibers. The diameters of the core and cladding are shown as in Figure 2.2. (Sterling,2004)
Figure 2.2: Typical Core and Cladding Diameters
Core (µm) Cladding (µm)
8 125
50 125
62.5 125
100 140
[image:22.596.152.521.551.655.2]8 2.1.3 FIBER CLASSIFICATION
Optical fibers are classified into two ways. One of their way is based on the material makeup: (Sterling,2004)
a) Glass fibers have glass core and glass cladding. The glass utilized as a part of strands is ultrapure, ultra-transparent silicon dioxide or fused quarts. If sea-water were as clear as a fiber, it could see to the bottom of the deepest ocean trench, the 35 839-foot-deep Marians Trench in the Pacific. Impurities are intentionally added to the pure glass to achieve the desired index of refraction. Germanium or phosphorus, for instance to increment the index. Meanwhile, the boron or fluorine are decrease the index. Other impurities not removed when the glass is purified also remain. These, as well, influence fiber properties by increasing attenuation by scattering or absorbing light.
b) Plastic-clad silica (PCS) fibers have a glass core and plastic cladding. Their performance is not good as all-glass fibers.
c) Plastic fibers have a plastic core and plastic cladding. Contrasted and different with other fibers, plastic fibers are limited in loss and bandwidth. Their very low cost and simple to utilize, however, make them attractive in applications where high bandwidth or low loss is not a concern. Their electromagnetic immunity and security enable plastic fibers to be usefully utilized. Plastic and PCS fibers don`t have buffer coating surrounding the cladding.
2.1.4 MODE
9 the relationship between electric and magnetic energy. He showed they were both form of electromagnetic energy, not two different forms as was then believed. His equation also showed that the propagation of this energy followed strict rules. Maxwell`s equations form the basis of the electromagnetic theory. (Sterling,2004)
Figure 2.4: Types of Fiber Propagation
When the core of the fiber is small enough that only one ray can pass down the axis of the core, it is called single-mode fiber. A mode is path of light propagation. Therefore, when all light is in one path on the axis, there is but one single mode of propagation. On the other hand, when the core of the fiber is very large, many rays can pass down the core, at a variety of angles from the axis, up to the maximum angle for total internal reflection. A crude but effective analogy is that single-mode fiber acts like a rifle, with all the energy being in one projectile. (John`C. Huber, 1995)