Full Length Research Paper
Fruit drying process: Analysis, modeling and
simulation
Shahab Abdulla*, Paul Wen,
Richard Landers and B. F. Yousif
Faculty of Engineering and Surveying, University of Southern Queensland, Toowoomba, QLD 4350, Australia.
Accepted 28 September, 2011
The current work presents an investigation on fruit drying system. The effect of the operating parameters on the quality of products and the efficiency of the system is studied. The method is based on a new model which was developed to study the fruit drying system performance considering equilibrium moisture content of fruit, humidity of dryer atmosphere, temperature of dryer atmosphere and air flow. The results revealed that operating parameters are highly controlling the dryer efficiency, whereas increase in the air temperature highly reduced the energy required and enhance the dryer efficiency. However, high temperature could damage the fruit, that is worsens the quality. Therefore, the air temperature plays the main role in controlling the quality of the dried fruit.
Key words:Fruit drying process, operating parameters, quality, modeling.
INTRODUCTION
Drying of crop and fruit products is an important issue for the preservation and conservation of food. Using solar drying system is becoming an attractive and alternative food preservation technique over the conventional ones. This is due to many advantages of solar drying system compared to others, that is low cost, high quality of dried products and environmentally friendly (Heredia et al., 2007; Toor and Savage, 2006; Walker and Wilhelm, 1995; Ziauddin and Liang, 1986; Shinskey, 1996; Souza, 1997). Moreover, the products are isolated from rain, storm, windborne dirt, dust, and infestation by insects, rodents and other animals. In other words, the quality of food can be preserved (Heredia et al., 2007). In Heredia et al. (2007), Toor and Savage (2006), Walker and Wilhelm (1995) and Ziauddin and Liang (1986), it has been reported that system performance highly influences the quality of the products. The performance of the solar drying system is controlled by number of physical processes such as heat and mass transfer of air (Toor and Savage, 2006). In the drying system, convection,
*Corresponding author. E-mail: [email protected]. Tel: +61 7 46312633, +61 449150623.
conduction and radiation processes take place (Souza, 1997; Simpson, 1996), while the mass transfer occurs by liquid phase transformation into gas phase (Walker and Wilhelm, 1995). Batch process represents the core of the solar drying systems (Ziauddin and Liang, 1986). One of the common used batch process controller is the proportional derivative (PD) control (Shinskey, 1996). It has been implemented in many systems (Lewicki, 2006; Cykler, 1996; Bona, 1994; Filkova and Choc, 1989). When controlling a batch fruit dehydrator, the objective is not currently one of achieving steady state operation but the determination of the end point. The end point may occur before the steady state of the process is reached. In fact, this is preferable when the costs and time of the process are to be minimised. It is possible to operate a drying process to achieve steady state. This is achieved when the dryer’s conditions (fruit’s equilibrium moisture content) equals the desired result. This requires significant inputs to achieve namely time and energy (Aylward and Findlay, 1979; Backhurst et al., 1974; El-Sebaii et al., 2002; McBean and McG 1976). In practice, the operation of batch dryers is to continue the evaporation until the moisture content is equal to that required, at which point the process is stopped.
results in loss of quality and higher energy costs. Souza looked at controller design that would allow the air temperature of the dryer to follow a maximum profile throughout the drying time (Garg and Sharma, 1990; Henderson, 1952; Unadi et al., 2002).
The drying of wood is a more complex problem that requires the rate of evaporation to be limited so as not to cause checking in the product (Simpson, 1996). Due to the extra limitation on the system, a third controller is added to the system used for batch fluidized bed dryers. This controller operates in parallel to the temperature controller. The aim of this controller is to change the temperature of the air by a set amount. The two control signals are compared and the smaller signal is passed to the plant (Shinskey, 1996). Timber dryers use inferential moisture control to determine the end point. This paper shows that better control of the process is achievable through an understanding of the following factors and their place in the dryer process; the nature of the product, the equilibrium moisture content, the temperature of the atmosphere in the dryer, the humidity of the atmosphere in the dryer and the flow of the atmosphere in the dryer. Control of the humidity in the dryer improves efficiency by only venting the system to maintain the conditions within the dryer.
DEVELOPMENT OF THE MODEL
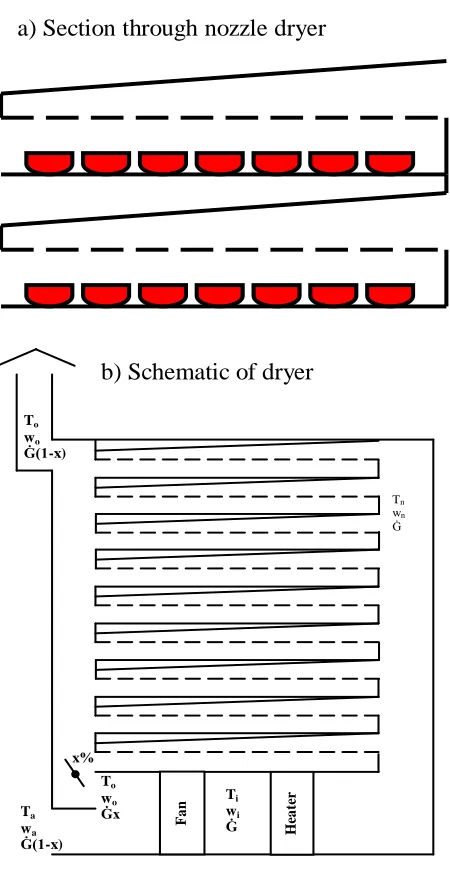
In current design dryers, the controller of the air speed relies on the amount of the fruit loaded into the dryer. In this method, there is a design solution that removes the dependence of the air speed on the packing density of the fruit. This airflow is considered to be turbulent flow. For a fruit dryer, this would be achieved through the use of tapered ducts above the trays. The lower side of the duct contains a series of regular spaced holes ‘nozzles’ to direct the airflow evenly onto the drying surface (Figure 1). The volume of air flowing out of an opening in the duct is a function of the change in cross sectional area of the duct due to the taper and the size of the opening, the smaller the opening the higher the speed. The area of the nozzles sets the speed of the atmosphere over the surface of the fruit. The air speed is a function of the dry air mass flow rate, the nozzle area and the density of the atmosphere (Equation 1):
(1)
Where is the mass of air flows, is density of the atmosphere and is the nozzle area.
In this case, it does not consider the dependency of the air speed and in laminar flow dryers on the cross sectional area (Equation 2).
(2)
Where is the speed of the air, is a function of the cross sectional area.
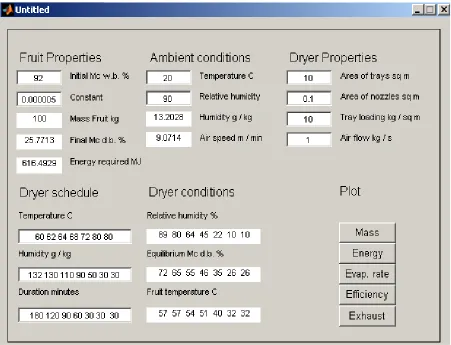
Graphic user interface technique was used to ease the method of entering the date and parameters to the model (Figure 2).
Control of humidity
The humidity within the dryer can be held constant through the control of the recirculation rate. The humidity of the dryer is the sum of the percentage ambient humidity and the complementary percentage
of the outlet humidity that is mixed together to form the humidity at the nozzles :
(3)
The humidity at the outlet of the dryer will be the humidity at the nozzles plus the evaporation rate divided by the mass flow rate of dry air:
(4)
Solve Equation 3 for :
(5)
Substituting Equations 4 into 5 and reducing:
(6)
The exhaust ratio can be found from Equation 6 from the change in the mass of the fruit and the ambient humidity.
Determining the evaporation rate for the controller
In a laminar airflow dryer, the effect of each fruit acts sequentially so the rate of evaporation for the dryer will be:
(7)
c) Smaller nozzle openings, higher air speed
Fa
n
H
ea
te
r
To
wo
Ġ(1-x)
Tn
wn
Ġ
Ta
wa
Ġ(1-x) x%
To
wo
Ġx
Ti
wi
Ġ
b) Schematic of dryer
a) Section through nozzle dryer
[image:3.612.171.396.70.516.2]Figure 2. Window of the develop model using Matlab.
the air flow) and is the fruit along the tray (parallel to the air flow).
The mass flow rate of the dry air will remain constant as the fan speed is fixed. The condition of the atmosphere before the fruit will have a temperature and a humidity of . The rate of energy flow before the fruit can be calculated from Equation 8.
(8)
The energy flowing with the atmosphere after the fruit will be the energy flow before the fruit minus the energy flow into the fruit :
(9)
The energy flowing into the fruit will equal the flow of moisture from the fruit times the latent heat of vapourisation plus the change in temperature of the
fruit times the mass of the fruit times the heat capacitance of the fruit.
(10)
By assuming that the condition of the inlet atmosphere is constant, Equation 10 will reduce to:
(11)
(12)
Where is the molar heat of vaporization for transition liquid to vapour.
θ
λ = ΔH
S– ΔH
mWhere
θ
0
0.2
0.4 0.6
0.8 1
20 30 40 50 60
0 20 40 60 80 100
Relative humidity (decimal) Fruit temperature (°C)
Eq
u
ili
b
ri
u
m
mo
ist
u
re
co
n
te
n
t
d
.
b.
(%
)
Figure 3. Henderson’s equilibrium moisture content for tomatoes.
25°C for the transition solid to vapour. Where
ΔHm
is the molar heat melting or fusion for the transition solid to liquid.
The humidity after the fruit will be equal to the humidity before the fruit plus the evaporation rate divided by the mass flow rate of the dry air:
(13)
The temperature of the atmosphere after the fruit will equal the energy flowing with the atmosphere divided by the mass of dry air flow rate times the heat capacitance of the atmosphere:
(14)
Substitute Equations 9 and 13 into 14:
(15)
Substitute Equations 8 and 11 into Equation 15, it
becomes:
(16)
Solving for the evaporation rate to get:
(17)
When controlling the humidity in a laminar flow dryer, the change in mass of the fruit in the dryer can be found from the temperature change of the atmosphere with Equation 16.
Evaporation from fruit in a turbulent flow dryer will still conform to Equation 16. In a turbulent flow dryer, the rate of evaporation for the whole dryer is equal to the number of fruit times the rate of evaporation of a single fruit.
(17)
When controlling the humidity in a turbulent flow dryer, the change in mass of a few fruit can be considered as a representative of the moisture content of all the fruit in the dryer. The evaporation rate in a turbulent flow dryer can be measured directly from the change in the mass of the fruit (Figure 3).
d) Effect of air speed on drying time
0 5 10 15 20
0 100 200 300 400 500 600 700 800 900 1000 Time (hours) M o ist u re co n te n t o f f ru it (d .b .% ) required
30% 40C 2m/s 30% 40C 4m/s 30% 40C 8m/s 70% 70C 4m/s
c) Effect of atmosphere condition on drying time
0 10 20 30 40 50 60
0 100 200 300 400 500 600 700 800 900 1000 Time (hours) M o ist u re co n te n t o f f ru it (d .b .% ) required 30% 40C 30% 70C 70% 40C 70% 70C
b) Effect of relative humidity on drying time
0 5 10 15 20 25
0 100 200 300 400 500 600 700 800 900 1000 Time (hours) M o ist u re co n te n t o f fr u it ( d .b .% )
Effect of Relative humidity on drying time
required
30 % 50 % 70 % 90 % a) Effects of equilibrium moisture content on drying time.
0 5 10 15 20
0 100 200 300 400 500 600 700 800 900 1000 Time (hours) M o ist u re co n te n t o f fr u it ( d .b .% )
Effect of equilibrem moisture content on drying time
required 20 % 40 % 60 % 80 % Time (h) Time (h)
Time (h) Time (h)
Figure 4. Effect of different parameters on the drying time.
(18)
RESULTS
The results of the developed model for tomatoes drying at different conditions and parameters are presented in Figures 4 to 8.
Influence of the drying time
Effects of equilibrium moisture content on drying time are displayed in Figure 4a - d.
In Figure 4a, the influence of equilibrium moisture in drying is presented with respect to the moisture contents of the fruit. In general, reducing the equilibrium moisture
a) Effect of air temperature and humidity on fruit temperature
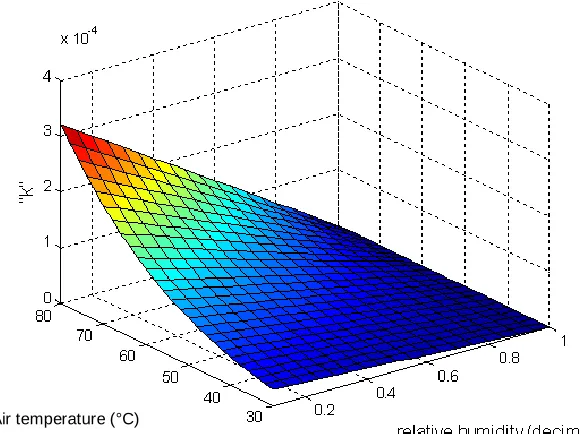
b) Effects of air temperature and humidity on ‘k’
Air temperature (°C) Air temperature (°C)
F
ru
it
t
e
m
p
e
ra
tu
re
(
°C
)
Figure 5. Effects of air temperature and humidity on fruit temperature and ‘k’.
shorten the time taken to dry a given mass of fruit.
Effects of air temperature and humidity on fruit temperature
Effects of air temperature and humidity on fruit temperature and ‘k’ are displayed in Figure 5a and b. In Figure 5a, the influence of air temperature and humidity on fruit temperature is the higher the fruit’s temperature the more thermal degradation that occurs during the
drying process. On the other hand, Figure 5b shows the effect of both air temperature and relative humidity on the value of ‘k’. The effect of the atmospheric conditions on ‘k’ shows that the fastest rate of drying will occur when the conditions are of high temperature and low humidity.
The rate of evaporation varies from fruit to fruit dependent on the conditions at each fruit. Evenness in moisture content can only be achieved when the fruits come in to equilibrium with the atmosphere in the dryer.
[image:7.612.167.457.323.540.2]
0 100 200 300 400 500 600
0 2 4 6 8 10 12
Effect of ambient conditions on exhaust of drying
time minutes E x h a u s t ra te %
25 C, 80% 35 C, 80% 35 C, 30%
0 100 200 300 400 500 600
10 20 30 40 50 60 70 80 90 100 110
Effect of ambient conditions on rate of drying
time minutes M a ss o f fr u it K g
25 C, 80% 35 C, 80% 35 C, 30%
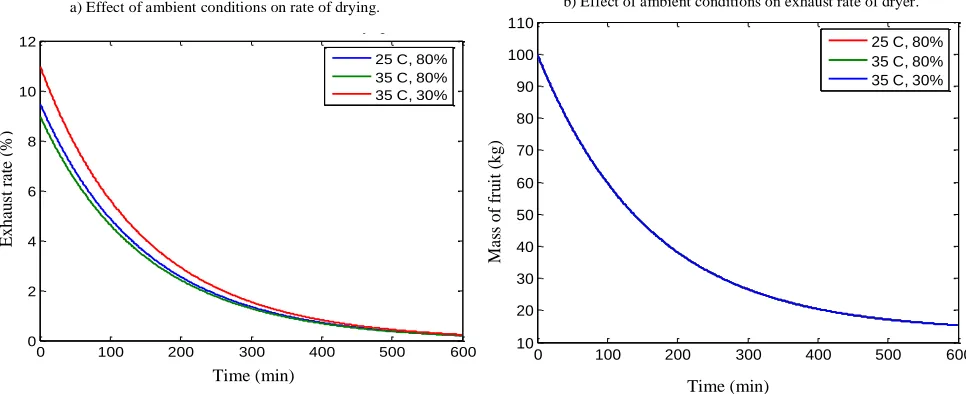
a) Effect of ambient conditions on rate of drying. b) Effect of ambient conditions on exhaust rate of dryer.
M as s of f ru it ( kg ) E xha u st r at e (% ) Time (min) Time (min)
0 100 200 300 400 500 600
0 2 4 6 8 10 12
Effect of ambient conditions on exhaust of drying
time minutes E x h a u s t ra te %
25 C, 80% 35 C, 80% 35 C, 30%
0 100 200 300 400 500 600
10 20 30 40 50 60 70 80 90 100 110
Effect of ambient conditions on rate of drying
time minutes M a ss o f fr u it K g
25 C, 80% 35 C, 80% 35 C, 30%
a) Effect of ambient conditions on rate of drying. b) Effect of ambient conditions on exhaust rate of dryer.
M as s of f ru it ( kg ) E xha u st r at e (% ) Time (min) Time (min)
Figure 6. Effect of time on the rate of drying and exhust rate of drying.
0 100 200 300 400 500 600
0 5 10 15 20 25 30 time minutes E n e rg y a d d e d kW
Effect of ambient conditions on energy requirementsrate of drying
25 C, 80% 35 C, 80% 35 C, 30%
0 100 200 300 400 500 600
0 5 10 15 20 25 30 35 40
Energy reguirements for different air flow
time minutes E n e rg y a d d e d kW 0.5 kg/s 1.0 kg/s 2.0 kg/s E ne rg y add ed ( kw )
Time (min) Time (min)
a) Dryer energy requirements for different conditions.
E ne rg y add ed ( kw )
b) Energy requirements for different air flow rates.
conditions. rate of dryer.
0 100 200 300 400 500 600
0 5 10 15 20 25 30 time minutes E n e rg y a d d e d kW
Effect of ambient conditions on energy requirementsrate of drying
25 C, 80% 35 C, 80% 35 C, 30%
0 100 200 300 400 500 600
0 5 10 15 20 25 30 35 40
Energy reguirements for different air flow
time minutes E n e rg y a d d e d kW 0.5 kg/s 1.0 kg/s 2.0 kg/s E ne rg y add ed ( kw )
Time (min) Time (min)
a) Dryer energy requirements for different conditions.
E ne rg y add ed ( kw )
b) Energy requirements for different air flow rates.
conditions. rate of dryer.
Figure 7. Effect of time on the energy required for the system.
these two factors are controlled, the variation in the drying process can be removed, the fruit dryer is operating to produce constant: batch time, quality and cost.
Effects of time on the rate of drying and exhaust rate of drying
Figure 6a and b shows the effects, the ambient conditions on the operation of the dryer. Figure 6a shows that the rate of evaporation is not affected by the ambient weather conditions outside the dryer. The fruit dries at the same rate for all three ambient conditions. This dryer is
capable of producing constant operating times regardless of the ambient conditions. It does however affect the exhaust rate as displayed in Figure 6b.
Effects of time on the energy required
[image:8.612.69.552.79.276.2] [image:8.612.102.522.332.512.2]0 100 200 300 400 500 600
10 15 20 25 30 35 40 45 50 55 60
time minutes
D
rye
r
e
ff
ici
e
n
cy
%
Effect of relative humidity on efficiency
50% 70% 90%
0 100 200 300 400 500 600
15 20 25 30 35 40 45 50 55
time minutes
D
rye
r
e
ff
ici
e
n
cy
%
Effect of ambient temperature on efficiency
25 C 30 C 35 C
a) Effect of ambient temperature on efficiency rates.
conditions.
rate of dryer.
b) Effect of relative humidity on efficiency
conditions.
rate of dryer.
Time (min)
Time (min)
D
ry
e
r
e
ffi
c
ie
n
c
y
(%
)
D
ry
e
r
e
ffi
c
ie
n
c
y
(%
[image:9.612.61.559.76.309.2])
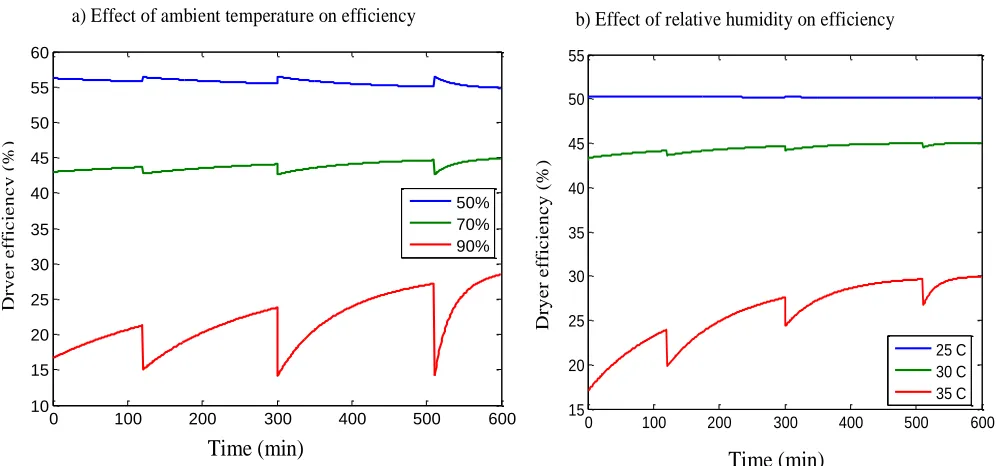
Figure 8. Effect of operating conditions on the drying effeciency.
different airflow rates. Higher airflow not only increases the energy demand of the dryer but also the range of the variation. This variation is due to the decline in evaporation as the fruit dries. This produces less change in the dryer’s humidity, the exhaust closes and less energy is lost from the system.
Effects of operation conditions on the drying efficiency
Figure 8a and b shows the effect of different parameters on the efficiency of the dryer. Figure 8a shows that reducing the ambient air temperature improves the efficiency of the dryer. Although the relative humidity is held constant at 70%, the humidity of the ambient air fell with the temperature. Moreover, the lower humidity reduces the exhaust rate and thus the flow of energy out of the system is reduced. Figure 8b displays the result of variation in the relative humidity at a fixed ambient air temperature. The presented results in Figure 8b seem to contradict the results given in Figure 8a. Here, the efficiency increases as the relative humidity increase which is due to the energy that enters the dryer with the incoming ambient airflow. The higher the humidity for a given temperature the higher the energy carried by the air.
DISCUSSION
Moisture content is a critical factor of fruit quality (Heredia
et al., 2007). The current work shows temperature, humidity and speed of inlet air play important role in controlling the drying performance of the system. Such findings are in agreement with the published works in Deng et al. (2009), Amer et al. (2010) and Teeboonma et al. (2003). The current work revealed that the batch drying of tomatoes is a time intensive process. Moreover in El-Sebaii et al. (2002), it was proposed that the uncertainty in processing produces an environment in which it is difficult to run the dryer continuously without having staff present on a 24 h basis. This is confirmed by the current work, where the system can daily run twice for 4 h. According to Deng et al. (2009), Amer et al. (2010) and Teeboonma et al. (2003), the current practice is to start the dryer off at a temperature higher than that required for drying so that the maximum rate of heating can be achieved. In the current work, this problem can be overcome by closing the exhaust completely and setting the temperature relatively low. In other words, once the heating reaches the required level, the exhaust is opened and the temperature can rise. Moreover, the humidity is controlled to give a wet bulb temperature of the atmosphere equivalent to the required fruit temperature. Using the current model, the humidity of the ambient atmosphere can be controlled via air conditioning system. It should be mentioned here that the novelty of the current work is that the model can be used for different types of fruits.
Conclusions
1) Operating parameters and air conditions highly influence the dryer performance and the energy required. Increase the air speed and/or temperature highly reduced the energy required and enhance the dryer efficiency. In other words, high reduction in the cost can be achieved. 2) The quality of the fruit in terms of variation in moisture content is highly controlled by the dryer system temperature. However, high temperature could damage the fruit which worsens the quality. Therefore, the air temperature plays the main role in controlling the quality of the fruit. Control of the humidity in the dryer improved efficiency of the dryer by only venting the system as much as is required to maintain the conditions within the dryer.
3) Controlling the humidity in the dryer reduces the cost of operation. Moreover, improving the efficiency in terms of energy and time reduces the costs of the process. 4) Using the new model to simulate the drying system can lead to low energy consumption, high quality of products and low cost of the process. It is highly recommended to simulate the dryer before conducting laboratory experiments and/or commercializing the products.
5) The new model can be adopted with other dryer systems such as solar or hybrid drying systems.
REFERENCES
Amer BMA, Hossain MA, Gottschalk K (2010). Design and performance evaluation of a new hybrid solar dryer for banana. Ener. Convers. Manage., 51(4): 813-820.
Aylward GH, Findlay TJV (1979). SI chemical data, 2nd edn, John Wiley & Sons.
Backhurst JR, Harker JH, Portter JE (1974). Problem in Heat and Mass Trsansfer, Edward Arnold.
Bona M (1994). An introduction to wool fabric finishing, Texilia. Cykler JF (1996). Drying high moisture Wet –in –shell macadamia nuts
with low temperature Dehydrated air. Appl. Eng. Agric., 12: 223-227. Deng WY, Yan JH, Li XD, Wang F, Lu SY, Chi Y, Cen KF (2009).
Measurement and simulation of the contact drying of sewage sludge in a Nara-type paddle dryer. Chem.ical Eng. Sci., 64(24): 5117-5124.
El-Sebaii AA, Aboul-Enein S, Ramadan MRI, El-Gohary HG (2002). Empirical correlations for drying kinetics of some fruits and vegetables. Ener., 27(9): 845-859.
Filkova I, Choc M (1989). Drying research and development in czechoslovakia. Drying Technology: An Int. J., 7(2): 387-392. Garg HB, Sharma S (1990). mathematical modelling and experimental
evaluation of a natural convection solar dryer, Reading. UK.
Henderson SM (1952). A basic concept of equilibrium moisture. Agric. Eeng., 33(1): 29-32.
Heredia A, Barrera C, Andrés A (2007). Drying of cherry tomato by a combination of different dehydration techniques. Comparison of kinetics and other related properties. J. Food Eng., 80(1): 111-118. Lewicki PP (2006). Design of hot air drying for better foods. Trends in
Food Sci. Technol., 17(4): 153-163.
McBean D, McG (1976). Drying and processing tree fruit, CSIRO division of food research circular No 10.
Shinskey FG (1996). Process control systems. Application, design and tuning. McGraw-Hill, New York.
Simpson WT (1996). Method to Estimate Dry-Kiln Schedules and Species Groupings Tropical and Temperate Hardwoods. Forest Products Laboratory Research Paper FPL–RP–548. Forest Products Laboratory, MI, Wisconsin, US.
Souza W (1997). Drying cycle controller for controlling drying as a function of humidity and temperature, Google Patents.
Teeboonma U, Tiansuwan J, Soponronnarit S (2003). Optimization of heat pump fruit dryers. J.ournal of Food Eng.,ineering. 59: 369-377. Toor RK, Savage GP (2006). Effect of semi-drying on the antioxidant
components of tomatoes. Food Chem., 94(1): 90-97.
Unadi A, Fuller RJ, Macmillan RH (2002). Strategies for drying tomatoes in a tunnel dehydrator. Drying Technology: Int. J., 20( 7): 1407-1425.
Walker TH, Wilhelm LR (1995). Drying fruit with recirculated air for energy savings. Appl. Eng. Agric., 11(6): 861-867.