Original Research Article
Community diagnosis by conducting family health survey in the field
practice area of a medical college
Mizba Basheer Patel, Moniza Maheen, Fawwad M. Shaikh*, A. Chandrasekhar
INTRODUCTION
Community diagnosis refers to the identification and assessment of the health problems in a community in terms of mortality and morbidity rates and to identify individuals at risk or those who need medical attention.1 It is the evaluation of the health of people in a community to the surrounding environment and follow appropriate intervention. The purpose of it is to define an existing problem and determine available resources and set priorities for planning, implementing and evaluating health action for the community. It is also used to
understand the changing patterns of population and its varying needs and also identify high-risk populations. Intervention that is disease prevention, health protection, and health protection can be done based on evidence from the survey.
In a country like India, this has the second largest population in the world after China. Rural areas constitute about 70% of India's population where facilities for health care are far behind their urban counterpart.2 In a developing country like India, with limited resources, health needs of individuals and community are
ABSTRACT
Background: In a developing country like India, with limited resources health needs of individuals and community are enormously increasing. Health related problems may be addressed amicably by community diagnosis. Assessment and prioritization of health issues followed by formulation of action plans with strategies and their implementation can be effectively achieved, by using family health surveys.
Methods: Using family health survey 500 families, constituting 2640 individuals were studied. Their health status and socio-demographic details were taken. Households and families were selected randomly. Data entry and analysis was done by appropriate use of statistical tools.
Results: Study showed 52.27% males and 47.73% females. Majority (51.5%) belonged to 145 years followed by 6-15 years of age (25%). Among 9.09% of the under-five, fully immunized were 90.4% and partially immunized were 9.6%. 6.06% were above 60 years. Nuclear families were 68%. Majority (36%) of the families belonged to socio-economic class II (modified B.G. Prasad classification). 10.6% were illiterate and 11.3% were below seven years of age. Overcrowding was present in 24% of the families. Common morbidities were hypertension (32.2%), diabetes (26.9%), respiratory diseases (19.2%) eye problems (6.2%) and skin diseases (3.8%). Geriatric problems were present in one out of four individuals.
Conclusions: Family health survey can be used as an educational tool for undergraduate medical students to understand common morbidities and determinants of diseases in the community. Family health surveys are important for a community as necessary intervention can be done for illnesses and health-related problems.
Keywords: Community diagnosis, Family health survey, Morbidity profile
Department of Community Medicine, Deccan College of Medical Sciences, Hyderabad, Telangana, India
Received: 24 September 2019
Accepted: 11 November 2019
*Correspondence:
Dr. Fawwad M. Shaikh, E-mail: [email protected]
Copyright: © the author(s), publisher and licensee Medip Academy. This is an open-access article distributed under the terms of the Creative Commons Attribution Non-Commercial License, which permits unrestricted non-commercial use, distribution, and reproduction in any medium, provided the original work is properly cited.
enormously increasing which can be addressed amicably by community diagnosis. With passing years there is increasing in urbanization. People of all age groups are present in India so regular surveys are necessary. As a part of the Medical Council of India institutional goals, the undergraduate students before completing MBBS should have knowledge of basic management skills in the area of human resources, materials and resource management related to health care delivery.3 Exposure of medical students to field surveys helps them to understand and manage common diseases and nutritional problems that are present in a community. Assessment and prioritization of health issues followed by formulation of action plans with strategies and their implementation can be effectively achieved; by using family health surveys.
This paper describes a family health survey of 500 families constituting 2640 individuals. Their health status and socioeconomic status are considered. Their multiple factors are considered for example economic, social, cultural and environmental. Community surveys from different regions and various ethnic populations are important to formulate national consensus-driven policies to prevent the rising trend of non-communicable diseases.4 Community diagnosis is dependent on the collection and analysis of important information such as age and sex distribution, vital statistics rate and incidence and prevalence of the disease in an area. The focus is on the identification of basic health needs and health problems of the community.5
Objectives
The objectives of the present study were to assess socio-demographic details and the economic status of the community, to assess immunization, environmental, sanitation status of the community and to assess the common morbidity patterns of the area and take appropriate preventive measures by health education.
METHODS
Study area
The study was carried out in the urban field practice areas of a private medical college, Hyderabad.
Study design
A cross-sectional study with a survey approach was done.
Study period
40 undergraduate medical students of second year of two batches (20 from each batch) did the survey along with the help of a post-graduate, an intern and a medico-social worker, under the supervision of faculty during May 2019 to June 2019. Two undergraduates were assigned, 25
families. Each day two undergraduate students visited 5 families so they were able to cover 25 families in 5 days.
Study samples
A total of 500 families constituting 2640 individuals were surveyed altogether.
Study tools
A pre-designed pre-tested questionnaire was used and personal interviews were conducted. Information regarding age, sex, work, education, illness, immunization status of under-five children and pregnant women, anthropometry, housing, lighting, socioeconomic status, water supply, and sanitation were taken. Houses and families were selected randomly.
Data analysis
Data was entered in MS Excel, analyzed and summarized.
RESULTS
A family health survey for 500 families constituting 2640 individuals was done. 52.27% were males and 47.73% were females in the population and the sex ratio was 913. The majority of individuals (51.5 %) belonged to 16-45 years, followed by 6-15 years of age constituting 25% of the population. 9.09% of individuals belonged to less than five age group and 6.06% were above 60 years. Among 9.09% of the under-five, fully immunized was 90.4% and partially immunized were 9.6%. None were unimmunized. All 20 pregnant women in the population were immunized. 47.73% of individuals were married, 8.33% were unmarried, 3.79% were either widow or divorce and 40.15% were not eligible that is less than 21 years males and less than 18 years females. 10.6% of individuals were illiterate, 11.3% were below seven years of age, individuals who studied up to middle school constituted 29.54%, 32.57% individuals up to high school and 10.61% up to college. 1.52% of the population could only read or write some language and 3.79% population studied professional degree. 9.85% of individuals were skilled workers, 3.79% were unskilled workers, 7.57% were unemployed, 38.64% were not eligible, 2.27% were doing professional work, 12.12% of individuals were doing business and 1.52% were retired. 24.24% were housewives.
Table 1: Socio-demographic characteristics of study population.
Variables Categories Male Female Total
N (%) N (%) N (%)
Age group (in years)
<5 and =5 140 (5.30) 100 (3.79) 240 (9.09) 6-15 360 (13.64) 300 (11.36) 660 (25) 16-25 280 (10.61) 220 (8.34) 500 (18.95) 26-45 479 (18.16) 380 (14.39) 859 (32.55) 46-60 41 (1.53) 180 (6.82) 221 (8.35) >60 80 (3.03) 80 (3.03) 160 (6.06)
Marital status
Married 600 (22.73) 660 (25) 1260 (47.73) Unmarried 160 (6.06) 60 (2.27) 220 (8.33) Widow or divorce 0 100(3.79) 100 (3.79) Not eligible 620 (23.48) 440 (16.67) 1060 (40.15)
Literacy
Illiterate 120 (4.55) 160 (6.06) 280 (10.61) Primary and middle 380 (14.39) 400 (15.15) 780 (29.54) High school 460 (17.42) 400 (15.15) 860 (32.57) College 200 (7.58) 80 (3.03) 280 (10.61) Not applicable 160 (6.06) 140 (5.30) 300 (11.36) Read and write 0 40 (1.52) 40 (1.52) Professional 60 (2.27) 40 (1.52) 100 (3.79)
Occupation
Not eligible 540 (20.46) 480 (18.18) 1020 (38.64) Unemployed 140 (5.30) 60 (2.27) 200 (7.57) Unskilled 80 (3.03) 20 (0.76) 100 (3.79) Skilled 220 (8.33) 40 (1.52) 260 (9.85) Professional 60 (2.27) 00 60 (2.27) Business 320 (12.12) 00 320 (12.12) Housewife 0 640 (24.24) 640 (24.24) Retired 20 (0.76) 20 (0.76) 40 (1.52)
Total 1380 (52.27) 1260 (47.73) 2640 (100)
Table 2: Immunization status.
S. no. Immunization status Male children Female children Total Pregnant women
N (%) N (%) N (%) N (%)
1 Fully immunized 140 (58.33) 77 (32.07) 217 (90.4) 20 (100)
2 Partially immunized 00 23 (9.6) 23 (9.6) 00
Total 140 (58.33) 100 (41.67) 240 (100) 20 (100)
Table 3: Type of family, family size and socioeconomic class.
Number of families (%) Type of family
Nuclear 340 (68)
Joint 160 (32)
Family size
Up to 4 100 (20)
5 to 7 380 (76)
8 and more 20 (4)
Socio economic class
Class I 160 (32)
Class II 180 (36)
Class III 40 (8)
Class IV 40 (8)
Table 4: Housing conditions of families.
Housing conditions No. of families (%)
Type of house
Pucca 300 (60)
Mixed 200 (40)
Type of roof
Reinforced cement concrete 300 (60)
Asbestos 80 (16)
Tin 120 (24)
Number of rooms
1 40 (8)
2 120 (24)
3 220 (44)
4 60 (12)
5 60 (12)
Open space
Yes 300 (60)
No 200 (40)
Separate kitchen
Yes 460 (92)
No 40 (8)
Overcrowding
Yes 120 (24)
No 380 (76)
Water supply
Own 160 (32)
Public 340 (68)
Source of water
Tap 340 (68)
Bore well 120 (24)
Sanitary well 40 (8)
Storage of drinking water
Earthen pots 340 (68)
Plastic pot 100 (20)
Stainless steel 60 (12)
Excreta disposal
Sewerage system 500 (100)
Solid waste disposal
Public refuse bin 460 (92)
Open street 40 (8)
Latrine
Present 500 (100)
Liquid waste disposal
Sewerage system 500 (100)
Lighting
Artificial 500 (100)
Source of energy
Kerosene 40 (8)
Coal 20 (4)
Gas 440 (88)
60% of families were having a pucca house and the remaining 40% were having a mixed type of houses. The majority that is 60% of families had a reinforced cement concrete roof followed by a tin roof constituting 24% and 16% of families had an asbestos roof. Open spaces were
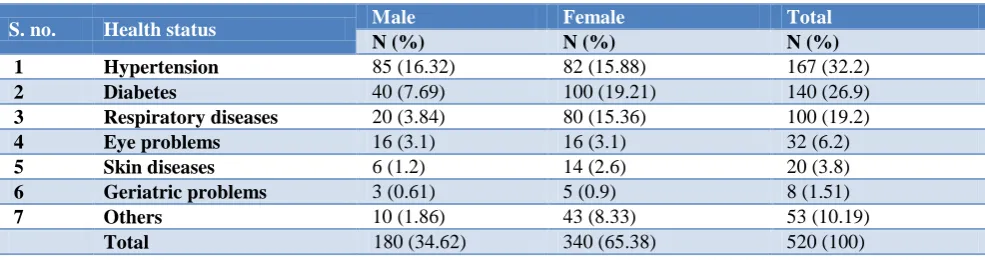
Table 5: Common illnesses, communicable and non-communicable diseases.
S. no. Health status Male Female Total
N (%) N (%) N (%)
1 Hypertension 85 (16.32) 82 (15.88) 167 (32.2)
2 Diabetes 40 (7.69) 100 (19.21) 140 (26.9)
3 Respiratory diseases 20 (3.84) 80 (15.36) 100 (19.2)
4 Eye problems 16 (3.1) 16 (3.1) 32 (6.2)
5 Skin diseases 6 (1.2) 14 (2.6) 20 (3.8)
6 Geriatric problems 3 (0.61) 5 (0.9) 8 (1.51)
7 Others 10 (1.86) 43 (8.33) 53 (10.19)
Total 180 (34.62) 340 (65.38) 520 (100)
Common morbidities were hypertension (32.2%), diabetes (26.9%), respiratory diseases (19.2%) eye problems (6.2%) and skin diseases (3.8%). Geriatric problems were present in one out of four (1.51%) and remaining other illnesses like genitourinary and gastrointestinal diseases constitute 10.19%.
DISCUSSION
The study done total male population is 52.27% and the total female population is 47.73% similar to a study done by Gandhi et al where the total male and female population were 54.7% and 45.3% respectively.6 The contrary study done by Pachori et al showed the total male population and female populations were 48.7% and 51.3% respectively and a study done by Ahmed et al showed the total female population was 50.6% and the total male population was 49.4%.7,8 Sex ratio in the study was 913, whereas the ratio was 943 in 2011 in the country, India as per National Health profile 2018 and sex ratio of Telangana state was 977 in urban population for the year 2015-2016 as per National Family Health Survey 4, State Fact Sheet Telangana.9,10 9.09% of individuals belong to <5 age group similar to Ahmed et al which showed 8.7% of individuals under-five age group.8 The majority of individuals that are 51.5 % belonged to 16-45 years similar to a study done by Pachori et al where 53% of individuals belong to 20 to 40 years of age group.7 6.06% were above 60 years similar to a study done by Gandhi et al where 5% of the population was above 60 years.6 Literacy in the population is 78.03% similar to study done by Gandhi et al where it is 76.4%, whereas overall literacy rate of India is 73%, in urban population is 84.1% and Andhra Pradesh in urban population is 80.1% as per Census 2011 in National Health profile 2018.6,9 Among the under-five children, 90.4% were fully immunized, 9.6% were partially immunized and none were unimmunized similarly to a study done by a study by Punith et al where fully immunized children were 92.10% and partially immunized was 6.58%, and unimmunized children were 1.31%.11
9.85% of individuals were skilled workers, 24.24% were housewives and 1.52% were retired in the study similar to a study done by Ahmed et al where skilled workers are
7.3%, housewife were 22.2% and retired individuals were 1.6%.8 Nuclear families were 68% and joint 32% in the study where as a study done by Gandhi et al; where nuclear families were 74% and joint families were 26% similarly even a study done by Shukla et al nuclear and joint families were 79.2 and 20.8 respectively.6,12 The majority of the families that are 36% belonged to socio-economic class II similar findings were present in a study done by Ahmed et al where 40% of families belong to socio-economic class II (modified B.G. Prasad classification).8 32% families belong to socio-economic class I followed by 16% families belong to class V similar findings were found in a study done by Pachori et al where 30% families belong to class I (upper class) and 18.7% belong to class V (lower class) socio-economic status.7
Common morbidities were hypertension (32.2%) similar to a study done by Das et al where the prevalence of hypertension in the urban population is 36.4% in 2003.14 Diabetes is present in 26.9% of the population in our study this is similar to a study done by Gladius et al where diabetes was present in 33.3%of the population.15
CONCLUSIONS
Family health surveys are important for undergraduate students as they help them in understanding common morbidities, determinants of diseases in the community. Students can learn from real-life situations and understand what people are facing in a community and so they will be able to make better decisions for the treatment and prevention of diseases. Family health surveys are important for a community as necessary intervention can be done for illnesses and health-related problems. Immunizations can be encouraged. Proper hand washing and hygiene can be encouraged. Early intervention of disease can be done so complications can be avoided by referring them to a hospital. Health education regarding environmental pollution can be done to avoid mosquito-borne illness, gastroenteritis and other communicable diseases can be prevented. Encouraging patients for the screening of illnesses can be done by educating them. So these family health surveys should be done regularly for huge populations and health camps should be arranged by the government to improve the health of the individuals
ACKNOWLEDGEMENTS
We would like to thank undergraduate students of second-year MBBS who were involved in the survey and helped us with data collection. We would also like to thank the families for cooperatively participating in the survey, medico-social worker and the faculty for the supervision.
Funding: No funding sources Conflict of interest: None declared
Ethical approval: The study was approved by the Institutional Ethics Committee
REFERENCES
1. Hale C, Shrestha IB, Bhattacharya S. Community Diagnosis Manual. 1st ed. Kathmandu, Nepal: Health learning and materials centre, T.U. Institute of Medicine; 1996.
2. Bera T, Sadhukhan SK, Premendran JS. A longitudinal study on Health expenditure in a rural community attached to Mahatma Gandhi Institute of Medical Sciences, Sewagram, Maharashtra. Ind J Public health 2012;56(1):65-68.
3. Graduate Medical Education regulations, Medical Council of India. Available at: https://www. mciindia.org/CMS/rules-regulations/graduate-medi cal-education-regulations-1997. Accessed on 2 September 2019.
4. Das SK, Sanyal K, Basu A. Study of urban community survey in India: growing trend of high prevalence of hypertension in a developing country. Int J Med Sci. 2005;2(2):70-8.
5. Park K. Park’s Textbook of Preventive and Social Medicine. 23rd ed. Jabalpur, India: Bhanot Publishers; 2015: 42.
6. Gandhi PA, Venkatesh U, Tiwari P, Doley P. Community diagnosis for a slum population under the field practice area of a government medical college, New Delhi: community-oriented primary care exercise for undergraduate students Int J Community Med Public Health. 2018;5(12):5404-12.
7. Pachori R. Drinking water and sanitation: household survey for knowledge and practice in rural area, Magudanchavadi, Salem district, India. Intl J Community Med Public Health. 2016;3(7):1820-8. 8. Ahmed SR, Hussain SF, Muslehuddin OM,
Muslehuddin HM, Mane S, Addepalli C. Family health survey: community diagnosis conducted in an urban field practice area of Hyderabad. Intl J Public Health Res. 2016;3(5):210-5.
9. National Health Profile, 2018 issue 13th. Available at: http://www.cbhidghs.nic.in/Ebook/National%20 Health%20Profile-2018%20(e-Book)/files/assets /common/downloads/files/NHP%202018.pdf. Accessed on 2 August 2019.
10. National Family Health Survey-4 2015-16, State Fact Sheet Telangana. Available at: http://rchiips .org/nfhs/pdf/NFHS4/TG_FactSheet.pdf. Accessed on 2 August 2019.
11. Punith K, Lalitha K, Suman G, Pradeep BS, Kumar JK. Evaluation of primary immunization coverage of infants under universal immunization programme in an urban area of Bangalore city using cluster sampling and lot quality assurance sampling techniques. Indian J Community Med. 2008;33(3):151-5.
12. Shukla M, Agarwal M, Rehman HM, Yadav K, Imchen T. Housing and sanitary conditions in slums of Lucknow, capital of Uttar Pradesh. Intl J Med Sci Public Health. 2016;5(06):1153-7.
13. Gelaw BK, Tegegne GT, Bizuye YA. Assessment of Community Health and Health Related Problems in Debre Markos Town, East Gojjam, Ethiopia, 2013. J Biosafety Health Educ. 2014;2(3):1-6.
14. Das SK, Sanyal K, Basu A. Study of urban community survey in India: growing trend of high prevalence of hypertension in a developing country. Int J Med Sci. 2005;2(2):70-8.
15. Gladius JH, Lakshmi PA, Vidya DC, Das B. A study on morbidity status of geriatric population in the field practice area of Karpaga Vinayaga Institute of Medical Sciences, Tamil Nadu, India. Int J Community Med Public Health. 2016;3(9):2575-8.