DEPARTMENT FOR EDUCATION AND SKILLS
EVALUATION OF NEW APPROACHES TO
WORK-RELATED LEARNING
TECHNICAL ANNEX
(Due to be published January 2002)CONTENTS
Chapter Page
I: INTRODUCTION ... 1
II: OUTCOMES AND MEASURES ... 2
Introduction ... 2
Overview and structure of tables ... 2
General points about table contents ... 3
Issues for each table ... 4
III: DATA COLLECTED ... 11
Introduction ... 11
Data collected from projects ... 11
SWA-generated variables ... 14
Calculated data ... 21
IV: ANALYTICAL TECHNIQUES ... 23
Introduction ... 23
Composition of the sample ... 23
Correlations ... 24
Significant differences ... 24
CHAID ... 25
Appendix
I: INTRODUCTION
101 This Technical Annex is a companion to the report by SWA Consulting entitled “Evaluation of New Approaches to Work-related Learning”. It contains detailed information on various technical aspects of the study. For ease of handling, it is presented as a separate document, but should be regarded as an integral part of the main report.
102 Section II of this Annex provides more detail on the outcomes and measures that we defined at the start of our study, and which represented a fundamental part of the aggregate (national and local) evaluation of the Action Research Projects (ARPs). Inter alia, the outcomes and measures provided a common framework against which all ARPs could be evaluated in a consistent manner.
103 As an essential part of the study, we have collected a large amount of data from students, schools and projects, by means of both student-completed questionnaires and management information data. This data has been recorded on a series of EXCEL spreadsheets, and SPSS databases1. Details of the principal data collected are summarised in Section III.
104 Finally, Section IV provides brief details of the statistical techniques used to analyse the data and produce the results summarised in the main report.
1
II: OUTCOMES
AND
MEASURES
I
NTRODUCTION201 As mentioned in the previous section, and also briefly in Chapter I of the main report, our evaluation framework included the design of outcomes and measures; these represented the definitions of outcomes to be measured and the associated data sources. This was an essential element of both the local and national evaluation process, as it provided:-
• a common framework that all ARPs could use;
• a consistent approach for the core elements of local evaluations; • a definition of the data to be recorded on the national database.
202 This section provides some detail on the outcomes and measures framework that was used.
O
VERVIEW AND STRUCTURE OF TABLES203 The outcomes and measures framework consisted of a set of ‘tables’, one for each of the four national objectives for the ARPs (see paragraph 104 of the main report). A near final draft of these tables was discussed with representatives of all projects at a workshop in London on 13th October 1998.
204 Following that workshop, final amendments were made to the detail of the tables, which were then issued to projects as one of a series of five guidance papers on various aspects of the evaluation. The remainder of this section is derived substantially from the relevant paper, as this represents the best guide to the final outcomes and measures framework used throughout the study. The tables themselves are included at the end of this section.
205 As can be seen, there was one table for each of the four National Objectives; this provided a transparent structure. The table relating to National Objective 3 (attendance and behaviour), however, was slightly different since two discrete items were represented: outcomes and measures for attendance are not the same as for behaviour. Accordingly, this table was split into two halves (headed 3A and 3B). 206 Each table was split into four columns: category, outcomes, measures, and sources of
data. The first of these is discussed below; the other three are hopefully self-explanatory.
207 The term ‘category’ related to three different types of outcomes and/or measures; each category was represented by a separate row in each table, differentiated by a solid line. The three categories used, and their descriptions, are as follows:-
• Category A (core). All projects had to provide data on the outcomes and measures in this category, and had to use the sources of data specified;
did identify some possible sources, but these were not intended to be prescriptive;
• Category C (discretionary). The items in this category represented those which would add value to local and national evaluations, but which were not an absolute requirement. It was left up to the discretion of projects as to whether or not they collected data on these outcomes and measures, and, if so, the sources of data to be used. Where such data was collected, however, it was still to be copied to SWA.
208 Although only category A data was core data, it was stressed that the national evaluation was not solely concerned with this data. Category B and C data – and any other data which local projects sought to collect (‘Category D’) – was also a key part of the national evaluation. Indeed, as set out in the previous paragraph, projects had to supply Category B data; and we also wished to receive any Category C (or D) data from projects, via, for example, termly or end of year reports.
G
ENERAL POINTS ABOUT TABLE CONTENTS209 Before discussing the points which are specific to each table, attention is drawn to some general points about table contents. A note is also added about the use of 'standard' research instruments.
210 Firstly, there were some natural pairings between the tables (or rather, the objectives to which they related). Thus:-
• Objectives 1 and 2 related to ‘softer’ items, whereas Objectives 3 and 4 related to ‘harder’ items. Accordingly, measures for the first pair tended to be more qualitative in nature, whilst those in the second pair were more quantitative; • Objectives 1 and 3 related to students’ behavioural aspects, whilst Objectives 2
and 4 related to their attainments. There was thus some overlap in outcomes or measures between the objectives in these pairings.
211 As a result of the second of the above pairings, there were a number of instances throughout the table where the same outcomes and measures could be used for both the objectives within the pair. Where this occurred, the detail of the item was included in normal typeface under the objective to which it was most directly relevant, and in
italics within [square brackets] under the objective to which it was of secondary or supporting relevance.
212 The second general characteristic related to the measures, and the use throughout the table of the phrase ‘compared to others’. This was used to indicate that the data for participating students (i.e. the project group) was to be compared with that for non-participating students, (i.e. the comparator group). The use of a comparator group was an important element in the evaluation.
213 Turning to the research instruments, reference was made under several of the objectives to a ‘national student questionnaire’. A questionnaire approach was considered to be the only practical way for projects to obtain much of the data, especially that relating to the more qualitative items. Where a national student questionnaire was indicated for a Category A item, all projects had to use a questionnaire to collect this data (from project and comparator groups) and this had to
214 A more relaxed position was taken on research instruments which had a relevance as a source of data for Category B and C items. The intention here was to leave considerable flexibility for local projects to adopt approaches that made most sense in the specific context.
I
SSUES FOR EACH TABLE215 Attention is now drawn to issues specific to each table, which have not been addressed by the more general points made above.
216 Objective 1. An item was included under this objective for timekeeping/lateness, on the grounds that being late for school was more an indicator of student motivation than their general attendance (the latter was covered under Objective 3).
217 Objective 2. Items under this objective were those which related primarily to the skills, knowledge and understanding that students acquired which would help them in the post-16 world and enhance their employability. Relevant outcomes also included non-academic attainments which were not accredited, but which might or might not have been rewarded by certificates (certified attainments are included under Objective 4).
218 Objective 3. There were a number of specific issues under this objective:-
• there was a Category A item requiring data on authorised and non-authorised absences. This data had to be split between on-site and off-site activities. The very nature of ARPs suggests that there could, or debatably even should, have been differences between attendance at school and, for example, attendance whilst on work placements;
• here, as elsewhere, it was essential to interpret data from special schools with care;
• since not all schools adopt the same discipline regime at the level below fixed duration exclusions, a single heading of ‘other discipline sanctions’ was used. It was included as a Category B item.
ACTION RESEARCH PROJECTS OUTCOMES AND MEASURES
National Objective 1 : To improve motivation and attitudes
CATEGOR Y
OUTCOMES MEASURES DATA SOURCES
A 1.1 [Improved attendance and reduced exclusions]
1.2 Students with improved motivation and attitudes towards school, who
recognise the future benefits of coming to school
1.1 [See 3A.1 and 3B.1 under National Objective 3]
1.2(a) Perceptions of project group, compared to others, regarding:-
(i) importance and relevance of the National Curriculum;
(ii) importance and relevance of school;
(iii) their post-16 career plan; (iv) steps necessary to realise their
career plan, including achievements at KS4;
(v) completion of tasks (e.g. homework), on time; (vi) desire to achieve at KS4;
(vii) self-confidence and self-esteem;
(viii) the importance of good behaviour
and attendance.
1.2(a) Core questions in national student questionnaire, carried out (at least) at baseline and final stages
B 1.2(b) Views and perceptions of other key players (teachers, parents, employers, mentors, opportunity providers, etc) on (i) to (vii) above
1.2(b) Up to projects/schools to determine, but options include surveys, interviews, focus groups, carried out at baseline and final
C 1.3 Improved timekeeping
1.4 Improved effort grades
1.3 Percentage of project group late for school sessions, compared to others.
1.4 Percentage of project group with less than satisfactory effort grades, compared to others.
1.3 School records
1.5 Improved learning habits 1.5 Percentage of project group with
improved homework records, compared to others
ACTION RESEARCH PROJECTS OUTCOMES AND MEASURES
National Objective 2 : To increase skills and knowledge
CATEGOR Y
OUTCOMES MEASURES DATA SOURCES
A 2.1 [Increased numbers of non-GCSE attainments]
2.2 Enhanced knowledge, understanding and skills which will assist students post-16.
2.1 [See 4.2 under National Objective 4]
2.2(a) Project group students’ knowledge and understanding of, and skills in, compared to others:
(i) decision making ability; (ii) their own strengths and
weaknesses; (iii) key skills;
(iv) post-16 opportunities and routes; (v) attributes and skills sought by
employers;
(vi) the (local) labour market and potential job opportunities
2.2(a) Core questions in national student questionnaire, carried out (at least) at baseline and final stages.
B 2.2(b) Views and perceptions of other key players (teachers, parents, employers, mentors, opportunity providers etc.) on (i) to (vi) above
2.2(b) Up to projects /schools to determine, but options include surveys, interviews, focus groups, carried out at baseline and final.
C 2.3 Increased numbers of other evidenced achievements.
2.3 Number of other ‘certificates’, e.g. for sport, music, Duke of Edinburgh awards etc.
ACTION RESEARCH PROJECTS OUTCOMES AND MEASURES
National Objective 3A : To improve attendance
CATEGOR Y
OUTCOMES MEASURES DATA SOURCES
A 3A.1 Reduced number of authorised and non-authorised absences.
3A.2 Improved students’ perceptions of the importance of good attendance]
3A.1 Percentage of half-days lost on authorised and non-authorised absence (separately), compared to others, split between:-
(i) on-site provision (in school) (ii) off-site provision (not in school)
3A.2 [See 1.2(a) (viii) under National Objective 1]
3A.1 School records, including those from off- site provision
C 3A.3 Reduced incidences of regular attendance
3A.3 Frequency of occurrence of authorised and non-authorised absence:-
(i) on certain days of the week;
(ii) seasonal (e.g. towards end of summer term)
(iii) immediately after off-site experiences (e.g. work experience placements)
ACTION RESEARCH PROJECTS OUTCOMES AND MEASURES
National Objective 3B : To improve behaviour
CATEGOR Y
OUTCOMES MEASURES DATA SOURCES
A 3B.1 Reduced number of formal discipline procedures invoked
3B.2 [Improved students’ perceptions of the importance of good behaviour]
3B.1(a) Proportion of project group student days lost, compared to others, due to:-
(i) permanent exclusions (ii) fixed duration exclusions
(Also see Category B item below)
3B.2 [See 1.2(a) (viii) under National Objective 1]
3B.1(a) School records
B 3B.1(b) Number of other discipline
sanctions (e.g. detentions, on report etc.) imposed
3B.1(b) School records
C 3B.3 Improved perceptions of student behaviour
3B.3(a) Assessments of student behaviour by teachers
3B.3(b) Views and perceptions of other key players (parents, employers, mentors, opportunity providers, etc.) on student behaviour
ACTION RESEARCH PROJECTS OUTCOMES AND MEASURES
National Objective 4 : To raise attainment
OUTCOMES MEASURES DATA SOURCES
A 4.1 Improved GCSE results
4.2 Increased numbers achieving other KS4 certified attainments
4.3 Reduction in ‘zero attainment’
4.4 Improved value added
4.1 Average total KS4 point score per project group student, compared to others, to include GNVQ equivalents
4.2 Number of project group students
compared to others achieving awards at, or units towards NVQs or Key Skills, or achieving units towards GNVQs.
4.3 Percentage of project group students, compared to others, with no certified academic attainment at the end of KS4
4.4 Average ‘distance travelled’ by project group students, compared to others, in terms of their KS3 score and their average total point score at KS4.
4.1 School records, as required for DfES tables.
4.2 School records
4.3 School records
4.4 School records
C 4.5 Improved attainment by reference to other usable measures
4.5 Project group students’ improvements, compared to others, by reference to, for example:-
(i) Cognitive Ability Tests (ii) Reading Age tests (iii) YELLIS data
(iv) Student actual achievements at KS4 compared to teacher predictions
(v) Actual achievement at KS4 compared to students' action plan
III: DATA
COLLECTED
I
NTRODUCTION301 In this section, we provide a brief description of the main data collected and the methods used for its collection. We also describe how we have defined and recorded other variables that we have used in the subsequent analysis.
302 The headings used are therefore:- • data collected from projects; • SWA-generated variables; • calculated data.
D
ATA COLLECTED FROM PROJECTS303 Throughout the two-year life of the projects, we have collected management information data at three main points:-
• the start of the projects (baseline data);
• the end of the first year of the projects (i.e. summer 1999, ‘interim data’); • the end of the second year of the projects (i.e. summer 2000, ‘final data’).
304 The vast majority of data collected was that which schools were already required to collect for other purposes, such as inclusion in the national school performance tables. The data related to three main sets of students:-
• average data for whole year cohorts;
• data on individual students in project groups; • data on individual students in comparator groups.
305 Data on individual students has been collected and recorded by means of unique Pupil Identification Numbers (PINs). These PINs had four elements:-
• a number for each project;
• a number for each school within each project; • a number for each student within each school;
• an alphabetical label to identify whether the student was in a project or comparator group.
307 The data collected and recorded was, broadly, the same at each of the three points (paragraph 303) and for the three groups of students (paragraph 304). This primarily consisted of:-
• KS3 scores. These were recorded as the average level (1 to 8) of the available test results (only) across the three subjects. Where no test results were available for a student, schools were asked to supply the relevant data based on teacher assessment scores;
• levels of authorised and unauthorised absence. These were recorded as the percentage of available sessions missed for each type of absence. For project group students in the interim and final data, both types were also split between available sessions at schools and available sessions at any off-site provision (e.g. time spent on placement at an employer);
• KS4 results. The principal data here related to the total point score (for an individual student) or the average total point score (of a year cohort) at KS4 examinations. Points were allocated and scores aggregated using the method adopted by DfEE for calculating such scores in the ‘value added pilot schools’ at summer 1999. Data was also collected on other KS4 achievements (partial GNVQs, whole or part NVQs, Key Skills), and whether no accredited KS4 result was achieved;
• post-16 destinations. These were based, wherever possible, on the destinations recorded in the careers service annual surveys of school leavers. The categories of destinations were also based on those used in these surveys, but with some aggregation of categories.
308 SWA devised, and projects and schools were required to use, a series of data collection pro formas. All of these were required to be submitted to SWA at certain times during the two years of the study.
309 In addition to this hard quantitative data, projects were asked to collect softer qualitative information from students by means of a set of core questions for inclusion in questionnaires to be completed by students. Projects or schools were encouraged to incorporate these into local questionnaires that were part of their local evaluation strategies. In practice, very few projects added additional questions, and thus most questionnaires consisted of only the SWA-devised questions.
310 The questionnaires were to be administered to students at two points in the life of the projects: once as close to the start of project as possible (the baseline questionnaire); and once as close to the end of the project as possible (the final questionnaire). In practice, due to either unavoidable delays or pragmatic reasons, most questionnaires were administered:-
• between November 1998 and January 1999 for the baseline version; • between March and April 2000 for the final version.
Early leavers and non-completers
312 In the early stages of projects, individual students who decided not to continue in a project group (or who were unable to continue in a comparator group) were treated as follows, as far as data recording was concerned:-
• leavers before the end of February 1999 were replaced, where possible, with alternative students for whom baseline data was supplied. Such leavers therefore do not appear as part of any statistics on leavers obtained from our database;
• leavers after the end of February 1999 were not replaced for the purposes of our database (but may have been replaced by projects to make good use of the planned and available opportunities). Leavers after this date will therefore have been classified on our database as non-completers.
313 The choice of end-February 1999 for the cut-off date was for two main reasons:- • many projects did not start effectively until well into the autumn term 1998, and
often after the half term break. The end of February 1999, therefore, represented an elapsed time of only one term since the start of the project – a not unreasonable settling-in period;
• however, one term represented about 20-25% of the total time available for project delivery. To accept replacements any later than the end of February 1999 would raise significant doubts about a ‘two-year programme’ being received by the students concerned.
314 We would note that, where replacements were effected before the cut-off date, many projects transferred students from the comparator group into the project group. This assisted both data capture for the ‘new’ project group student (for whom data had previously been supplied as a member of the comparator group) and also reduced time pressures on finding a replacement.
315 During the course of the projects, it became apparent that a significant number of students were ‘leaving’ the projects early – in the sense that they were no longer participating in the curriculum enhancements available via the projects. Whilst such students, their schools, and sometimes project managers, did not necessarily recognise this as ‘leaving’ (particularly as they did not leave school), nevertheless such students did not complete the full course of the projects, and are thus perhaps best referred to as non-completers.
316 Because of the emerging number of non-completers, in May 2000 we asked projects to supply a ‘reason for leaving’ code for each non-completer who left after end-February 1999 (see paragraph 313 above). The possible codes were as follows:- • code 1: left project in ‘a positive spirit’ in order to re-engage with mainstream
school activity. Four sub-codes were then added:-
- A: entirely the student’s own decision;
- B: decision influenced principally by project staff;
- C: decision influenced principally by other teachers (i.e. from outside of the project team);
• code 2: left project in ‘a negative spirit’. Two sub-codes were then added:-
- A: directed to leave (e.g. following unacceptable behaviour or poor attendance);
- B: student opted out, or did not turn up any more, although not directed to leave;
• code 3: left project due to significant personal, family or other non-project-related reasons;
• code 4: other reason (to be specified) or don’t know.
SWA-
GENERATED VARIABLES317 The data described above was all generated and supplied by participating schools. During our fieldwork visits to the projects and as the project proceeded into the second year, it became apparent that the different structures of, and approaches to, the projects might be having a differential impact on the outcomes being achieved by students.
318 This was always likely to be the case; indeed, it was one of the underlying reasons for evaluating the different models that were being ‘action researched’ in the study. However, we considered it important to try to capture these differences in a structured and, as far as possible, objective way. We therefore devised a series of other variables for collection – the SWA-generated data.
319 Whilst in general these variables sought to describe the differences between projects and participating schools, nevertheless there were some instances where there were variations (within the variables) between students at the same school. For example, in a few projects, students were offered a work placement opportunity with either an employer or a training provider, or possibly an FE College. Accordingly, the values for the variables have been recorded on our database against individual students, although in practice most of the variables are common to all students in the same group, and have therefore been collected at school (or even project) level.
320 The variables were of two main types:-
• contextual: those that describe (in part) the circumstances of the school and how project group students were selected for the project;
• enhancement: those that describe the nature of the enhanced work-related learning that the project students – and only the project students – received during the project. All of these variables except two (see paragraphs 333 and 342) were recorded separately in relation to the first and the second year of the projects.
321 The following paragraphs describe each of the variables used, and the possible coding values ascribed to each.
Contextual variables
323 Area. This sought to capture the principle socio-economic characteristics of the catchment area of the schools. The possible codes were for areas displaying the
typical characteristics of:-
• an inner city/large conurbation: code 1; • an outer city area: 2;
• a small city/large town: 3; • mixed urban/rural: 4; • rural: 5.
324 School circumstances. This variable captured the extent to which there were major external circumstances that could have a significant influence – probably disruptive – on the general running and management of the school. The codes were:-
• no such external circumstances: code 1;
• ‘quality’ circumstances, such as where a school was in special measures or had serious weaknesses (following an OFSTED report) for most of the two years: 2;
• ‘reorganisation’ issues, either where the school itself was being reorganised (e.g. merger with another school) or where changes to a neighbouring school had a similar effect on the school concerned: 3;
• multiple circumstances, i.e. both quality and reorganisation issues: 4.
325 Student selection. We used two variables to try and capture this important item. In practice, it has sometimes been difficult for us – and, indeed, some project staff – to define the actual selection processes used within a few defined options. Accordingly, we have on occasions used our professional judgement as to which code applies, based on discussions with project staff and all the information available to us.
326 The first variable defined the ‘principal reason’ for selection. In practice, several projects used multiple reasons for including students within the project group; we have sought wherever possible to identify the main reason as actually used in practice (which might be different from that which was originally intended). The possible codes used were:-
• students displaying ‘disaffection’ (poor motivation, low aspirations) or where selection was genuinely an equal mix of this reason, poor behaviour, and low attendance: code 1;
• students displaying poor behaviour: 2; • students with low attendance record: 3;
• students grouped together in a year or tutor group on the basis of option choices made at the end of Year 9. In some schools, this is equivalent to ‘streaming’ but this is not necessarily the case in all instances: 4;
327 The second variable defined the ‘principal basis’ for the selection decisions, in terms of the information used for that decision. The possible codes here were:-
• primarily based on subjective information: code 1; • primarily based on objective information: 2;
• eligible students chose to participate in the project: 3.
328 Student numbers. We thought that the number of students involved – either in total in a project, or from any individual school – might be an important variable. The size of the group might have an influence on the development or otherwise of a number of personal and inter-personal skills. We thus recorded two variables to capture this item, based on the number of students involved at the start of the projects.
329 For the number of students in a project group, the following codes were used for all students in that project:-
• between 10 and 20 students: code 1; • between 21 and 30 students: 2; • between 31 and 40 students: 3; • between 41 and 50 students: 4; • between 51 and 60 students: 5; • 61+ students: 6.
330 For the number of students in each project from an individual school, the following codes were used for the students from that school:-
• between 1 and 5 students: code 1; • between 6 and 10 students: 2; • between 11 and 15 students: 3; • between 16 and 20 students: 4; • between 21 and 25 students: 5; • between 26 and 30 students: 6.
331 Gender and KS3 scores are also treated as contextual variables in the analysis carried out for Chapter IX of the main report,
Enhancement variables
333 Differences between years 1 and 2. This first variable indicates whether there were significant differences between the enhancement received in year 1 to that received in year 2.
The codes used here were:-
• only a one-year project: code 1;
• broadly the same enhancement each year: 2; • one variable different between the years: 3;
• two or more variables different between the years: 4.
334 Location of enhancement. This variable describes the location of the principal component of the enhancement. The codes used were:-
• FE College: code 1; • employer: 2; • training provider: 3; • school: 4;
• varied by student (where students at the same school could go to different locations for the enhancement): 5.
335 The code relating to school under this heading was only used where project group students received an alternative input to their curriculum that was delivered primarily on their school site (but not necessarily delivered by teachers).
336 Days per week. This variable records the typical number of days per week on which the students received the enhancement. Occasional weeks where the enhancement was not received (e.g. preparatory weeks at the start of the project) and the whole of the summer term in year 2 were ignored. Only the time spent on activities that were
exclusively available to the project students were recorded. Codes were not used for this variable; the actual typical number of days were recorded, to the nearest quarter day (in one project, students received the enhancement for half a day every fortnight). 337 Single or multiple enhancement. This variable records whether the enhancement
consisted of either one activity only (e.g. 1 day per week on employer placement), or more than one activity (e.g. 1 day per week employer placement plus a half-day taster at an FE College). For the second option, each component needed to be significant and occur for the majority of the year, rather than being a one-off activity. The codes used were:-
• single activity only: code 1; • more than one activity: 2.
• ‘academic mentoring’, where the principal focus of the mentoring was to monitor student progress in their enhancement and school activities and to support and encourage students to reach their full potential;
• ‘social mentoring’, where the principal focus was to support and assist students with personal and/or family difficulties in facing up to and (hopefully) resolving those problems.
339 The codes used were:-
• did not use mentors: code 1;
• used academic mentors, mainly drawn from school/college/LEA personnel: 2; • used academic mentors, mainly employer/training provider/other community
personnel: 3;
• used academic mentors, roughly equal mix of previous two types: 4;
• used additional structured student support arrangements (social mentors): 5. 340 Curriculum adjustment. This variable sought to describe how schools handled
adjustments to students’ normal curriculum, as a result of being out of school on some form of placement during the enhancement. Two codes were used here:-
• withdrawal/removal basis. The enhancement took place as and when it was possible or convenient (e.g. every Wednesday), so the student missed all timetabled lessons on those days and no structured arrangements existed to allow students to ‘catch up’ the missed lessons: code 1;
• integrated basis. Either structured arrangements were in place to allow students to ‘catch up’ on lessons missed due to the enhancement; or the enhancements were part of the timetabled options throughout the year. Thus students did not miss any other National Curriculum lessons: 2.
341 Use of residentials. Some projects included a residential event (i.e. involving at least one overnight stay) as part of the enhancement activities. This variable records whether this occurred or not, using the following codes:-
• residential events not used: code 1;
• one or more residential events during the year: 2.
342 Financial incentive. This final variable – which was only recorded for the project as a whole, not separately for each year – records whether some form of financial incentive (e.g. gift token) was available to project students for achievement of certain targets (e.g. percentage attendance). The availability of such an incentive, not its actual award, was recorded. The possible codes here were:-
• financial incentive not available: code 1; • financial incentive available: 2.
particular aspects appear to be more influential than others in terms of the outcomes achieved by students during the projects.
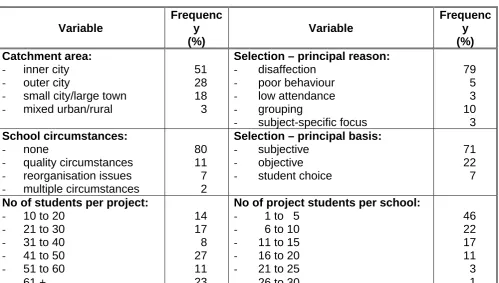
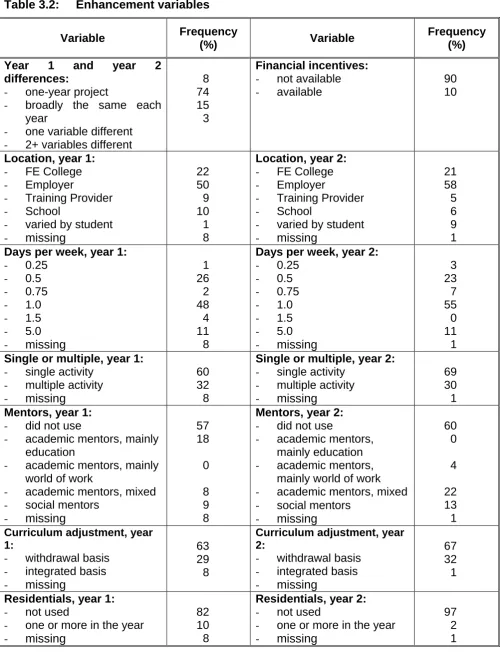
344 In order to give a flavour of the occurrence of the different variables across the projects, the following tables summarise the frequency of codes within each variable
at school level. The figures represent the percentage of all schools across the 21 projects (there were actually 100 schools involved in total). Within these tables, it should be noted that:-
• missing data for year 1 variables relates exclusively to schools in one year projects (such data has been recorded against year 2 variables);
[image:21.595.49.549.268.551.2]• missing data for year 2 variables relates exclusively to schools that dropped out of projects at the end of year 1.
Table 3.1: Contextual variables
Variable Frequenc y (%) Variable Frequenc y (%) Catchment area:
- inner city
- outer city
- small city/large town
- mixed urban/rural
51 28 18 3
Selection – principal reason:
- disaffection
- poor behaviour
- low attendance
- grouping
- subject-specific focus
79 5 3 10 3 School circumstances:
- none
- quality circumstances
- reorganisation issues
- multiple circumstances
80 11 7 2
Selection – principal basis:
- subjective
- objective
- student choice
71 22 7
No of students per project:
- 10 to 20
- 21 to 30
- 31 to 40
- 41 to 50
- 51 to 60
- 61 +
14 17 8 27 11 23
No of project students per school:
- 1 to 5
- 6 to 10
- 11 to 15
- 16 to 20
- 21 to 25
- 26 to 30
Table 3.2: Enhancement variables
Variable Frequency
(%) Variable
Frequency (%) Year 1 and year 2
differences:
- one-year project
- broadly the same each year
- one variable different
- 2+ variables different
8 74 15 3
Financial incentives:
- not available
- available
90 10
Location, year 1:
- FE College
- Employer
- Training Provider
- School
- varied by student
- missing
22 50 9 10 1 8
Location, year 2:
- FE College
- Employer
- Training Provider
- School
- varied by student
- missing
21 58 5 6 9 1
Days per week, year 1:
- 0.25
- 0.5
- 0.75
- 1.0
- 1.5
- 5.0
- missing
1 26 2 48 4 11 8
Days per week, year 2:
- 0.25
- 0.5
- 0.75
- 1.0
- 1.5
- 5.0
- missing
3 23 7 55 0 11 1
Single or multiple, year 1:
- single activity
- multiple activity
- missing
60 32 8
Single or multiple, year 2:
- single activity
- multiple activity
- missing
69 30 1
Mentors, year 1:
- did not use
- academic mentors, mainly education
- academic mentors, mainly world of work
- academic mentors, mixed
- social mentors
- missing
57 18 0 8 9 8
Mentors, year 2:
- did not use
- academic mentors, mainly education
- academic mentors, mainly world of work
- academic mentors, mixed
- social mentors
- missing
60 0 4 22 13 1
Curriculum adjustment, year 1:
- withdrawal basis
- integrated basis
- missing
63 29 8
Curriculum adjustment, year 2:
- withdrawal basis
- integrated basis
- missing
67 32 1
Residentials, year 1:
- not used
- one or more in the year
- missing
82 10 8
Residentials, year 2:
- not used
- one or more in the year
- missing
C
ALCULATED DATA345 In addition to the data received from projects and the SWA-generated variables, we have also calculated additional pieces of data for each student. This data, which was mainly derived from the project-supplied data, seeks to provide measures of ‘value added’ for each project group student.
346 In calculating this data, we have focused on the quantitative elements that seek to represent the primary objectives of the projects – improving KS4 achievements, improving attendance and positive post-16 destinations.
347 This data specifically seeks to measure some aspect of ‘value added’. Any measure of absolute achievement – such as actual KS4 results achieved – cannot provide any sense of progress for the project students, as it takes no account of the students’ starting point, or the achievement of other comparable students. We therefore believed it important to calculate measures of the project students’ achievements relative to that of some other group.
348 We would also note that project students were specifically and deliberately not paired with comparator group students. One-on-one comparisons are therefore not possible – and rightly so. It is highly unlikely that we could say with any certainty that one project group student and one comparator group student were starting from the same position.
349 The value added measures are now described in more detail.
350 KS4 achievements. For three years now, DfES has been producing data, as part of the annual school performance tables, on the value added between KS3 and KS4. We have used this data in calculating our first measure of value added from the projects.
351 The DfES data produces a median line of total KS4 points achieved against the KS3 results achieved two years previously, based on data for individual students. Each point on the line represents the median2.
352 For each of the project students, we have therefore compared their actual KS4 point score against the median value on the line for their individual KS3 level achieved. We have then recorded the result of student point score less median line point score. A positive figure means that the student has done better than the national median, and a negative figure that the student has done worse.
353 Attendance. Improving student attendance was an important objective for projects; it is, therefore, important to examine the value added in this area. However, there are two main difficulties in seeking to measure this.
354 First, for the reasons stated earlier, it is not possible to compare data for individual students. Comparisons therefore need to be made for individual project students with the average for groups of students. Two such groups exist within the projects: the comparator groups (which of course exclude the project students) and the school year cohort (which includes the project students). Because some projects were not able to specify a sufficiently robust comparator group, we have used data from both groups for comparison purposes.
2
355 The second difficulty lies in defining the value added measure. Absolute data (e.g. absence levels in Year 11) in isolation cannot provide a sufficiently reliable measure, nor is it straightforward to define a measure of change – not least because there will be a general level of change in the rate of absence of all students as they move through the school.
356 We have therefore calculated three measures for the project students, all based on rates of unauthorised absence from school. We believe that this gives a better measure than either authorised absence rates or total absence rates. In addition, rates of absence from project activities cannot be compared with either the comparator group or year cohort, who did not have the opportunity for such activities. The three measures are:-
• change in rate between Year 9 and Year 10 (thus looking at the effect of the first year of the projects);
• change in rate between Year 10 and Year 11 (the second year of the projects); • change in rate between Year 9 and Year 11 (the total duration of the projects). 357 For all three measures, we have then compared the change in rates with the same
figures for the average of the comparator group, and calculated the difference between the project student figures and the comparator group figures. We thus have calculated three figures to represent value added on attendance.
358 Post-16 destinations. Whilst not one of the national objectives, it is apparent that the projects have, through the enhancements, sought to raise the knowledge and understanding of project students about the possible post-16 routes they could follow. Given that many – but by no means all – of the project students might have been expected to be ‘lost to the system’ after leaving school, a more positive destination would be a highly desirable outcome.
359 However, it is not possible to define a value added measure for this item. The actual destination of a single student cannot be compared with the ‘average’ destination of either the comparator group or year cohort. So we have devised a single, simplified measure for the destinations of the project students, by reference to whether it can be seen as a positive (desirable) or negative (less desirable) choice. We acknowledge that this is not strictly a value added measure, but we consider it is the best measure than can be used.
IV: ANALYTICAL
TECHNIQUES
I
NTRODUCTION401 In this section, we present a brief summary of the main analytical techniques used in examining the available data. It is the results from this analysis that are reported in the main report.
402 As discussed earlier in this annex, all data has been incorporated into SPSS databases. The in-built analysis functions within SPSS have then been used to analyse the data. The items described here are:-
• correlations;
• significant differences;
• CHAID.
403 First, however, we provide a brief description of the sample we have created for the purposes of our analysis.
C
OMPOSITION OF THE SAMPLE404 As described in Section III of this Annex, the data collected during the study has come from a number of sources. The principal ones are:-
• student responses to the two questionnaires; • management information collected from projects;
• the SWA-generated variables, describing the project contexts and the nature of the project enhancements.
In addition, there is data that we have calculated from the above data, such as the value added data (derived from the management information).
405 In order to carry out our analysis, we have created a single database of all the relevant information, using the unique student PIN numbers to link the relevant data. Of course, not all the data is complete – not only within any one type of data but also between the various data types. The main limitation relates to the student questionnaires, where responses to both questionnaires were missing for many students.
407 As part of the process of constructing the project group composite file, we also have a file for all students – project and comparator group – with questionnaire, management information and value added data, but again limited to those who completed both questionnaires. This file consists of records for 409 project group students (as above) and 341 comparator group students. This file is the one from which comparator group data in Chapter IX of the report is drawn.
C
ORRELATIONS408 In several instances – especially when considering the effect of individual variables on the measures of value added – we have used bivariate correlation to test for relationships between variables. This test seeks to identify whether there is an association between two variables such that it is possible to predict the change in one variable from a given change in the other. A valid association between the two variables is likely to exist when the correlation co-efficient is high (approaching either +1 or –1) and there is a low significance level, or p-value, typically less than 0.05 (this measures the probability of obtaining results as low as the one observed).
409 The correlation tests assume that the underlying data are normally distributed, and tests for a linear association between the two variables. Where the correlation co-efficient is low and/or the p-value is high, this does not mean that there is no relationship between the variables, but only that there is not a linear relationship between them. In most of the correlation tests carried out on this data, we have been looking for linear relationships.
S
IGNIFICANT DIFFERENCES410 One of the main tests carried out has been to examine the data for statistically significant differences between responses to the questionnaire, primarily between project group and comparator group responses. We have also examined some data for differences in responses between males and females.
411 Two different tests have been carried out:-
• for data at the same point in time (e.g. project and comparator group responses at the baseline), we have used the Independent-Samples T Test. Essentially, this test compares means for the two groups of cases and, if there is a low significance level (p-value typically less than 0.05), this indicates that there is a significant difference between the two groups of means. If the 95% confidence interval for the mean difference does not contain zero, this also indicates that the difference is significant. However, even if the p-value is low, it is not possible to conclude that there is a significant difference if the 95% confidence interval does include zero;
412 One important caveat must be made immediately about both of the above T-Tests. The raw data on the questionnaires is available as qualitative responses, such as “very important, important, not important, or not at all important”. For recording on the database, responses such as these are converted into numerical scores, in this case from 1 to 4. The highest score is allocated to the preferred/most desirable response (which will depend on the precise wording of individual questions, but this approach has been consistently adopted).
413 The T-Tests are based on the assumption that the range of 1 to 4 includes equal gaps between each score – so a change from 1 to 2 produces an identical difference as a change from 3 to 4. However, this cannot automatically be assumed to be the case; no guidance was given to respondents as to the size of the ‘gaps’ between the possible responses. In practice, many respondents will probably have implicitly assumed equal gaps, but others may not have. Accordingly, T-Tests cannot be relied on to provide definitive indications of significant variations unless the equality of differences between scores is a valid assumption.
414 Subject to the above important caveat, the T-Tests provide statistical evidence for significant variations in response; however, they cannot indicate the ‘direction’ of any change (e.g. whether responses have improved over time or not). This can only be done by an examination of the underlying data, which is summarised in the tables in the main report.
415 This is particularly the case for changes over time. For example, it may be that, in a group of 250 students, responses from 100 stayed the same, 100 improved slightly and 50 deteriorated quite a lot. The T-Test might produce a result that indicates no significant variation, but this might not be the case for this data. It may be that a greater number of responses have improved only marginally because there was only a marginal room for improvement, (i.e. their initial response equated to a score of 3 and their final response to the maximum score of 4). Where the T-Test suggests that there are significant variations, we have therefore also produced cross-tabulations for the responses, to review the ‘shape’ of the responses.
CHAID
416 The SPSS analysis tool AnswerTree is a computer learning system that creates classification systems displayed in a decision tree. The method used in the software is based on the CHAID (Chi-squared Automatic Interaction Detection) algorithm. We have used this method in determining which variables have the most impact on the value added measures (see Section III).
417 The underlying purpose of AnswerTree is to examine the available data and discover important groupings of cases. It enables the user to identify the key variables that identify group membership, and from this to formulate rules for making predictions about the group membership of new cases. It is the type of tool that is used, for example, by financial institutions to predict likely loan defaulters by reference to the historical data of existing users.
values of those variables for each branch, and the number and values of the original sample that remain within each branch.
419 As well as defining the target variable (the root node) and the variables to be considered in the analysis, the user can specify rules for growing the tree. In all our analysis, the main rules we have used (due to the total sample size we have available) were:-
• a maximum of three branches in each tree;
• not splitting nodes with less than 50 cases in them;
• not splitting nodes if any one of the resulting branches would have less than 20 cases in them.
420 In addition to the visual ‘tree’, AnswerTree also provides:
• a statistical summary of the gains made at each node (by reference to the root node) and whether these add to or detract from the initial sample average; • an estimate of the risk (and its standard error) of misclassification, based on
APPENDIX
SUMMARY OF RESPONSES TO THE STUDENT
QUESTIONNAIRES
I
NTRODUCTION1. This appendix provides summaries of the responses to the core questions (see paragraph 309 of this Annex) in the student-completed questionnaires administered near the start of projects (‘baseline questionnaires’) and around Easter 2000 (‘final questionnaires’). The timing of the administration of the questionnaires is explained in paragraph 310.
2. As discussed in the main report, there were significantly less completed questionnaires available at the final stage than at the baseline stage. The total number of responses to each question were, typically,1 1,400 at the baseline (project and comparator groups combined) and 816 at the final stage. 750 students completed both questionnaires. These latter students make up what we call ‘complete data’ in this appendix.
3. We therefore provide four summaries of responses in this appendix:-
• for all students that completed the baseline questionnaire (‘baseline – all available responses’);
• for all students that completed the final questionnaire (‘final – all available responses’);
• responses to the baseline questionnaire for only those students who also completed the final questionnaire (‘baseline – complete data only’);
• responses to the final questionnaire of only those students who also had completed the baseline questionnaire (‘final – complete data only’).
4. For the purposes of measuring change over time, it is desirable to use the responses of the same students at the two different points in time. Data in the main report drawn from questionnaire responses, therefore, uses the last two summaries only (the ‘complete data’ sample).
5. In presenting the summary of responses, the following conventions have been applied consistently:-
• responses of the project group are shown in bold, those of the comparator group in normal italics;
• all figures are percentages, expressed in terms of the number of valid usable responses to each individual question;
• some rows or columns (as appropriate) may not sum to 100%, due to rounding (or to multiple responses being allowed).
1
BASELINE – ALL AVAILABLE RESPONSES
P
ART1:
S
CHOOL1. How important to you are these things?
Tick (4) the box that is nearest to what you think about each one.
Very
important Important
Slightly Important
Not at all important
Coming to school every day 53% 58% 36% 32% 8% 8% 3% 2%
Good behaviour in lessons 30% 32% 55% 56% 12% 11% 3% 1%
Good behaviour between lessons and in breaks 12% 13% 40% 39% 38% 38% 10% 10%
Giving homework in on time 32% 37% 46% 43% 15% 16% 7% 4%
Doing well in your exams 88% 89% 9% 9% 2% 2% 1% 0%
Doing lots of subjects 15% 15% 45% 49% 30% 29% 10% 7%
Doing work experience or work placements 50% 49% 37% 36% 10% 14% 3% 1%
Now look at the list above. Put a ring round the one thing that you think will help you most to get a job.
Within the project group, of those who gave an answer, 12% ringed “Coming to school every day”, and 12% ringed “Doing work experience or work placements; 74% ringed “Doing well in your exams”. (The balance represents other answers).
In the comparator group, the equivalent percentages were 13%, 7% and 78%.
2. Do you agree with these sentences?
Tick (4) the box that is nearest to what you think about each one.
I agree
a lot I agree I disagree
I disagree a lot
Coming to school will help me to get a job 51% 50% 44% 45% 3% 4% 2% 1%
The subjects I do will help me to get a job 30% 32% 60% 58% 8% 9% 2% 1%
I think I will do well in my exams 15% 15% 57% 60% 23% 21% 5% 4%
My teachers think I will to do well in my exams 11% 9% 53% 56% 28% 28% 8% 7%
I always get better marks than I think I will in exams
15% 14% 44% 49% 34% 32% 7% 5%
I do better in projects and coursework than in exams
27% 29% 45% 47% 24% 20% 4% 4%
BASELINE – ALL AVAILABLE RESPONSES
3. Do you ever miss school? Tick (4) one box Yes 85% 83% No 15% 17%
If you said ‘yes’, why do you miss school?
From the following list tick (4) all the reasons that apply to you.
I am ill sometimes 76% 76%
I find school boring 25% 18%
I find some of my subjects boring 34% 24%
I don’t like some of my teachers 28% 21%
I find the work too hard 14% 10%
My parents keep me at home 5% 3%
Another reason, say what it is… 16% 15%
P
ART2:
C
HOICES AT THE END OFY
EAR11
(
END OF SUMMER TERM2000)
4. Here are some of the things that you could do after Year 11
Tick (4) all the things you know something about, and all those that you have thought about doing yourself.
I know about this
I have thought about doing
this myself
Doing A levels at school or college 50% 50% 38% 42%
Doing GNVQ or NVQ at school or college 51% 49% 35% 31%
Doing more GCSEs or re-sits at school or college 50% 50% 29% 28%
Doing a Modern Apprenticeship (called a ……….…….) 34% 30% 24% 23%
Doing a National Traineeship (called a ……….) 29% 26% 18% 17%
Getting a job with training 55% 51% 44% 48%
Getting a job without training 45% 43% 21% 21%
Any other ideas? Say what they are… 4% 5% 4% 4%
If you don’t know anything about any of the options above, don’t worry,
just tick (4) this box and go on to question 5 25% 23%
BASELINE – ALL AVAILABLE RESPONSES
Tick (4) the box that is nearest to what you think.
Yes, I have definitely decided 30% 26%
I am almost decided, but I’m still thinking 28% 32%
I have a few ideas 33% 34%
I have no idea 9% 8%
6. Have you decided what job you want to do when you leave full time education?
Tick (4) the box that is nearest to what you think.
Yes, I have definitely decided 30% 28%
I am almost decided, but I’m still thinking 29% 31%
I have a few ideas 31% 31%
I have no idea 10% 10%
7. This question asked students to list 3 jobs that they might wish to do on leaving school/college. Responses are not reported here, but have been recorded on the database.
8. Tick (4) all the things on this list that you think would be important for the jobs you have chosen in question 7.
GCSEs 79% 83%
GNVQs or NVQs 53% 36%
‘A’ Levels 57% 61%
Degree, or HND 27% 27%
A good ‘Record of Achievement’ or ‘Progress File’ 70% 74%
Confidence in yourself 79% 83%
Willingness to learn 67% 69%
Ability to work on your own 73% 78%
Getting on well with other people 85% 88%
Being able to use computers 48% 50%
BASELINE – ALL AVAILABLE RESPONSES
Project Comparator
English 48% 45%
Maths 46% 45%
Science 15% 17%
Technology 5% 4%
I.T. 5% 7%
10. Write down the two subjects that you do at school now which you think will least help you to get a job in the future.
Subjects commonly mentioned were as follows:-
Project Comparator
French or German 29% 32%
R.E. 26% 31%
P.E. 22% 20%
Science 13% 12%
History 9% 7%
Art 8% 8%
Maths 4% 6%
BASELINE – ALL AVAILABLE RESPONSES
11. From the following list, tick (4) the five things which matter most to employers when they choose someone for a job, (do this in the second column).
Then, tick (4) the five which you think would help you to do a job well, (do this in the third column). Tick (4) five boxes in each column.
Responses refer to the % of respondents giving a valid answer who ticked each item as any one of their five selections.
Things that are important to employers.
Tick five boxes only
Things that will help you to do well in a job Tick five boxes only
Good GCSE grades at the end of year 11 77% 82% 48% 59%
A Levels 35% 43% 28% 34%
GNVQs or NVQs 26% 17% 22% 16%
A Degree or HND 13% 13% 11% 13%
A good ‘Record of Achievement’ or Progress File
52% 55% 30% 38%
Work experience 38% 34% 45% 41%
Being able to write well 12% 14% 24% 19%
Being able to speak confidently and clearly 37% 38% 40% 39%
Being able to use computers 21% 18% 23% 23%
Being good with numbers 13% 13% 24% 19%
Being willing to learn new things 27% 31% 36% 37%
Getting on well with other people 36% 31% 49% 45%
Always getting to work on time 43% 41% 39% 36%
Honesty 31% 30% 34% 33%
BASELINE – ALL AVAILABLE RESPONSES
P
ART3:
S
KILLS AND ABILITIES12. How good do you think you are at each of these things?
Tick (4) the box that is nearest to what you think, for each.
Excellent Good OK Poor Very poor
Making decisions 12% 11% 42% 41% 40% 44% 5% 3% 1% 1%
Being confident when talking to adults other than your parents (eg teachers)
18 % 17 % 37 % 38 % 36 % 36
% 7% 8% 2% 1%
Improving your own learning and performance 10 % 11 % 40 % 42 % 43 % 38
% 6% 8% 1% 1%
Working with other people 31% 31% 43% 50% 22% 17% 3% 2% 1% 0%
Numeracy – being good with numbers 14% 14% 30% 30% 39% 42% 15% 13% 3% 2%
Communication skills – writing and speaking well 20 % 18 % 36 % 35 % 33 % 38
% 9% 9% 2% 0%
Solving problems 14% 12% 33% 34% 44% 41% 7% 11
% 2% 2%
Information Technology – using computers 18 % 19 % 30 % 33 % 34 % 29 % 13 % 15
% 5% 4%
Finding out information 14% 10% 38% 38% 38% 40% 8% 10
% 2% 2%
Coping with new experiences and situations 15 % 10 % 37 % 38 % 39 % 44
% 7% 7% 2% 1%
Making yourself do things that you don’t enjoy 10 % 13 % 24 % 22 % 36 % 35 % 22 % 22
% 8% 8%
Always being on time 29% 35% 30% 29% 26% 24% 11% 10% 4% 2%
Making new friends 32% 32% 40% 44% 23% 20% 3% 3% 2% 1%
Recognising your own strengths and weaknesses 21 % 19 % 39 % 40 % 31 % 32
% 7% 8% 2% 1%
On the list above, put a ring round any things that you think are called ‘Key Skills’
(see table overleaf)
BASELINE – ALL AVAILABLE RESPONSES
12. (continued). % of young people who ringed each item indicating that they thought it was a Key Skill (N.B. includes those saying they did not know what Key Skills were).
Making decisions 16% 22%
Being confident when talking to adults other than your parents (e.g. teachers) 11% 10%
Improving your own learning and performance 13% 12%
Working with other people 20% 18%
Numeracy – being good with numbers 13% 14%
Communication skills – writing and speaking well 22% 23%
Solving problems 15% 16%
Information Technology – using computers 17% 14%
Finding out information 12% 12%
Coping with new experiences and situations 11% 14%
Making yourself do things that you don’t enjoy 4% 6%
Always being on time 16% 16%
Making new friends 9% 10%
Recognising your own strengths and weaknesses 11% 14%
13. How much do you know about these things?
Tick (4) the box that shows how much you know about each.
I know all about this
I know quite a lot about
this
I know a bit about this
I don’t know anything about this
The jobs you could get in your local area 22% 18% 28% 33% 41% 41% 9% 8%
Where to find out what jobs are going at the
moment 27% 23% 39% 40% 28% 31% 6% 6%
The exams and skills you need for different
jobs 18% 21% 35% 33% 39% 35% 8% 11%
How to find out what jobs there will be in the
future 12% 13% 30% 29% 37% 35% 21% 23%
What sort of jobs there might be lots of in the
future 14% 13% 24% 26% 38% 36% 24% 25%
Where to look for the kind of job that you have
FINAL – ALL AVAILABLE RESPONSES
P
ART1:
S
CHOOL1. How important to you are these things?
Tick (4) the box that is nearest to what you think about each one.
Very
important Important
Slightly Important
Not at all important
Coming to school every day 57% 60% 36% 34% 5% 4% 2% 2%
Good behaviour in lessons 34% 31% 56% 58% 8% 10% 2% 1%
Good behaviour between lessons and in
breaks 13% 12% 42% 40% 36% 42% 9% 6%
Giving homework in on time 29% 32% 47% 50% 17% 14% 7% 4%
Doing well in your exams 83% 87% 15% 10% 1% 2% 1% 1%
Doing lots of subjects 18% 16% 46% 46% 27% 30% 9% 8%
Doing work experience or work placements 38% 40% 44% 42% 15% 15% 3% 3%
Now look at the list above. Put a ring round the one thing that you think will help you most to get a job.
Within the project group, of those who gave an answer, 70% ringed “Doing Well in your exams”, 18% ringed “Doing work experience or work placement”, and 10% ringed “Coming to school every day”.
In the comparator group, the equivalent percentages were 81%, 8% and 9%.
2. Do you agree with these sentences?
Tick (4) one box that is nearest to what you think for each one.
I agree
a lot I agree I disagree
I disagree a lot
Coming to school will help me to get a job 45% 44% 49% 48% 5% 7% 1% 1%
The subjects I do will help me to get a job 32% 28% 56% 60% 10% 12% 2% 1%
I think I will do well in my exams at the end of
the summer term 14% 10% 57% 64% 25% 22% 4% 4%
My teachers think I will to do well in my exams
at the end of the summer term 11% 8% 54% 61% 28%