An Integrative Approach to Study Drivers Perceived Stress on
Aberrant Driving Behaviour: The Mediation Role of Driver
Fatigue
Asrar Ahmed Sabir1,*, Ahmad Shahrul Nizam Bin Isha 1, Naseebullah Langove2 and Muhammad Umair Javaid3
1Department of Management and Humanities, 32610 Universiti Teknologi PETRONAS Malaysia 2Department of Management and Sciences, 84800 University of Loralai, Pakistan
3COMSATS University Islamabad,54000 Lahore Campus, Pakistan
Abstract. Robust scientific evidence exists for occupational group of heavy vehicle drivers in oil and gas transport who are infected with acute fatigue. Numerous recent studies relate driver’s perceived stress and fatigue with dangerous driving behaviours during performance of delivery duties. This study investigates the association between driver’s perceived stress on aberrant driving behaviour and determines fatigue to be the mediation factor. Sample size of 378 male drivers from 10 oil and gas transport companies was selected that operate in peninsular west and east Malaysia, who answered adapted version of Driver Behaviour Questionnaire (DBQ) in the conducted survey. Structural Equation Model (SEM) was applied that proved aberrant driving behaviours of heavy vehicle drivers can be predicted through driver’s perceived stress and fatigue. Fatigue is a mechanism that mediates the association amongst driver perceived stress and aberrant driving behaviours. In conclusion, the parameter of fatigue mediates between the perceived stress which is an appropriate prediction tool and consequent aberrant driving behaviour of heavy vehicle drivers. This study suggests abatement in individual stress and recommends fatigue management to alter risky and aberrant driving behaviours in order to encourage and give impetus to safe driving culture in oil and gas transportation sector in Malaysia.
1 Introduction
Road safety and stress-related issues for heavy vehicle drivers were studied a decade ago. Transportation via heavy vehicles is one of the jobs that involve high risk (Shattell, Apostolopoulos, Sönmez, & Griffin, 2010). To cater personal and business needs, the transportation system operates more than normal 8 hours in a day in developing and developed countries (Williamson et al., 2011). The role of driver’s perceived stress on aberrant driving behaviour has been thinly investigated in previous studies. This study examines the effect of driver’s perceived stress on aberrant driving behaviour with the mediating role of driver’s fatigue. Comprehensive literature review on driver’s stress and consequent aberrant driving behaviour has been conducted to develop a theoretical model which is empirically validated.
Fatigue is well-recognized hazardous factor causing numerous road accidents in developing countries (Dawson, Chapman, & Thomas, 2012). Due to fatigue, humans are not able to perform work within safety limits. Government and general public regulatory authorities are putting a lot of efforts to implement high safety standards of occupational heavy vehicle drivers. High vehicle gross weight, long vehicle length and speed limit violation often lead to severe road accidents (Chang & Chien, 2013).
Matthews, Watson, & Biggs, 2011). This study addresses this gap in the literature by examining the mediating role of fatigue as an association between driver’s perceived stress and aberrant driving in a sample of oil and gas tanker drivers in Malaysia.
2 Literature Review
The literature study focuses on the relationship between road safety and stress (Channel, 2016). More in-depth research is required to study the driver’s perceived stress on aberrant driving behaviours. Stress adversely affects everyone’s life which is caused when load of work increases more than human capacity (Ge et al., 2014). Previous studies show that various factors are responsible for driver’s perceived stress and health care issues (Sabir & Isha, 2017). The occupational driver’s stress can be generally classified as personal-related or work-related. The driver’s stress can be mitigated by good health, employment security, healthy working conditions and harmonious family relationships. Reduction in any of these factors might affect driver’s performance and also increases the stress level (Öz, Özkan, & Lajunen, 2010).
Numerous studies have identified fatigue to be hazardous for occupational heavy vehicle drivers which reduces their performance leading to road accidents (Pylkkönen et al., 2015). Fatigue can be defined as a feeling of tiredness, reduced alertness and drowsiness which lowers the performance efficiency (Craig, Tran, Wijesuriya, & Boord, 2006). It has multiple physical and mental forms. This research has well-documented the impact of fatigue in real scenario conditions that depicts grave consequences in the work environment (Folkard & Tucker, 2003).
Previous research studies had shown that occupational heavy vehicle drivers are more prone to road accidents causing human and financial loss (Taylor & Dorn, 2006). It is pertinent to understand accidental history of different organizations with different job nature of drivers in order to design and implement secure and effective precautionary measures to have less fatalities (Butlewski & Hankiewicz, 2015). Fatigue causes decline in human mental and physical health. 20% of the total road accidents are due to fatigue experienced by drivers (Tanaka, Ishii, & Watanabe, 2014). This percentage soars drastically as fatigue hampers human efficiency to perform effectively. The percentage of road accidents is higher than 20% in Malaysia (Sullman, Stephens, & Yong, 2014). According to Malaysian Institute of Road Safety Research (MIROS), 34.7% of truck drivers having poor sleep quality due to fatigue (MIROS, 2015).
Fatigue makes the driving behaviour aggressive which depends on the personality traits of the heavy vehicle drivers. Aberrant driving behaviour can be defined as on-road behaviour adopted by a driver intended to cause physical, psychological and societal harm to other road user involving feelings of frustration, anger or threat (Robotham, 2011). The driving behaviour can be characterized by load weight, vehicle speed and frequency of stops and brake applications (Walnum & Simonsen, 2015). This research study applies two theories namely State-Trait Theory (STT) and Frustration- Aggression Theory (FAT).
3 State-Trait Theory
4 Frustration-Aggression theory
The Frustration-Aggression theory can be explained as instigation of aggression due to multiple forms of frustration such as suppressed, disguised, delayed and displaced. The emotions of frustration and aggression are closely inter-related. Miniscule provocation can propel uncontrolled aggressive behaviour leading to chain reaction of negative events (Berkowitz, Mowrer, & Sears, 1989). This theory is developed based on frustration and their results. This theory explains that frustration leads to negative behaviour which means that aggression is also come out from the frustration of the individual. Thus, frustration acts as external factors which change the ultimate behaviour of the person. For those that had been provoked, exposure to the trivial trigger strongly increased displayed aggression levels, even exceeding the aggression displayed in response to provocation alone (Pedersen, Aviles, Ito, Miller, & Pollock, 2002). Four main hypotheses are developed based on previous studies.
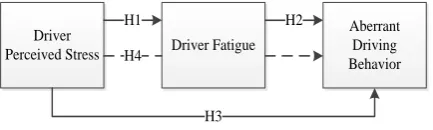
H1: Driver perceived stress has significant impact on driver fatigue.
H2: Driver fatigue has significant impact on aberrant driving behaviour.
H3: Driver perceived stress has significant impact on aberrant driving behaviour.
H4: Driver fatigue mediate the relationship between driver perceived stress and aberrant driving behaviour.
5 Theoretical Model
Driver
Perceived Stress Driver Fatigue
Aberrant Driving Behavior H4
H3
H1 H2
Fig. 1
Theoretical Model
6 The Methodology of the study
In this cross-sectional study, the sample size of 378 male oil and gas tanker drivers from all regions of Malaysia was selected. Ten major oil and gas distribution companies participated in this survey. Women were excluded due to low representation in this occupational group. An adapted version of the Driver Behaviour Questionnaire (DBQ) (Rowe, Roman, McKenna, Barker, & Poulter, 2015) was used to measure aberrant driving behaviour. The adapted questionnaire was translated into Bahasa Melayu.
7 Measurement Model Assessment
Measurement model assessment has been ascertained through convergent validity (loadings, composite reliability, and average variance extracted) and discriminant validity (Fornell & Larcker, 1981). Each item loadings were at or above the threshold value of 0.70. Some items of the constructs were deleted. Four items of driver’s perspective stress (DPS7, DPS8, DPS9 and DPS10), four items of Ordinal Violation (OV1, OV6, OV7, OV8), four items of Slips (SLIPS1, SLIPS2, SLIPS3, SLIPS5) and four items of ERRORS (ERRORS1, ERRORS2, ERRORS3, ERRORS8) were deleted due to low loadings in order to achieve the values of Average Variance Extracted (AVE).
[image:3.595.197.414.400.465.2](J. F. J. Hair, Black, Babin, & Anderson, 2010). Meanwhile, Cronbach’s Alpha ascertained the scale internal consistency and threshold values which are recommended to be higher than 0.70 (Joseph F Hair, Black, Babin, Anderson, & Tatham, 2006). The values of AVE, CR and Cronbach’s Alpha given in Table-1 are satisfactory for further analysis.
Table 1:Measurement model: Evaluation of First-order Reflective constructs
Discriminant Validity (DV) can be defined as the degree to which a construct is truly distinct from other constructs in the model (Joseph F Hair et al., 2006). It compares the square root of the AVE values with the latent variable correlations. The square root of each AVE constructs should be greater than its highest correlations with any other constructs (Fornell & Larcker, 1981). The results of discriminant validity by Fornell & Larcker approach are given in Table-2, proving the presence of discriminant validity. Hence, it is confirmed that the measurement model assessment in terms of convergent and discriminant validity has been achieved and sufficient enough to analyse the structural model.
Scale Items Loadings Cronbach’s Alpha CR AVE
Driver’s Fatigue 0.75 0.833 0.501
DF1 0.707
DF2 0.716
DF3 0.715
DF4 0.753
DF5 0.643
Driver’s Perceived Stress 0.813 0.865 0.518
DPS1 0.698
DPS2 0.685
DPS3 0.671
DPS4 0.799
DPS5 0.761
DPS6 0.695
Aberrant Driving Behavior
AV 0.708 0.837 0.633
AV1 0.784
AV2 0.851
AV3 0.748
OV 0.741 0.838 0.567
OV2 0.765
OV3 0.836
OV4 0.776
OV5 0.618
SLIPS 0.722 0.829 0.557
SLIPS4 0.498
SLIPS6 0.781
SLIPS7 0.824
SLIPS8 0.832
Errors 0.667 0.801 0.505
ERRORS4 0.603
ERRORS5 0.76
ERRORS6 0.806
Table 2:Discriminant Validity (Fornell-Larcker Criterion)
Note: Square roots of average variances extracted (AVEs) shown on diagonal.
8 Second-Order Construct Assessment
Formative second-order constructs can be assessed through Variance Inflation Factor (VIF) and significance level. The VIF for the first-order construct of aberrant driving behaviour was evaluated with the help of multi-collinearity (Ali, Amin, & Cobanoglu, 2016). The VIF values for the first-order construct are 1.127, 1.075, 1.086 and 1.058 respectively given in Table 3. All VIF values are below than 3.3 thresholds (Peng & Lai, 2012). The VIF values show that multi-collinearity issue between dimensions of the first-order construct of aberrant driving behaviour does not exist. The significance level of each dimension of the first-order construct of aberrant driving behaviour was found significant which is depicted in Table 3.
Table 3:Measurement model: Evaluation of Second-order formative construct
9 Model Fit indices
WarpPLS 5.0 calculates the model fit indices while looking into the six-global indices outcomes which are presented in next paragraph (Rasoolimanesh, Jaafar, Kock, & Ramayah, 2015). The six fit-indices show an overall model-data fit within the acceptable range of Average Path Coefficient (APC) = 0.358, P<0.001; Average R-Squared (ARS) = 0.243, P < 0.001; Average Adjusted R-Squared (AARS) = 0.238, P < 0.001. Average block VIF (AVIF) = 1.207. Average Full Collinearity VIF (AFVIF) = 1.304, acceptable if <= 5, ideally <= 3.3; and Tenenhaus GoF (GoF) = 0.336, small >= 0.1, medium >= 0.25, large >= 0.36.
DF DPS AV OV SLIPS Errors
DF 0.708 0.456 0.171 0.158 0.347 0.2
DPS 0.456 0.72 0.173 0.36 0.311 0.126
AV 0.171 0.173 0.795 0.19 0.169 0.263
OV 0.158 0.36 0.19 0.753 0.186 0.139
SLIPS 0.347 0.311 0.169 0.186 0.747 0.015
Errors 0.2 0.126 0.263 0.139 0.015 0.711
Construct Item Scale type Weight Sig FVIF VIF
Aberrant Driving
Behavior Formative 1.322
AV 0.481 <0.001 1.127
OV 0.421 <0.001 1.075
SLIPS 0.384 <0.001 1.086
10 Structural Model Assessment
In order to assess structural model, various statistical analyses were performed to determine the path coefficients, R2, t-values, effect sizes (f2) and predictive relevance (Q2) to confirm the statistical significance (Joe F Hair, Ringle, & Sarstedt, 2011).
The hypothesis (H1) of driver’s perceived stress (β = 0.51, p < 0.01) was found positive and significantly related to driver’s fatigue. Hypothesis (H2) of driver’s fatigue (β = 0.27, p < 0.01) was found positive and significantly related to aberrant driving behaviour. Hypothesis (H3) of driver’s perceived stress (β = 0.29, p < 0.01) was also found positive and significantly related to aberrant driving behaviour which explains 26.4% and 22.3% of the variance in driver’s fatigue and aberrant driving behaviour respectively. Hence, H1, H2, and H3 were supported. As cited by (Falk & Miller, 1992) the value of R2 more than 10% for the variance explained by the endogenous variable is deemed satisfactory. The recommended effect size (f2) values should be in the range of 0.02 (small), 0.15 (medium) and 0.35 (large). The effect size (f2) values are given in Table 4 (0.264, 0.105 and 0.117) shows that the relationships have medium and small effect size respectively. Lastly, we also calculated the predictive relevance (Q2) of the model with the blindfolding technique. Blindfolding is a sample reuse technique that omits every nth data point in the endogenous construct’s indicators and estimates the parameters with the remaining data points(Chin, 1998; Henseler, Ringle, & Sinkovics, 2009). The value of Q2 must be greater than 0 for endogenous variable (Fornell, 1994). The Q2 values of driver’s fatigue and aberrant driving behaviour were 0.261 and 0.215 respectively given in Table 4. Hence, it is confirmed that the predictive relevance of the study model is acceptable.
Table 4:Structural Model Assessment (Direct Hypothesis)
Path
Coefficient R2 Q2 f2 T-value Result
H1: DPS---DF 0.51 0.264 0.261 0.264 8.305 Supported
H2: DF---ADB 0.27 0.105 4.172 Supported
H3: DPS---ADB 0.29 0.223 0.215 0.117 4.513 Supported
For the mediation analysis, we used the approach which recommended a bootstrapping procedure to test the indirect effects (Preacher & Hayes, 2008). The results of mediation analysis are given in Table 5, where hypothesis (H5) ( = 0.139, t = 2.957, p < 0.05) shows a significant supported relationship of driver fatigue as a mediator between driver’s perceived stress and aberrant driving behaviour. Thus, it concludes and supports the hypothesis (H4) that driver fatigue is mediated by driver’s perceived stress and aberrant driving behaviour.
Table 5:Mediation Analysis
11 Discussion and conclusions
In this study, the purpose was to test follow direct and indirect relationships between constructs. This study consisted of four hypotheses, where each hypothesis has been discussed thoroughly. The first hypothesis (H1) was to test positive impact of driver’s perceived stress (DPS) on aberrant driving behaviour (ADB). Hypothesis (H1) supported the relationship between DPS and ADB. The results of the study revealed that DPS positively influences ADB. The findings of the study are consistent and commensurate with the previous studies (Wynn, 2017).
Hypothesis Testing Coefficient Path T-value P-value Results
Hypothesis (H2) of the study examines the influence of DPS on Driver’s Fatigue (DF). The results showed that DPS positively and significantly influenced DF. Hence, this hypothesis (H2) supports the relationship between DPS and DF. The findings of this hypothesis (H2) were in harmony with the previous studies of (Rowden et al., 2011).
Hypothesis (H3) stated that DF had a significant positive impact on ADB. The study tested this hypothesis (H3) and concluded that DF had a positive impact on ADB. Therefore, hypothesis (H3) supports the relationship between DF and ADB. The findings of this hypothesis were akin and in line with the previous studies (Di Milia et al., 2011). The last hypothesis of the study tested the indirect relationship of DF between DPS and ADB. DF mediates the relationship between DPS and ADB. This study tested this mediation hypothesis (H4) and concluded that DF significantly mediates the relationship between DPS and ADB. Thus, the hypothesis (H4) supported its findings which were in line with the previous studies (Useche et al., 2017).
In conclusion, all hypotheses were supported. The mediation role of driver fatigue also exists between the driver perceived stress and aberrant driving behaviours. The nature of this study is cross-sectional. Further research can be conducted by an experimental approach.
This research is fully supported by Universiti Teknologi PETRONAS Y-UTP Grant.
References
Abbood, H., Al-Nuaimy, W., Al-Ataby, A., Salem, S. A., Alzubi, H. S., Delorme, R., … Lajunen, T. (2014). The relative impact of work-related stress, life stress and driving environment stress on driving outcomes. Accident Analysis and Prevention, 43(2), 1332–1340. https://doi.org/10.1016/j.aap.2011.02.004
Ali, F., Amin, M., & Cobanoglu, C. (2016). An integrated model of service experience, emotions, satisfaction, and price acceptance: an empirical analysis in the Chinese hospitality industry. Journal of Hospitality Marketing &
Management, 25(4), 449–475.
Berkowitz, L., Mowrer, O. H., & Sears, R. (1989). Frustration-Aggression Hypothesis ; Examination and Reformulation, 106(1), 59–73.
Butlewski, M., & Hankiewicz, K. (2015). Psychomotor Performance Monitoring System in the Context of Fatigue and Accident Prevention. Procedia Manufacturing, 3(Ahfe), 4860–4867.
https://doi.org/10.1016/j.promfg.2015.07.603
Chang, L. Y., & Chien, J. T. (2013). Analysis of driver injury severity in truck-involved accidents using a non-parametric classification tree model. Safety Science, 51(1), 17–22. https://doi.org/10.1016/j.ssci.2012.06.017 Channel, B. H. (2016). Work - related stress, 1–5.
Chin, W. W. (1998). The partial least squares approach to structural equation modeling. Modern Methods for Business Research, 295(2), 295–336.
Craig, A., Tran, Y., Wijesuriya, N., & Boord, P. (2006). A controlled investigation into the psychological determinants of fatigue. Biological Psychology, 72(1), 78–87. https://doi.org/10.1016/j.biopsycho.2005.07.005
Dawson, D., Chapman, J., & Thomas, M. J. W. (2012). Fatigue-proofing: A new approach to reducing fatigue-related risk using the principles of error management. Sleep Medicine Reviews, 16(2), 167–175.
https://doi.org/10.1016/j.smrv.2011.05.004
Di Milia, L., Smolensky, M. H., Costa, G., Howarth, H. D., Ohayon, M. M., & Philip, P. (2011). Demographic factors, fatigue, and driving accidents: An examination of the published literature. Accident Analysis and Prevention, 43(2), 516–532. https://doi.org/10.1016/j.aap.2009.12.018
Falk, R. F., & Miller, N. B. (1992). A primer for soft modeling. University of Akron Press.
Fida, R., Paciello, M., Tramontano, C., Fontaine, R. G., Barbaranelli, C., & Farnese, M. L. (2015). An integrative approach to understanding counterproductive work behavior: The roles of stressors, negative emotions, and moral disengagement. Journal of Business Ethics, 130(1), 131–144.
Folkard, S., & Tucker, P. (2003). Shift work, safety and productivity. Occupational Medicine, 53(2), 95–101. https://doi.org/10.1093/occmed/kqg047
Fornell, C. (1994). Partial least squares. Advanced Methods of Marketing Research.
Fornell, C., & Larcker, D. F. (1981). Evaluating structural equation models with unobservable variables and measurement error. Journal of Marketing Research, 39–50.
driving behavior among Chinese drivers. Accident Analysis and Prevention, 73, 34–40. https://doi.org/10.1016/j.aap.2014.07.024
Ge, Y., Zhang, Q., Zhao, W., Zhang, K., & Qu, W. (2017). Effects of trait anger, driving anger, and driving experience on dangerous driving behavior: A moderated mediation analysis. Aggressive Behavior, (June 2016), 1–9. https://doi.org/10.1002/ab.21712
Hair, J. F., Black, W. C., Babin, B. J., Anderson, R. E., & Tatham, R. L. (2006). Multivariate data analysis (Vol. 6). Upper Saddle River, NJ: Pearson Prentice Hall.
Hair, J. F. J., Black, W. C., Babin, B. J., & Anderson, R. E. (2010). Multivariate data analysis Upper Saddle River: Pearson Prentice Hall.[Links].
Hair, J. F., Ringle, C. M., & Sarstedt, M. (2011). PLS-SEM: Indeed a silver bullet. Journal of Marketing Theory and Practice, 19(2), 139–152.
Hair Jr, J. F., Hult, G. T. M., Ringle, C., & Sarstedt, M. (2016). A primer on partial least squares structural equation modeling (PLS-SEM). Sage Publications.
Henseler, J., Ringle, C. M., & Sinkovics, R. R. (2009). The use of partial least squares path modeling in international marketing. In New challenges to international marketing (pp. 277–319). Emerald Group Publishing Limited. Huang, J. L., & Ford, J. K. (2012). Driving locus of control and driving behaviors : Inducing change through driver
training. Transportation Research Part F: Psychology and Behaviour, 15(3), 358–368. https://doi.org/10.1016/j.trf.2011.09.002
Kontogiannis, T. (2006). Patterns of driver stress and coping strategies in a Greek sample and their relationship to aberrant behaviors and traffic accidents. Accident Analysis & Prevention, 38(5), 913–924.
MIROS. (2015). Malaysian Institute of Road Safety. Retrieved January 1, 2016, from www.miros.gov.my
Öz, B., Özkan, T., & Lajunen, T. (2010). Professional and non-professional drivers’ stress reactions and risky driving. Transportation Research Part F: Traffic Psychology and Behaviour, 13(1), 32–40.
Pedersen, W. C., Aviles, F. E., Ito, T. A., Miller, N., & Pollock, V. E. (2002). Psychological experimentation on alcohol-induced human aggression. Aggression and Violent Behavior, 7(3), 293–312.
https://doi.org/10.1016/S1359-1789(01)00044-1
Peng, D. X., & Lai, F. (2012). Using partial least squares in operations management research: A practical guideline and summary of past research. Journal of Operations Management, 30(6), 467–480.
Peter, J., & Barry, C. (2011). ScienceDirect - Accident Analysis & Prevention The relative impact of work-related stress, life stress and driving environment stress on driving outcomes. Accident Analysis & Prevention, 43, 1332– 1340.
Preacher, K. J., & Hayes, A. F. (2008). Assessing mediation in communication research. The Sage Sourcebook of Advanced Data Analysis Methods for Communication Research, 13–54.
Pylkkönen, M., Sihvola, M., Hyvärinen, H. K., Puttonen, S., Hublin, C., & Sallinen, M. (2015). Sleepiness, sleep, and use of sleepiness countermeasures in shift-working long-haul truck drivers. Accident Analysis & Prevention, 80, 201–210.
Rasoolimanesh, S. M., Jaafar, M., Kock, N., & Ramayah, T. (2015). A revised framework of social exchange theory to investigate the factors influencing residents’ perceptions. Tourism Management Perspectives, 16, 335–345. Robotham, D. (2011). Sleep as a public health concern: insomnia and mental health. Journal of Public Mental Health,
10(4), 234–237. https://doi.org/10.1108/17465721111188250
Rowden, P., Matthews, G., Watson, B., & Biggs, H. (2011). The relative impact of work-related stress, life stress and driving environment stress on driving outcomes. Accident Analysis and Prevention, 43(4), 1332–1340.
https://doi.org/10.1016/j.aap.2011.02.004
Rowe, R., Roman, G. D., McKenna, F. P., Barker, E., & Poulter, D. (2015). Measuring errors and violations on the road: A bifactor modeling approach to the Driver Behavior Questionnaire. Accident Analysis and Prevention, 74, 118–125. https://doi.org/10.1016/j.aap.2014.10.012
Sabir, A. A., & Isha, A. S. N. B. (2017). Health care issues: A risk for fatal crashes amongst heavy vehicle drivers in oil and gas industry. Journal of Medical Imaging and Health Informatics, 7(3).
https://doi.org/10.1166/jmihi.2017.2041
Shattell, M., Apostolopoulos, Y., Sönmez, S., & Griffin, M. (2010). Occupational stressors and the mental health of truckers. Issues in Mental Health Nursing, 31(9), 561–568. https://doi.org/10.3109/01612840.2010.488783 Sullman, M. J. M., Stephens, A. N., & Yong, M. (2014). Driving anger in Malaysia. Accident Analysis and Prevention,
71, 1–9. https://doi.org/10.1016/j.aap.2014.04.019
Sullman, M. J. M., Stephens, A. N., & Yong, M. (2015). Anger, aggression and road rage behaviour in Malaysian drivers. Transportation Research Part F: Traffic Psychology and Behaviour, 29, 70–82.
Tanaka, M., Ishii, A., & Watanabe, Y. (2014). Neural effect of mental fatigue on physical fatigue: A
magnetoencephalography study. Brain Research, 1542, 49–55. https://doi.org/10.1016/j.brainres.2013.10.018 Taylor, A. H., & Dorn, L. (2006). STRESS, FATIGUE, HEALTH, AND RISK OF ROAD TRAFFIC ACCIDENTS
AMONG PROFESSIONAL DRIVERS The Contribution of Physical Inactivity - Annual Review of Public Health, 27(1)371_102117, 2010(16). https://doi.org/10.1146/annurev.publhealth.27.021405.102117
Useche, S. A., Ortiz, V. G., & Cendales, B. E. (2017). Stress-related psychosocial factors at work, fatigue, and risky driving behavior in bus rapid transport (BRT) drivers. Accident Analysis and Prevention, 104(November 2016), 106–114. https://doi.org/10.1016/j.aap.2017.04.023
Walnum, H. J., & Simonsen, M. (2015). Does driving behavior matter? An analysis of fuel consumption data from heavy-duty trucks. Transportation Research Part D: Transport and Environment, 36, 107–120.
https://doi.org/10.1016/j.trd.2015.02.016
Williamson, A., Lombardi, D. A., Folkard, S., Stutts, J., Courtney, T. K., & Connor, J. L. (2011). The link between fatigue and safety. Accident Analysis & Prevention, 43(2), 498–515.