International Journal of Innovative Technology and Exploring Engineering (IJITEE) ISSN: 2278-3075,Volume-8 Issue-11, September 2019
Abstract: As the technology improving, huge volumes of different types of data is being generated rapidly. Mining such data is a challenging task. One of the important tasks of mining is to group similar objects or similar data into cluster which is very much useful for analysis and prediction. K-means clustering method is a popular partition based approach for clustering data as it leads to good quality of results. This paper focuses on K-means clustering algorithm by analyzing the E-commerce big data. In this research, geographical location and unique identification number of the customer are considered as constraints for clustering.
Keywords:Big data, Clustering, E-commerce, K-means.
I. INTRODUCTION
E-commerce is an application area where clustering algorithms are widely used. E-commerce websites continuously generates different types of data. Analyzing such data is really a challenging task. Clustering algorithms helps to find out the hidden similarities between the data, such as similarity between the price of the product or services provided to the purchasing history of the customers. It helps to group the customers with the similar patterns. [1]
Clustering of data is a method of grouping data into particular patterns or a method for classifying the information mountain into meaningful stacks. The goal of the clustering method is to divide a dataset into multiple groups so that the resemblance within a group is greater than between the groups. The objective of the clustering is to find out from the given data the underlying intrinsic structure of each cluster. [2] The problem clustering can be found in many application areas, such as pattern classification, pattern recognition, data mining, and data compression. The concept of what organizes a vigorous cluster depends on the execution and many techniques of discovering clusters that are substance to different requirements, that are systematic and ad hoc. [3]
There are different approaches and algorithms are available to deal with clustering as stated in the earlier sections, such as Partition based, Density based, Hierarchical based and Model based approaches. There are different algorithms proposed within the above mentioned approaches such as k-means
Revised Manuscript Received on August 10, 2019.
Indivar Shaik*, Research Scholar, Dept. of Computer Science and Engineering, SSSUTMS, Sehore, Madhya Pradesh, India.
Swapna Suhasini Nittela, Research Scholar, Dept. of Computer Science and Engineering, SSSUTMS, Sehore, Madhya Pradesh, India.
Dr. Tryambak Hiwarkar, Professor, Dept. of Computer Science and Engineering, SSSUTMS, Sehore, Madhya Pradesh, India.
Dr. Srinivas Nalla, Principal, Sahaja Institute of Technology & Science for Women, KarimNagar, Telangana, India.
clustering, c-means clustering, DBSCAN, CLARA, BIRCH and Gaussian Mixture Model. [4]
These algorithms are widely used and are showed very promising performance in clustering and are broadly used in many applications. [4] K-means a partition based clustering approach which is broadly used in different application areas, but it is time taking and also final results of clusters is depends on the selection of the initial cluster size. [2]
The clustering comes under unsupervised learning process as the clusters of similar objects form automatically. We can cluster anything, and the better our clusters are, the more similar items are in the cluster. This concept of similarity depends on measurement of the similarity. Because there is no target value like in Classification. This is the reason why it is known as unsupervised learning. For example, from a customer dataset by using unsupervised learning we can retrieve the top geographic locations based on their zip code or we can retrieve the top selling products that are bought by the customers in the particular group. [4]
The similarity and dissimilarity between the objects is calculated by measuring the distance between them. There are different methods available for measuring distance, such as Euclidean distance, Manhattan and Minkowski distance. [5]
Different clustering algorithms are available and they can be categorized as follows:
Partitioning based approach: This method breaks down a dataset into a collection of clusters. It builds several different partitions of this dataset, where each partition represents a cluster. K-means clustering, K-medoids clustering or Partition Around Medoids(PAM) and Clustering Large Applications (CLARA) algorithms are the widely used partition based clustering methods. [6] [7]
Density based approach: In this approach a cluster continuous to grow as long as it’s neighborhood density meets or exceeds some threshold.
Hierarchical based approach:
i) Agglomerative approach (bottom up): In this approach each object is treated as a single unique cluster. Once all single clusters are formed, clusters are paired and combined successively until all clusters are merged into single cluster that contains all dataset items. [6] [7] ii) Divisive approach (top down): It begins with all objects
in the dataset being included in a single big cluster. The most heterogeneous cluster is split into two at each stage of iteration. The process is repeated until all the objects of dataset are in a cluster of their own. [6] [7]
Grid based approach: It quantizes the objects into grid cells Distribution or Model based approach: It uses statistical distribution models such as
expectation maximization (EM) analysis to fit objects.
K-means Clustering Algorithm Based on
E-Commerce Big Data
II. K-MEANS CLUSTERING
K-means clustering is considered to be a very famous and widely used partitioning based approach. It is a numerical, non-deterministic, an unsupervised and an iterative approach. In K-means clustering, the average value (mean value) of objects in the group represents individual cluster. The main objective of the K-means clustering algorithm is to acquire the stable number of clusters that reduces the Euclidean distances between data objects and center of clusters. [8]
Let D={di}, i=1,2,……,n is a dataset of n-objects, and let K-is
the numbers of clusters to be formed.
Cj is the center of the cluster where j=1,2,…..,k.
The distance between centroid and data object is measured by using Euclidean distance formula. The Euclidean distance is calculated by using sum of squares of distances [1]. Let A and B are two objects in a dataset. The Euclidean distance between A and B is calculated by using the below formula.
Euclidean Distance (A, B) = (|A1-B1|2+ |A2-B2|2 + ………….
+|An-1-Bn-1|2+|An-Bn|2)1/2
It can be summarized as; Euclidean distance =√Σ|Ai-Bi|2 ,
i=1,2,…….n-1,n.
Each cluster is filled with the objects which are near to the center of the cluster in the data space of cluster nodes. Later, center of the cluster updated by itself as the number of objects increases. This process is repeated until it reaches all the objects of cluster. [9]
For various real-world applications, the k-means clustering algorithm has been shown to be efficient in generating excellent cluster outcomes. Generally, k-means clustering algorithm’s required time is proportional to the number of clusters per every iteration and to the number of patterns generated. This method is particularly very expensive for big datasets. [9]
Algorithm: [ 9][10]
Input: Given dataset D with n-items to cluster D= {d1, d2,
d3,……,dn}
K- Number of clusters (random selection) K is set of subset of D as temporary cluster K= {k1, k2, k3,……….,kk}
Where k1= {d1}, k2={d2}, k3= {d3}…… kk= {dk}
C is set of centroids of those clusters. C= { c1, c2, c3,………,ck}
And c1= d1, c2 = d2, c3 = d3,………. ck = dk,
Where k<=n
Output: K is set of subset of D as final cluster and C is set of centroids of these clusters.
K= {k1, k2, k3,………, kk}
C= {c1, c2, c3,………, ck}
Steps:
Step 1: Initialize the cluster size. Divide the given dataset into k number of clusters where k-is predefined.
Step 2: Select k-points as cluster centers on a random basis. Step 3: Calculate mean or centroid of all data objects in each
Step 4: Assign each data object to its nearest cluster center with a minimum distance from the cluster center.
Step 5: Recalculate center of the cluster and repeat Step 3 Step 6: If there is no data object reassigned then stop, else repeat from step 3
III. EMPIRICAL ANALYSIS AND RESULTS
The experiment was conducted by R programming language and R-Studio. The dataset was collected from UCI Machine Learning Repository which consists of 541909 records of the transactions. Centroids are selected randomly in K-means clustering approach. K-means clustering algorithm takes numerical values, so all the objects which we would like to cluster should be numeric variables. As the dataset is from online retail market, this paper focuses on the sales of the products from different countries (i.e.; geographical). It clusters the available countries into different clusters with respect to the sales of the product.
The purpose of this research is to form the clusters of the E-Commerce big data using k-means clustering algorithm. The main constraint of k-means clustering algorithm is that it accepts numerical variables.
Figure 1: Clustering Process
International Journal of Innovative Technology and Exploring Engineering (IJITEE) ISSN: 2278-3075,Volume-8 Issue-11, September 2019
Figure 2: Contents of Dataset
[image:3.595.305.546.49.278.2]K-means clustering based on Country: The dataset was filtered according to the k-means clustering algorithm constraints. First we found the different unique countries available in the dataset. Totally 37 countries were present and some transactions were made from the unknown location, we treat them as unspecified location and also we included it.
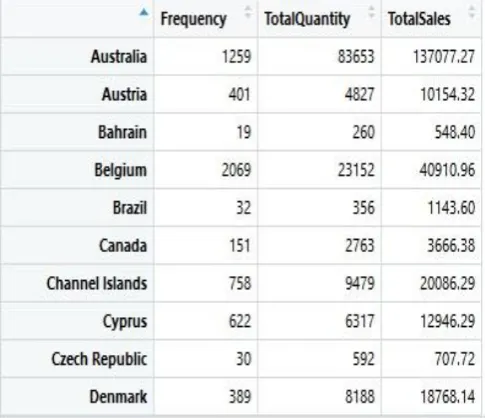
Figure 3: Country wise Dataset after Preprocessing
[image:3.595.48.289.53.317.2]We considered 3 different variables for clustering the market. They are frequency of the customer (how many times transactions happened from the particular country), total quantity purchased from the particular country and finally total amount of sales made by the particular country. Initially number of clusters are considered as 3 (As we used k-means clustering algorithm for clustering, need to give number of cluster as input).
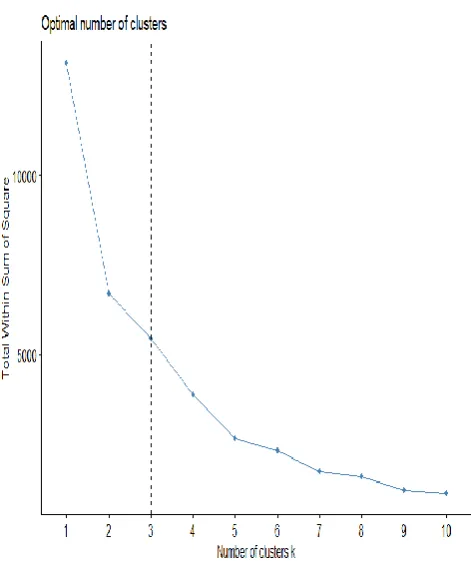
Figure 4: Country wise Optimal number of clusters
When we performed clustering using k-means clustering algorithm using 3 clusters as the input. It gave results as the sizes of 3 clusters are 32, 1 and 5. Among the available 38 countries 32 countries are grouped into cluster 1, only one country in cluster 2 and 5 countries in cluster 3. When considering the percentages of clusters cluster 1 consists of 84.21%, cluster 2 consists of 2.6% and cluster 3 consists of 13.15%. we can conclude that k-means clustering algorithm provided good result as cluster 1 consists of majority of countries in it.
Figure 5: Country wise Cluster size
[image:3.595.47.290.424.633.2] [image:3.595.308.545.462.730.2]K-means clustering based on Country: First we identified the different unique customers available in the dataset. Totally 4372 different customers with unique id were present We considered 3 different variables for clustering the market as we performed in the previous section.
Figure 7: CustomerID wise Dataset after Preprocessing
Figure 8: CustomerID wise Optimal number of clusters
When we performed clustering using k-means clustering algorithm using 3 clusters as the input. It gave results as the sizes of 3 clusters are 317, 4040 and 51. Among the available 4372 customers 317 customers are grouped into cluster 1, 4040 customers are in cluster 2 and 15 customers are in
cluster 3 consists of only 0.34%. we can conclude that k-means clustering algorithm provided good result as cluster 2 consists of majority of countries in it.
[image:4.595.45.274.117.365.2]Figure 9: CustomerID wise Cluster size
Figure 10: CustomerID wise Visualization of Clustering
IV. CONCLUSION
In this research, we have discussed a simple k-means clustering algorithm with an appropriate example. This paper analyzes the E-commerce dataset by using the k-means clustering algorithm. In this paper we have used a qualitative approach to analyze the clustering algorithm and we have used Euclidean distance for measuring the distance between objects. We demonstrated the k-means clustering algorithm on an E-Commerce dataset which consists of 541909 records of transactions. As per the theoretical analysis and results obtained from the experiment in this research, k-means algorithm delivers better efficiency for clustering huge amounts of data. A drawback of k-means clustering algorithm is that it uses fixed number of clusters. It can be further analyzed by applying different clustering methods.
REFERENCES
1. Shaik, I., Hiwarkar, T., & Nalla, S. (2019). “Customer Segmentation
Analysis of E- Commerce Big Data”. International Journal of
Engineering and Advanced Technology. Vol.8 Issue.5, pp. 582–587.
2. Singh, S. P. & Yadav, A. (2013). “Study of K-Means and Enhanced
K-Means Clustering Algorithm”. International Journal of Advanced
Research in Computer Science, Vol.4 Isuue.10. pp. 103-107 3. Kanungo, T., & Netanyahu, N. S. (2002). “An Efficient k-Means
Clustering Algorithm: Analysis and Implementation”. IEEE
Transactions on pattern Analysis and Machine Intelligence, Vol.24 Issue.7, pp. 881-892
4. Wang, S., Li, M., Hu, N., Zhu, E., Hu, J., Liu, X., & Yin, J. (2019).
“K-Means Clustering With Incomplete Data”. IEEE Access, 7, pp.
[image:4.595.50.286.396.677.2]International Journal of Innovative Technology and Exploring Engineering (IJITEE) ISSN: 2278-3075,Volume-8 Issue-11, September 2019
5. Yadav, J., & Sharma, M. “A Review of K-mean Algorithm”. (2013).
International Journal of Engineering Trends and Technology, Vol.4 Isuue.7, pp. 2972–2976.
6. Patel K.M.A & Thakral.P, "The best clustering algorithms in data
mining," 2016 International Conference on Communication and
Signal Processing(ICCSP),Melmaruvathur,2016,pp.2042-2046. doi: 10.1109/ICCSP.2016.7754534
7. Rodriguez, M. Z., Comin, C. H., Casanova, D., Bruno, O. M.,
Amancio, D. R., Costa, L. da F., & Rodrigues, F. A. (2019).
“Clustering algorithms: A comparative approach”. In PLoS ONE (Vol.
14). https://doi.org/10.1371/journal.pone.0210236
8. Ali, H. H., & Kadhum, L. E. (2017). “K- Means Clustering Algorithm
Applications in Data Mining and Pattern Recognition”. International
Journal of Science and Research (IJSR), Vol.6 Issue.8, pp.1577–1584. https://doi.org/10.21275/ART20176024
9. Singh,S., & Gill, N.S. (2013). “Analysis and Study of K-Means
Clustering Algorithm”. International Journal of Engineering
Research & Technology. Vol.2 Issu.7, pp. 2546-2551
10.Oyelade, O. J., Oladipupo, O. O., & Obagbuwa, I. C. (2010). “Application of k Means Clustering algorithm for prediction of
Students Academic Performance”. International Journal of Computer