International Journal of Innovative Technology and Exploring Engineering (IJITEE) ISSN: 2278-3075, Volume-8 Issue-10 August, 2019
Automatic Eye Screening Method Based on a Multi
-Anatomical Retinal System Segmentation with the
Help of Morphology & Fuzzy Logic
Tulasi vitta, Shaik saheb basha,
ABSTRACT: Eye examination is used to determine Retinal problems at an early stage. Retina screening can be used to detect various hidden retinal problems including pre-diabetes and diabetes. The doctors will depend on segmentation results of retinal structures to determine the abnormalities in the eye. A novel algorithm for instant identification and segmentation of the optic disk (OD) and detection of exudates in human retinal images is described in this document. The proposed technique uses segmentation methodology for automatically detecting of these structures. This methodology uses morphology theories and fuzzy techniques to detect the structures even in pathological images. The performance is evaluated using two datasets that is DRISHI-GS (optic disc) and DIARETD1 (exudates). Present methods have accuracy and efficiency is less, but in the proposed new novel method i.e morphology based fuzzy logic, we achieved an accuracy 92.91% and PPV (positive predictive value) is 89.54% in optic disc. specificity and F-score also trained with help of subjected method 99% and 93.17% in exudate .
KEYWORDS: Retinal structures, optic disc, exudates, morphological theory, fuzzy logic, fuzzy c-means, convex hull transform.
INTRODUCTION:
Despite of the fact that the retina lives in a fringe area, it has some portion of the focal sensory system, speaking to bit of the neural eye [1]. The morphological diversity in retinal anatomical systems provides an exceptional indicative motivation as it includes important information for identifying as well as analysing a retinal pathology variation. One of the significant sickness that can hit the strength of eye in all is the diabetes. Diabetic nephropathy between many working-age people is one of the most well-known triggers of sight misfortune. Approximately 50% of instances of sensory impairment can be prevented by premature summary and occasionally by retinaltesting. In beginning times of diabetic retinopathy, no extreme manifestations can be noticed, be that as it may, over the time, numerous manifestations start to show up and its seriousness expanded religiously through instant [4]. Normally, diabetic retinopathy method starts as a small adjust in retinal veins; in this way, the first variation from the normality container be distinguished is the presence of Microaneurysms. At that point, it influences the optic circle (optic nerve head) prompting variations in the optic circle outline.
Revised Manuscript Received on August 5, 2019
Tulasi Vitta 1, Department of ECE, G. Pulla Reddy Engineering College,(Autonomous), Kurnool, A.P. India
Dr. Shaik Saheb Basha 2, Professor, Department of ECE, G.Pulla Reddy Engineering College, Kurnool, A.P. India
On the off chance that retinopathy is identified sufficiently early, treatment can stop it deteriorating. Something else, indications become perceptible with time, moreover, it is more difficult to treat [2].
RELATED WORK:
Help of Morphology & Fuzzy Logic
The main drawback of these works is, it detects only onedisease or structure and another disadvantage is that it depends on other works for segmentation of target structure. The main goal of this paper is it detects more than one result by using the same algorithm which focuses on reducing of computation task and time.
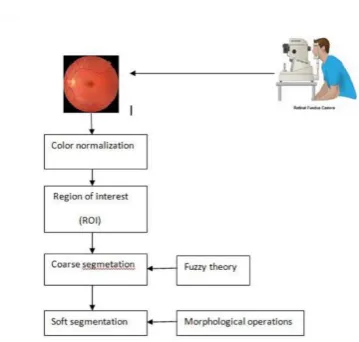
PROPOSED SYSTEM:
The proposed algorithm uses morphology theory and fuzzy c-means algorithm for detecting also segmentation of optic disk and exudates. For segmentation of these structures region wise Thresholding technique is utilized. This algorithm comprises of 3phases. The first stage aims in finding of ROI, second stage aims in coarse segmentation and third step aims in soft segmentation. The result of segmentation structures is shown below in the crystal format. The system algorithm uses same methodologies
The flowchart of the proposed system is shown in fig 2. It contains of three steps finding the ROI is the first step, second step is coarse segmentation and last step is soft segmentation. Fuzzy theory is used in second step and morphological operations is followed by convex hull transform is used in last step.
OPTIC DISC:
STEP 1: The major idea of this step is to find ROI that is, to find the area of optic nerve head, square window around the region is obtained.
FIGURE3: Optic disk
Optic disc is almost round in shape, so we go for Hough transform. Edge map will be the first step to this. The performance will be increased by perfectly selecting the center for that fuzzy c means clustering is adopted. The first process is to extract red layer from the color image by using the below equation.
I R retina = ⱹR ( I RGB retina) ⱹR(.) (1)
Eq1 indicates the red layer extraction. opticnerve head can be seen clearly in the red layer than the remaining structures. To increase the visual color of the image CLAHE operator is utilized. I enhanced retina=ⱹ CLAHE (IRretina)
ⱹ CLAHE(.) (2)
indicates the CLAHE operator. Median filter is used to increase the enhancement and is applied to FCM algorithm.
(a)
(b)
to
segment
these
two
structures.
[image:2.595.47.227.422.593.2]Figure1:
Crystal ofSegmentation structures.
International Journal of Innovative Technology and Exploring Engineering (IJITEE) ISSN: 2278-3075, Volume-8 Issue-10 August, 2019
(c)
Figure4: (a) color image(b)red layer (c)CLAHE operator.
As an initial move en route for edge map extraction is to
spread on an 25-bunches FCM calculation on separated I
improved retina picture through a objective of generally
combining OD pixels hooked on one bunch also the other
24 bunches were devoted aimed at additional encompassing
tissues. This task yields a 25-dim scaled picture IFCM
I FCM bw (3)
Ibw FCM indicates gray image where c=25 bunches. The targeted edge map consists of noises and other residues to remove this we go for morphological dilation operation. Then we go for Hough transform with resultant edge maps.
HOUGH TECHNIQUE:
It is that in the focal region of the table the reverse rows to the top function of a triangle bend (harmonize). Therefore, if we are unlikely to write reverse rows to each border pixel of our border chart, at that point districts of circles focuses will show up as splendid 'problem area' because of aggregate opposite lines there. Hough technique can be determined utilizing various methodologies: Directional data (paths), blunder charge (mapping) and variable room placing of a vote. Because we only have one lens tray for each image of the retina fundus, our circle-looking problem is reduced to one ring. We are using the last methodology in this manner. Parametric room placing a vote strategy remains as it is pursued: optic tray can be described as a ring-moulded object in the y and z fund screen image para as indicated metrically as
(x-a)2 +(y-b)2 =r2 (4)
Where a and b are the instructions of the promising ring concentrate, the optical panel matrix is concerned, and r is the radius. Although shift is a path to alter curve, nervous pixels (forces at (x, y) pixel) are linked in order to create a loop curve. The image focus given by the edge finder is regarded to be focused on the curve of the searched after the specified curve. For each edge pixel .x; y/, a competitor hover of r^€ [R min; R max] can be defined in
a= r^. Sin (ⱺ) ˅ € [0,2 (5)
b= r ^. cos (ⱺ) ˅ € [0,2 (6)
recognizing circle bend that best edge focuses continues through dening a gatherer exhibit
a=(r^, ⱺ) = Ẳ(r^, ⱺ) + 1 (7)
In our job, we separately speculated R min and R max at 75 and 85 pixels lengthy; this spectrum refers to the radii scope of promising models that are regarded in the search for OD ring. This range may fluctuate from one dataset to another depending on the objectives of the fundus picture, as it is compatible with the one dataset due to the standardized nature of the area as well as size of the optical circle. For each border pixel x; y / in Cartesian x y plane of the retina fundus image, a ring curve produced in linear (r^, any) room. Applicant produced hovers converge in pinnacles (Or; ) in Hough change space. Thus, places with greater splendor (collecting people) should be discovered in places where circle center should be discovered. Since we have one ring, one issue area is related to the OD region (max(A(r^,))).
C: OD_ROI WINDOWPANE
Since Hough change identifies the directions (x center ; y
center) of optical plate circle, an ideal circle canister be combined given a span r. Picking sweep esteem relies upon the approval dataset utilized; in light of the fact that each dataset created by means of fundus camera is of specific specifications regarding picture measure and pixel goals. Range esteem r was utilized in our framework to build up the square widows' fringes of optic plate district as it rises to 2.r pixels width. At that point, utilizing MATLAB picture trimming capacity final IODROI is obtained.
STEP2: SEGMENTATION:
Help of Morphology & Fuzzy Logic
The team attention is upgraded until the nearby goal jobcomparison, as shown in Equation is close to null or literally not precisely a predefined little coherent:
J m -cj‖2 (8)
Where m is an exponential weighting capacity which controls the fluidity of the registration work, the number of highlights is set to 2.M. C is a group amount. uij is the enrollment level of xi in bunch j, xi is the dimensionally estimated information ith, cj is the bunch's measuring focus, and is any standard that communicates the similarity between every deliberate element and the inside. Fluffy parceling is carried out by an iterative streamlining of the goal job shown above, with the uij registration extension and Equations ' lot targets cj.
uij (9)
cj (10)
The repition will stop when below equation is fulfilled.
Max ij {| uij(k+1) - uij(k)|} < € (11)
where €is an end rule, 0.00001 for our case. k is the cycle number, it is set to a limit of 200 for our case. This system joins to a neighbourhood least or a seat purpose of Jm. The contribution to the FCM calculation is a lot of highlights. Rhe calculation is made out of the accompanying steps: Stage 1: Initialize the fuzzy segment grid
U = [uij] (U(0)) (12) by creating irregular numbers in the run 0 to 1 subject to Equation
(13)
Stage 2: At k-step: compute the focuses vectors
C(K)=[cj] (14) with U(K) as per the above Equation Stage 3: Update the fluffy segment grid U(K) , U(K+1) by the new processed uij as indicated by Condition 2.
Stage 4: Compute the target work as indicated by the Equation. On the off chance that the distinction between neighbouring estimations of the target work is not as much as end basis (€) at that point stop the emphasis; generally come back to stage 2. The yield from FCM grouping is a rundown of bunch focuses and n enrollment grades for every pixel, where n is various wanted bunches. A pixel will be relegated to the group with most astounding enrollment grade.
Figure5: FCM output of optic disc
STAGE 3:
SOFT SEGMENTATION:
The main goal of this segmentation is to get smooth output. The output of fcm consists of some noise and un necessary residues. so, we go for morphology dilation and opening operations. In order to get perfect shape for optic disc, we go for convex hull transform. This transform adjust all the points in order to get perfect shape of the structure.
PERFORMANCE EVALUTION
The performance is evaluated by using the formulas Sensitivity= TP/TP+FN
Specificity= TN/TN+FP Accuracy= (TN+TP)/TOTAL Precision= TP/FP
F-score= TP+PPV/2 RESULTS:
Figure6: Results of optical segmentation of the DRISHTI-DS dataset. Column 1: original retinal pictures. Column 2: Interest region. Column 3: The truths of the surface correspond. Column 4: Results of
our suggested scheme for optical disk segmentation. Column 5: Overlapping.
TABLE1: Comparison of various optic nerve head segmentation results.
Method sensitivity specificity PPV(positive predictive value) Bharkad et al.
(2017) [9]
74.60% 99.6% 74.96%
Kande et al.(2008)[13]
88.08% 98.78% 54.48%
Lupascu et ai.(2008)[14]
68.48% 99.69% 81.17%
Proposed Method
99.38% 99% 92.40%
TABLE2: optic nerve head performance comparison results based on DRISHTI-GS dataset
Method F-Score
Wong et al. (2008) [15] 91.1%
International Journal of Innovative Technology and Exploring Engineering (IJITEE) ISSN: 2278-3075, Volume-8 Issue-10 August, 2019
Proposed Method 93.17%
The proposed method had segmented the optic disc and have succeed the highest performance in terms of sensitivity, specificity, precision and f-score. Optic disc segmentation is authenticated by exhausting the DRISHTTI-GS dataset. In medical usage if we can adopt this methodology to facilitate the doctors to easily segment optic disc with more accuracy. So, that doctors can detect glaucoma from the patient’s retinal images.
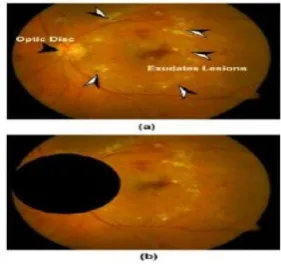
EXUDATES
STEP 1: The existence of exudate fields is 1 of the true pointer of the proximity of diabetic retinopathy. Fig. 11.A shows a visit of a shading retinal fundus situation for a person who has transmitted various exudate fields alongside pixel tier remarks produced by retinal anatomical segment constructions. The extraction of exudate locale of intrigue pursues a similar technique utilized in optic circle extraction. Be that as it may, the district of the optic plate is supplanted with dark locale; in this way, exudate islands can't be misclassified as the optic circle district amid division stage, as appeared in Fig. 9.b.
FIG 7: (A) Color Retinal Image (B) ROI Exudate.
STEP2: SEGMENTATION
The segmentation of exudate region follows the same procedure as that of the optic nerve head instead red region is replaced by black region.
Figure8: FCM output of exudate. STEP 3: SOFT SEGMENTATION
The output of the fcm consists of the some of
misclassified as a result we go for
morphological dilation followed by opening. To get perfect shape we go for same convex hull transform used in optic nerve head.
FIGURE9.Normal example of retinal exudates sores division results utilizing DiaRetDB1 dataset Column 1: Original retinal pictures.
Column2:
Relating ground realities. Column 3: Exudates injuries division after effects of our proposed framework.
Column 4: Superimposed division results. TABLE3: Performance comparision results of exudates using DiaretDB1dataset in pathological
images.
Method Sensitivity Specificity Welfer et al. (2010)[17] 70.48% 98.64%
Liu et al. (2017)[16] 83% 75%
Proposed Method 89.76% 86.72%
Method Accuracy PPV
Liu et al. (2017)[16] 79%
Fraz et al. (2017)[12] 87.72% 87.14%
Proposed Method 92.91% 89.54%
[image:5.595.95.236.380.512.2]Help of Morphology & Fuzzy Logic
CONCLUSION:The proposed methodology is helpful inside detecting and segmenting of exudates. The investigated method is evaluated with the active methods. Our proposed methodology is checked with the DiaRetDB1 dataset. The performance analysis of the proposed method had achieved high in every parameter when compared it with the existing methodologies.
The proposed methodology had detected and segmented the optic disc and exudates in one session by using morphology and fuzzy theory. For medical perceptive the separation of structures is the first stage in the scheme for further improvement of PC related helped analytic frameworks for ophthalmic issues.
The test results proved that the proposed methodology had achieved better results in all parameters such as sensitivity, specificity and accuracy for the similar dataset used. The proposed methodology is robust even if we have utilized the morphology and fuzzy theory. This will be the replacement to the crisp world to fuzzy one.
FUTURE WORK:
The future work of this proposed system can be focussed on segmentation of other retinal structures or organs can be concentrated. The future work will be focused on the two offerings. First there is no need of separate algorithms to segment one issue. The proposed system provides same methodologies for segmentation of more than one structure. Second this algorithm is very power because the performance is high even when it is compared it with other recent methods.
So, for clinical view it is very helpful in detecting more than one structure by using same algorithm.
REFERENCES:
1. J.Almotiri “A multi-anatomical retinal structure segm- entation system for automatic eye screening using Morphology adaptive fuzzy thresholding”opthalmology Vol6 may 2018.
2. M. S. Haleem, L. Han, J. van Hemert, B. Li, and A. Fleming "Retinal area detector from Scanning Laser Ophthalmoscope (SLO) images for diagnosing retinal diseases," IEEE journal of biomedical and health informatics, vol. 19, pp. 1472-1482, 2015.
3. H. Kolb, "Simple anatomy of the retina," 2012.
4. B. Harangi and A. Hajdu, ``Automatic exudate . detection by fusing multiple active contours and regionwiseclassi_cation,'' Comput. Biol. Med.,vol. 54, pp. 156_171, Nov. 2014.
5. M. S. Haleem, L. Han, J. van Hemert, B. Li, and A. Fleming "Retinal area detector from Scanning Laser Ophthalmoscope (SLO) images for diagnosing retinal diseases," IEEE journal of biomedical and health informatics, vol. 19, pp. 1472-1482, 2015
6. J. Cheng et al., ``Superpixelclassi_cation based optic Disc and optic cup segmentation for glaucoma screening,'' IEEE Trans. Med. Imag., vol. 32,no. 6, pp. 1019_1032, Jun. 2013.
7. S. Bharkad, ``Automatic segmentation of optic disk in retinalimages,''Biomed. Signal Process. Control, vol. 31, pp. 483_498, Jan. 2017.
8. C. A. Lupascu, D. Tegolo, and L. Di Rosa, ``Automated detection of opticdisc location in retinal images,'' in Proc. 21st IEEE Int. Symp. Comput. Based Med. Syst. (CBMS), Jun. 2008, pp. 17_22.
9. A. Sopharak, B. Uyyanonvara, and S. Barman, ``Automatic exudate detection from non-dilated diabetic retinopathy retinal images using fuzzy C-means clustering,'' Sensors, vol. 9, no. 3, pp. 2148_2161, 2009.
10. M. M. Fraz, W. Jahangir, S. Zahid, M. M. Hamayun, and S. A. Barman,``Multiscale segmentation of exudates in retinal images using contextual cues and ensembleclassi_cation,'' Biomed. Signal Process. Control,vol. 35, pp. 50_62, May 2017.
11. T. Yedidya and R. Hartley, "Tracking of Blood Vessels in Retinal Images Using Kalman Filter," in 2008 Digital Image Computing: Techniques and Applications, 2008, pp. 52-58.
12. D. W. K. Wong et al., ``Level-set based automatic cup-to- discratiodetermination using retinal fundus images in ARGALI,'' in Proc. 30thAnnu. Int. Conf. IEEE Eng. Med. Biol. Soc. (EMBS), Aug. 2008,pp. 2266_2269
13. M. U. Akram, S. Khalid, A. Tariq, S. A. Khan, and F. Azam, ``Detection and classi_cation of retinal lesions for grading of diabetic retinopathy,''Comput. Biol. Med., vol. 45, pp. 161_171, Feb. 2014. 14. D. Welfer, J. Scharcanski, and D. R. Marinho, ``A coarse- to-_ne
strategy for automatically detecting exudates in color eye fundus images,'' Comput.Med. Imag. Graph., vol. 34, pp. 228_235, 2010. 15. T. Mapayi and J.-R. Tapamo, ``Difference image and fuzzy C-means
for detection of retinal vessels,'' in Proc. IEEE Southwest Symp. Image Anal.Interpretation (SSIAI), Mar. 2016, pp. 169_172.
16. V. R. P. Borges, D. J. dos Santos, B. Popovic, and D. F. Cordeiro, ``Segmentation of blood vessels in retinal images based on nonlinear _ltering,'' in Proc. IEEE 28th Int. Symp. Comput.-Based Med. Syst., Jun. 2015,pp. 95_96.
17. R. GeethaRamani and L. Balasubramanian, ``Retinal blood vessel segmentationemploying image processing and data mining techniques for computerized retinal image analysis,'' Biocybernetics Biomed. Eng., vol. 36 no. 1, pp. 102_118, 2016.
18. S.SahebBaha and Dr.K.Satya Prasad, “Automatic Detectionof Hard Exudates in Diabetic Retinopathy Using Morphological Segmentation and FuzzyLogic,” IJCSNS International Journal of Computer Science and Network Security, VOL.8 No.12, December 2008.
Author Details
BIOGRAPHY:
S.Saheb Basha received B.E degree in Electronics &Communication Engineering from Gulbarga University, Gulbarga, Karnataka, India in 1992 and M .Tech degree in Digital Systems& Computer Electronics from JNTU College of Engineering, Anantapur, Andhra Pradesh, India in 2002 and Ph.D from JNT University, Kakinada, Andhra Pradesh, India in 2011.
He started his career as Assistant Engineering Production Department from 1992 t0 1995 in Bull Power Systems Ltd, Hyderabad, India and later as Senior Engineer in Design & Development Section from 1995 to1998 in Bull Power Systems Ltd, Hyderabad, India. He joined in Madina Engineering College, Kadapa, Andhra Pradesh as Assistant Professor in Electronics &Communication Department in 1999 and served till 2015 at different capacities, viz., Associate Professor, Professor, Vice Principal and Principal. He worked as Head of the Department in the department of ECE in Chaitanya Bharathi Institute of Technology, Proddatur, A.P from 2015 t0 2017. Presently he is working as Professor in G .Pulla Reddy Engineering College, Kurnool, A.P. He published 18 technical papers in National & International conferences & Journals. At present heisguiding2Ph.D scholars. His areas of Research include Image Processing, Neural Networks etc. Recently he filed a
Patent titled “A System for Managing Power Conductors”. He is a life member of ISTE &IE.