Combined Economic Emission Dispatch Problem using
Particle Swarm Optimization
Anurag Gupta
Research scholar Deptt. Of Electrical Eng .
MITS,Gwalior
K. K. Swarnkar
Assistant Professor Deptt. Of Electrical Engg
MITS,Gwalior
K. Wadhwani
Phd, Associate Professor Deptt. Of Electrical Engg
MITS,Gwalior
ABSTRACT
This paper deals with particle swarm optimization (PSO) method to solve Combined Economic emission Dispatch Problem (CEEDP)of thermal units while satisfying the constraints such as generator capacity limits, power balance and line flow limits. PSO is a stochastic optimization process based on the movement and intelligence of swarms. The objective is to minimize the total fuel cost of generation and environmental pollution caused by fossil based thermal generating units. The bi-objective problem is converted into single objective problem by introducing price penalty factor to maintain an acceptable system performance in terms of limits on generator real power outputs, transmission losses with minimum emission dispatch. The proposed approach has been evaluated on an IEEE 30-bus test system with six generators. The results obtained with the proposed approach are compared with results of genetic algorithm and other technique.
Keywords
Economic Load Dispatch, Economic Emission Dispatch, combined Economic Emission Dispatch, Particle Swarm Optimization.
1.
INTRODUCTION
This paper work deals with the economic problem namely the economic thermal power dispatch with emission dispatch due to toxic gases. In seeking the solution for the combined economic emission dispatch problem (CEEDP) the main aim is to operate a power system in such a way to supply all the loads at the minimum fuel cost of generation and environmental pollution caused by emission of toxic gases of fossil based thermal generating units. The solution technique which is applied to the CEEDP is particle swarm optimization (PSO) method. In electric power system operation, the objective is to achieve the most economical generation policy that could supply the local demands without violating constraints. Thermal stations, during power production, burn fossil fuels that generate toxic gases in their effluent and these become a source of pollution for the environment. The CEEDP calculation optimizes the static operating condition of a power generation-transmission system with security of quality of service.
The Combined Economic emission load dispatch problem(CEEDP) is one of the fundamental issue in power systemoperation.In recent years the economic dispatch problem has become increasingly concerned with environment matters due to emission of several contaminants such as sulphur dioxide (SO2) ,oxides of Nitrogen (NOx) into atmosphere from fossil fuels generating units. The CEEDP has been usually considered as the minimization of an objective function representing the generation cost and/or the transmission loss. The constraints involved are the physical laws governing the power generation-transmission systems and the operating limitations of the equipment.
One of the most recent metaheuristic algorithms, the Particle Swarm Optimization (PSO), is a population based stochastic optimization technology [1, 2] by Eberhart and Kennedy in 1995, inspired by social behaviour of bird flocking and fish schooling. It is used for optimization of continuous non linear functions.PSO is applied to different areas of power systems to minimize real power system losses [3]. The proposed approach has been examined and tested on the standard IEEE 30-bus test system with six generating units with different objectives that reflect fuel cost minimization, voltage profile improvement, and voltage stability enhancement.
The PSO is a swarm intelligence algorithm, inspired by the social dynamics and emergent behaviour that arises in socially organized colonies. The PSO algorithm exploits a population of individuals to probe promising regions of search space. In this context, the population is called swarm, and the individuals are called particles or agents. Each particle moves with an adaptable velocity within the regions of search space and retains a memory of the best position it ever encountered. The rest position ever attained by each particle of the swarm is communicated to all other particles [4].
The concept of PSO originated as a simulation of a simplified social system. This method is based on researches about swarms such as fish schooling and a flock of birds. According to the research results for a flock of birds, birds find food by flocking (not by each individual).
According to the observation of behaviour of people during a decision process, people utilize two important kinds of information. The first one is their own experience; that is, they have tried the choices and know which state has been better so far, and they know how good it was. The second one is other people‟s experiences; that is, they have knowledge of how the other individuals (agents) around them have performed. They know which choices of their neighbours have been found as more positive and also the positiveness of the pattern. Each agent decides the decision using individual experiences and other people‟s experiences [5].
In recent years, environmental constraint started to be considered as part of electric system planning. That is, minimization of pollution emission (NOx, SOx, CO2, etc.) in case of thermal generation power plants. However, it became necessary for power utilities to count this. Constraint as one of the main objectives, which should be solved together with the cost problem. Thus, we are faced with a multi-objective problem.
fuel cost and NOx emission control. More than 6 small-sized test cases were used to demonstrate the performance of the proposed algorithm. Consistently acceptable results were observed In a recent paper [10, 11], the authors presented the application of the Particle Swarm Optimization (PSO) method to the Optimal Power Flow problem for a large scale power system. The objective function considers at the same time the cost of the power generation, the transmission loss and the voltage deviation. Numerical results for IEEE 30-bus test systems with six generating units show that a PSO technique can generate an efficiently high quality solution and with more stable convergence characteristics than genetic algorithms (GA).
2.
PROBLEM FORMULATION
The optimization of cost of generation has been formulated based on combined economic dispatch with emission and line flow constraints. For a given power system network, the optimization cost of generation is given by the following equation.
a. Economic Objective Function : The most commonly used objective „Economic Load Dispatch with pollution‟ problem formulation is the minimization of the total operating cost of the fuel consumed for producing electric power within a schedule time interval.
𝐹 = 𝑎𝑖+ 𝑏𝑖𝑃𝑔𝑖+ 𝑐𝑖𝑃𝑔2𝑖
𝑁𝑔
𝑖=1
(1) where
F-is fuel cost of 𝑖𝑡 generator in $/hr.
𝑃𝑔𝑖-is the generator power output of 𝑖
𝑡 generator in MW.
𝑖- represents the corresponding generator (1,2,...n)
𝑁𝑔- represents number of generators.
𝑎𝑖, 𝑏𝑖, 𝑐𝑖- are the fuel cost coefficients.
The equation (1) is subjected to the following constraints: i. The inequality constraints on real power generation
𝑃𝑔𝑖 of each generation 𝑖. 𝑃𝑔𝑖
𝑚𝑖𝑛 ≤ 𝑃 𝑔𝑖≤ 𝑃𝑔𝑖
𝑚𝑎𝑥 (2)
Where 𝑃𝑔𝑚𝑖𝑛𝑖 and 𝑃𝑔𝑚𝑎𝑥𝑖 are respectively minimum and
maximum values of real power generation 𝑖.
ii. The cost is optimized with the following power system balance constraints.
𝑃𝑔𝑖 = 𝑃𝐷+
𝑁𝑔
𝑖=1 𝑃𝐿 (3) Where
𝑃𝑔𝑖 -is the real power generation of 𝑖
𝑡 generator.
𝑃𝐷 - is the load of the system in MW.
𝑃𝐿 - is the transmission loss of the system in MW.
𝑁𝑔- is the total number of generators.
iii. The total transmission network losses the power system is obtained by
𝑃𝐿= 𝐵𝑜𝑜𝑃𝑔𝑖+ 𝑃𝑔𝑖𝐵𝑖𝑗𝑃𝑔𝑗
𝑁𝑔
𝑗 =1
𝑁𝑔
𝑖=1 (4)
Where
𝐵𝑜𝑜, 𝐵𝑖𝑗, 𝐵𝑜𝑖 - are the transmission loss coefficientsm 𝑖, 𝑗 represent the number of lines
.
b. Emission objective function: The total emission release can be expressed as –
𝐸𝑖(𝑃𝑔𝑖) = 𝑎𝑖𝑃𝑔2𝑖+ 𝛽𝑖𝑃𝑔𝑖+ 𝛾𝑖 (5)
Where
𝐸𝑖 - Total emission release in kg/hr
𝑃𝑔𝑖 - is the generator power output of the 𝑖𝑡 generator in 𝑀𝑊
𝑖 – represents the corresponding generator (1,2,...n) 𝑁𝑔 - Total number of generator
𝛼𝑖, 𝛽𝑖, 𝛾𝑖 - are 𝑁𝑂𝑥 emission coefficients.
To determine the combined effect of cost and emission, the price penalty factor has to be computed. It blends the generation and emission cost into single objective nature. The price penalty factor is computed by interpolating the values of
𝑖 for last two units by satisfying the corresponding load demand and it is given by the relation (considering the power associated with each unit).The resulting array elements are arranged in ascending order , after arranging the maximum power of each unit is added one at a time starting from the smallest price penalty factor unit until the summation equals or exceeds the power demand. The price penalty factor at the unit when added exactly meets or exceeds the demand is represented as 𝑖2 and the price penalty factor of the previous unit is represented as 𝑖1 in recent analysis of venkatesh et al. have shown that this method of calculation of price penalty factor furnished good result and it is represented by the following equation-
𝑍 = 𝑖1+
𝑖2−𝑖1
𝑃𝑚𝑎 𝑥2−𝑃𝑚𝑎𝑥 1 ∗ (𝑃𝐷− 𝑃𝑚𝑎𝑥1)
(6)
Where
𝑍 - Price penalty factor in $/Kg.
𝑖1- Price penalty factor associated with the last unit in $/Kg.
𝑖2 – Price penalty factor with the current unit in $/Kg. 𝑃𝑚𝑎𝑥1 - maximum power associated with the last unit in 𝑀𝑊.
𝑃𝑚𝑎𝑥2 - maximum power associated with the current unit in
𝑀𝑊.
c. Total objective function: The economic dispatch and emission dispatch are considerably different. The economic dispatch deals with only minimizing the total fuel cost (operating cost) of the system violating the emission constraints. On the other hand emission dispatch deals with only minimizing the total emission of 𝑁𝑂𝑥 from the system violating the economic constraints. Therefore it is necessary to find out an operating point, that strikes a balance between cost and emission. This is achieved by combined economic and emission dispatch (CEED).The multi-objective combined economic and emission dispatch problem is converted into single optimization problem by introducing price penalty factor𝑍.
Minimize 𝜑 = 𝐹 + 𝑍 ∗ 𝐸 (Rs./hr) (7)
3.
PARTICLE SWARM OPTIMIZATION
a. Description of Particle Swarm Optimization method
swarm optimization works by adjusting trajectories through manipulation of each coordinate of a particle. Let i x and i v denote the positions and the corresponding flight speed (velocity) of the particle i in a continuous search space, respectively.
The particles are manipulated according to the following equations.
𝑣𝑖(𝑟+1)= 𝑤. 𝑣𝑖(𝑡)+ 𝑐1. 𝑟1. 𝑥𝑔𝑏𝑒𝑠𝑡 𝑡 − 𝑥𝑖 𝑡 + 𝑐2∗ 𝑟2∗
𝑥𝑖𝑝𝑏𝑒𝑠𝑡 𝑡 − 𝑥𝑖 𝑡 (8)
𝑥𝑖(𝑡+1)= 𝑥𝑖(𝑡)+ 𝑣𝑖(𝑡+1) (9)
Where:
t: pointer of iterations (generations). w: inertia weight factor.
c1, c2: acceleration constant.
r1, r2: uniform random value in the range (0, 1). (t) 𝑣𝑖(𝑡): Velocity of particle i at iteration t.
𝑥𝑖(𝑡): current position of particle at iteration t.
𝑥𝑖𝑝𝑏𝑒𝑠𝑡 𝑡 : previous best position of particle t at iteration t. 𝑥𝑔𝑏𝑒𝑠𝑡 𝑡 : best position among all individuals in the population At iteration t.
𝑣𝑖(𝑡+1): new velocity of particle i. 𝑥𝑖(𝑡+1): new position of particle i.
b. PSO applied to ELDPP
Our objective is to minimize the objective function of the ELDPP defined by (6), taking into account the equality constraints and the inequality constraints.
The cost function implemented in PSO is defined as:
𝐹 𝑥 =
𝛼. [ 𝑛𝑔𝑖=1(𝑎𝑖+ 𝑏𝑖𝑃𝑔𝑖+ 𝑐𝑖𝑃𝑔𝑖2)] + 1 − 𝛼 . [𝑤. 𝑛𝑔𝑖=1(𝑎𝑖+
𝑏𝑖𝑃𝑔𝑖+ 𝑐𝑖𝑃𝑔𝑖2 + 𝑑𝑖𝑒𝑒𝑖𝑝𝑔𝑖)] (10)
To minimize F is equivalent to getting a maximum fitness value in the searching process. The particle that has lower cost function should be assigned a larger fitness value. The objective of OPF has to be changed to the maximization of fitness to be used as follows:
𝑓𝑖𝑡𝑛𝑒𝑠𝑠 = 𝑓𝑚𝑎𝑥
𝐹
(11)
Where,
𝑓𝑚𝑎𝑥: the maximum of F,( 𝑃𝑔𝑖= 𝑃𝑔𝑖𝑚𝑎𝑥)
The search of the optimal control vector is performed using into account the real power flow equation defined by (7) which present the system transmission losses (Ploss). These losses can
be approximated in terms of B coefficients as [34]:
𝑃𝑙𝑜𝑠𝑠 = 𝑃𝑔𝑖. 𝐵𝑖𝑗. 𝑃𝑔𝑗
𝑛𝑔 𝑗 =1 𝑛𝑔
𝑖=1 (12)
The Bij coefficients are obtained from a power flow
solution. These losses are introduced in the represented as a penalty vector given by:
𝑝𝑓 = 1 −𝜕𝑃𝑙𝑜𝑠𝑠
𝜕𝑃𝑔
−1
(13)
In this method only the inequality constraints on active powers are handled in the cost function. The other inequality constraints are scheduled in the load flow process. Because the essence of this idea is that the inequality constraints are partitioned in two types of constraints, active constraints that affect directly the objective function are checked using the PSO-OPF procedure and the reactive constraints are updating using an efficient Newton Raphson Load flow (NR) procedure. Our objective is to search (Pgi) set in their admissible limits to achieve the optimization problem. At initialization phase, (Pgi) is selected randomly between Pgimin and Pgimax. After the
search goal is achieved, or an allowable generation is attained by the PSO algorithm. It is required to performing a load flow solution in order to make fine adjustments on the optimum values obtained from the PSO procedure. This will provide updated voltages, angles and points out generators having exceeded reactive limits. to determining all reactive power of all generators and to determine active power that should be given by the slack generator taking into account the deferent reactive constraints. Examples of reactive constraints are the min and the max reactive rate of the generators buses and the min and max of the voltage levels of all buses. All these require a fast and robust load flow program with best convergence properties. The developed load flow process is based upon the NR algorithm using the optimal multiplier
technique [35, 36].
The PSO algorithm applied to ELDPP can be described in the following steps.
Step 1: Input parameters of system, and specify the lower and upper boundaries of each control variable.
Step 2: The particles are randomly generated between the maximum and minimum operating limits of the generators.
Step 3: Calculate the evaluation value of each particle using the objective function.
Step 4: Calculate the fitness value of objective function of each particle using (12). xibest is set as the i th particle‟s initial position; xgbest
is set as the best one of xibest. The current evolution is t =1.
Step 5: Initialize learning factors c1, c2, inertia weight w and the initial velocity v1.
Step 6: Modify the velocity v of each particle according to (9).
Step 7: Modify the position of each particle according to (10). If a particle violates its position limits in any dimension, set its position at the proper limits. Calculate each particle‟s new fitness; if it is better than the previous xgbest, the current value is set to be xgbest.
Step 8: To each particles of the population, employ the Newton- Raphson method to calculate power flow and the transmission loss.
Step 9: Update the time counter t= t +1.
Step 10: If one of the stopping criteria is satisfied then go to step 11.Otherwise go to step 6.
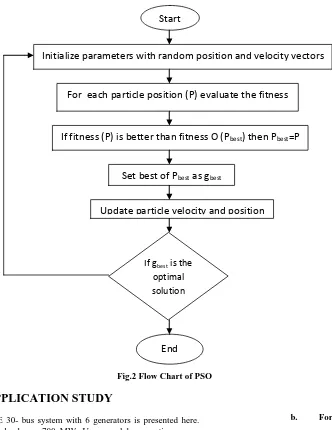
Fig.2 Flow Chart of PSO
4. APPLICATION STUDY
[image:4.595.81.413.74.504.2]The IEEE 30- bus system with 6 generators is presented here. The total load was 700 MW. Upper and lower active power generating limits and the unit costs of all generators of the IEEE 30-bus test system are presented in Table 1 (a).
Table.1
Power generation limits and cost coefficients for Six Generator unit systems
a.For Economic dispatch
Unit
𝒂
$ ∕ 𝒉𝒓 $ 𝑴𝑾𝒃 . 𝒉𝒓 $ 𝑴𝑾𝒄 𝟐. 𝒉𝒓 (𝑴𝑾) 𝑷𝒈𝒎𝒊𝒏 (𝑴𝑾) 𝑷𝒈𝒎𝒂𝒙
01
02
03
04
05
06
756.7988 6 451.3351
3 1049.997
7 1243.531
1 1658.559
6 1356.659
2
38.5397
46.1592
40.3964
38.3055
36.3278
38.2714
0.15247
0.10587
0.02803
0.03546
0.02111
0.01799 10
10
35
35
130
125 125
150
225
210
325
315
The NOx emission characteristics of generators are grouped in Table 1 (b).
b. For emission Dispatch
[image:4.595.348.548.487.587.2]
The results including the generation cost, the emission level and power losses are compared for economic dispatch and emission dispatch using Particle Swarm Optimization (PSO).
Table.2
Comparison For Economic & Emission Results For PSO
Dispatch Economic Dispatch
Emission Dispatch
P1 (MW) 30.712 80.3178
P2 (MW) 18.681 83.4732
P3 (MW) 130.568 111.0704
P4 (MW) 134.288 116.6904
P5 (MW) 206.088 157.919
Unit 𝜶 β ϒ
01 02 03 04 05 06
0.00491 0.00419 0.00683 0.00683 0.00461 0.00461
0.32767 0.32767 -0.54551 -0.54551 -0.514116 -0.514116
13.85932 13.85932 40.26690 40.26690 42.89553 42.89553
Start
Initialize parameters with random position and velocity vectors
For each particle position (P) evaluate the fitness
If fitness (P) is better than fitness O (P
best) then P
best=P
Set best of P
bestas g
bestUpdate particle velocity and position
If gbest is the optimal solution
P6 (MW) 198.252 167.0772
PL (MW) 18.581 16.536
PD (MW) 700 700
Fuel Cost ($/hr)
1663066.3 1715938.0
Emission Release (kg./hr)
480.174 432.048
[image:5.595.72.263.73.164.2]This table gives the optimum generations for minimum total cost for six generating units in three cases: minimum generation cost without using into account the emission level as the objective function (α=1), a total minimum emission is taken as the objective of main concern (α=0), and at last combined economic emission dispatch (0<α<1). As seen by the optimal results shown in the table 3, there is a trade off between the fuel cost minimum and emission level minimum. The difference in generation cost between these two cases 48,411 $/hr (1726402.5 $/hr compared to 1677991.5 $/hr), in real power loss 6.33MW (26.57 MW compared to 20.24 MW) and in emission release 54.382 kg. /hr (495.348 kg. /hr compared to 437.966 kg, /hr) clearly shows this trade-off. The penalty factor is considered as Z=2015.46$/hr for 700 MW.
Table 3
Results of minimum total cost for IEEE 30-bus system in three cases
Case I. For Economic Dispatch
Method Conventinal GA PSO Fuel Cost
($/hr)
1677991.5 1671208.2 1663068.1
Emission Release (kg./hr)
495.348 489.559 494.9329
PL (MW) 26.570 23.124 19.164
Execution Time (sec.)
0.25 1.21 1.16
Case II. For Emission Dispatch
Method Conventinal GA PSO
Fuel Cost ($/hr)
1726402 1718388 1715940
Emission Release (kg./hr)
437.966 435.075 434.130
PL (MW) 20.240 17.366 16.551
Execution Time (sec.)
0.26 1.21 1.32
Case III. For Combined Economic Emission Dispatch
Method Conventinal GA PSO
Fuel Cost ($/hr) 1700185 16712082 1663068 Emission
Release (kg./hr)
442.255 489.559 494.9329
PL (MW) 21.17 23.124 19.164
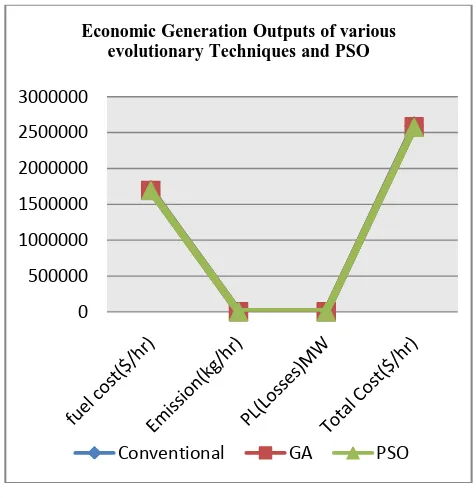
Total Cost ($/hr) 2592167.25 2580578.55 2574855.00
The best solution is approached by PSO as shown in fig.b.In this figure the comparison of all outputs is compared with other evolutionary techniques.
PSO Based Combined Economic Emission Dispatch- In the proposed approach the minimum solution is obtained for PSO based combined economic emission dispatch with line flow constraints for IEEE 30 BUS system. The line flows in MVA of the best generation schedule for IEEE 30 BUS system were shown in table 4 for different power demand as PD=500 MW
and price penalty factor Z=1954.4 & PD=900 MW and price
penalty factor Z=2152.99.
Fig. (b) Economic Generation Outputs of various evolutionary techniques and PSOTable. 4 Comparison between PSO and GA results for Combined Emission & Economic Load Dispatch for Different Demand
PD
(MW)
Performan ce
Conve ntional
GA PSO
500 Z=1975 .4
Fuel cost($/hr) Emission (kg/hr) PL (MW)
Total Cost($/hr)
12437 23.5 262.45 4
8.53 17621 77.5
12461 44.9 263.47 2
10.135 17665 87.5
12437 10 263.26 3
8.65 17637 75
900 Z=2152 .99
Fuel cost($/hr) Emission (kg/hr) PL (MW)
Total Cost($/hr)
22001 80.5 701.42 8
35.23 37096 46.1
21855 37.5 694.17 2
29.718 36793 98.0
21727 35 695.38 3
28.053 36692 08
5. CONCLUSION
This paper introduces a Particle Swarm Optimization algorithm to solve the economic power dispatch of power system with pollution control. The fuel cost and emission are combined in a single function with a difference weighting
0 500000 1000000 1500000 2000000 2500000 3000000
Economic Generation Outputs of various evolutionary Techniques and PSO
[image:5.595.314.552.204.453.2]factor. The main advantage of PSO over other modern heuristics is modelling flexibility, sure and fast convergence, less computational time than other heuristic methods. PSO requires only a few parameters to be tuned, which makes it attractive from an implementation viewpoint. The feasibility of the proposed algorithm is demonstrated on an IEEE 30-bus system. The results show that the proposed algorithm is applicable and effective in the solution of OPF problems that consider nonlinear characteristics of power systems with different objective functions. PSO can generate an efficiently high quality solution and with more stable convergence characteristics than Genetic Algorithm.
6. REFERENCES
[1] M. Huneault, F. D. Galiana, (1991). A survey of the optimal power flow literature, IEEE Trans. Power Syst., Vo1. 6 (2) (pp. 762-770).
[2] A. Momoh, M. E. El-Hawary and R. Adapa, A (1999). Review of Selected Optimal Power Flow Literature to 1993 Part I: Nonlinear and Quadratic Programming Approaches, IEEE Trans. Power Syst., Vol. 14 (1) (pp. 96-104).
[3] A. Momoh, M. E. El-Hawary and R. Adapa, (1999). A Review of Selected Optimal Power Flow Literature to 1993 Part II: Newton, Linear Programming and Interior Points Methods, IEEE Trans. Power Syst., Vol.14 (1) (pp. 105-111).
[4] H. W. Dommel, W. F. Tinney, (1968). Optimal Power Flow Solutions, IEEE Trans. on power apparatus and systems, Vol. PAS-87 (10) (pp. 1866-1876).
[5] K. Y. Lee, Y. M. Park, and J. L. Ortiz, (1985). A United Approach to Optimal Real and Reactive Power Dispatch, IEEE Trans. Power Syst., Vol. PAS-104 (pp. 1147-1153).
[6] M. Sasson, (1969). Non linear Programming Solutions for load flow, minimum loss, and economic dispatching problems, IEEE Trans. On power apparatus and systems, Vol. PAS-88 (4) (pp. 399-409).
[7] T. Bouktir, M. Belkacemi, K. Zehar, (2000). Optimal power flow using modified gradient method, In: Proc. of ICEL‟2000, U.S.T.O, Algeria, Vol. 02 (pp. 436-442). [8] M. Basu, “Particle Swarm Optimization based goal
attainment method for dynamic economic emission dispatch”, Electric Power Components and Systems, vol.34, pp.1015-1025, 20
[9] K. Y. Lee, A. Sode-Yome, and J. H. Park, “Adaptive Hopfield neural network for economic load dispatch,” IEEE Trans. on Power Systems, Vol. 13, No. 2, pp. 519-526, May 1998.
[10] J. B. Park, K. S. Lee, J. R. Shin, and K. Y. Lee, “A particle swarm optimization for economic dispatch with nonsmooth cost functions,” IEEE Trans. on Power Systems, Vol. 20, No. 1, pp. 34-42, Feb. 2005.
[11] T. A. A. Victoire and A. E. Jeyakumar, “Hybrid PSO-SQP for economic dispatch with valve-point effect,”
Electric Power Systems Research, Vol. 71, No. 1, pp. 51-59, 2004.
[12] J. Kennedy and R. C. Eberhart, “Particle swarm optimization,” Proceedings of IEEE International Conference on Neural Networks (ICNN’95), Vol. IV, pp. 1942-1948, Perth, Australia, 1995
. [13] Y. H. Hou, L. J. Lu, X. Y. Xiong, and Y. W. Wu, “Economic dispatch of power systems based on the modified particle swarm optimization algorithm”, Transmission and Distribution Conference and Exhibition: Asia and Pacific, 2005 IEEE/PES, pp. 1-6, 2005.
[14] C.Rani, M.Rajesh Kumar,K.Pavan “Multi-objective Generation Dispatch Using Particle Swarm Optimization” IEEE – IICPE 2006 Indian International Conference on power Electronics Dec 18-19, 2006, Chennai.
[15] Effie Tsoi, Kit Po Wong, Chun Che Fung, “ Hybrid GA/SA algorithms for evaluating trade-off between economic cost and environmental impact in generation dispatch, IEEE Nov 1995.
[16] J. Kennedy and R. C. Eberhart, Swarm Intelligence, San Francisco, CA: Morgan Kaufmann Publishers, 2001. [17] G. Wang and S. He, “A quantitative study on detection
and estimation of weak signals by using chaotic duffing oscillators,” IEEE Trans. On Circuits and Systems-I: Fundamental Theory and Applications, Vol. 50, No. 7, pp. 945-953, Jul. 2003.
[18] R. Caponetto, L. Fortuna, S. Fazzino, and M. G. Xibilia, “Chaotic sequences to improve the performance of evolutionary algorithms,” IEEE Trans. on Evolutionary Computation, Vol. 7, No. 3, pp. 289-304, Jun. 2003. [19] L. Shengsong, W. Min, and H. Zhijian, “Hybrid
algorithm of chaos optimization and SLP for optimal power flow problems with multimodal characteristic,” IEE Proc.-Gener. Transm. Distrib., Vol. 150, No. 5, pp. 543-547, Sep. 2003
[20] M. Clerc and J. Kennedy, “The particle swarm-explosion, stability, and convergence in a multidimensional complex space,” IEEE Trans. On Evolutionary Computation, Vol. 6, No. 1, pp. 58-73, Feb. 2002. [21] M. Clerc, “The swarm and the queen: towards a
deterministic and adaptive particle swarm optimization,” Proceedings of the 1999 Congress on Evolutionary Computation, Vol. 3, pp. 1951-1957, 1999.
[22] Leandro dos Santos Coelho and Chu-Sheng Lee Solving economic load dispatch problems in power systems using chaotic and Gaussian particle swarm optimization approaches” International Journal of Electrical Power & Energy Systems, Volume 30, Issue 5, June 2008, Pages297-