City, University of London Institutional Repository
Citation
:
Okoe, M., Alam, S. S. & Jianu, R. (2014). A Gaze-enabled Graph Visualization
to Improve Graph Reading Tasks. Computer Graphics Forum, 33(3), pp. 251-260. doi:
10.1111/cgf.12381
This is the accepted version of the paper.
This version of the publication may differ from the final published
version.
Permanent repository link: http://openaccess.city.ac.uk/15378/
Link to published version
:
http://dx.doi.org/10.1111/cgf.12381
Copyright and reuse:
City Research Online aims to make research
outputs of City, University of London available to a wider audience.
Copyright and Moral Rights remain with the author(s) and/or copyright
holders. URLs from City Research Online may be freely distributed and
linked to.
City Research Online:
http://openaccess.city.ac.uk/
[email protected]
Eurographics Conference on Visualization (EuroVis) 2014 H. Carr, P. Rheingans, and H. Schumann
(Guest Editors)
Volume 33 (2014),Number 3
A Gaze-enabled Graph Visualization to improve
graph reading tasks
Submission 235
Abstract
Performing typical network tasks such as node scanning and path tracing can be difficult in large and dense graphs. To alleviate this problem we use eye-tracking as an interactive input to detect tasks that users intend to perform and then produce unobtrusive visual changes that support these tasks. First, we introduce a novel fovea based filtering that dims out edges with endpoints far removed from a users view focus. Second, we highlight edges that are being traced at any given moment or have been the focus of recent attention. Third, we track recently viewed nodes and increase the saliency of their neighborhoods. All visual responses are unobtrusive and easily ignored to avoid unintentional distraction and to account for the imprecise and low-resolution nature of eye-tracking. We also introduce a novel gaze-correction approach that relies on knowledge about the network layout to reduce eye-tracking error. Finally, we present results from a controlled user study showing that our methods led to a statistically significant accuracy improvement in one of two network tasks and that our gaze-correction algorithm enables more accurate eye-tracking interaction.
Keywords:Eye tracking, gaze contingent graph vi-sualization.
1. Introduction
Network analysis plays an important part in do-mains such as neuroscience [BS09], genomics and pro-teomics [CCNS08], transportation [KT06], software engineering [GN00], social sciences [BMBL09], or in-telligence analysis [CGM04]. Interaction is instrumen-tal in allowing users to weed through the scale, com-plexity, and clutter inherent to visualizations of real-life networks. Here we explore the use of eye track-ing as an interactive input to detect users’ intentions and support them by slight changes in the visualiza-tion. The use of eye tracking as an input has been ex-plored in the human computer interaction (HCI) com-munity [Duc02], but it has not yet been explored in the area of network visualization.
Specifically, we introduce three types of interac-tions. First, we reduce clutter by using a novel fovea-based filtering that dims edges that pass through the
user’s view focus but have their endpoints far outside of the user’s fovea. Second, we increase the saliency of edges as they are visually traced by the user at any given moment or have been the focus of frequent recent tracings. Third, we keep track of nodes that were recently viewed and increase the salience of their neighborhood. All visual responses are gradual, incre-mental rather than binary, and visually subtle.
Thus, by design, our interactions are gaze-contingent [Duc02]. This means gaze coordinates are used to infer users’ task intentions and the visualiza-tion is changed to support these tasks as unobtrusively as possible to minimize distraction and account for errors of interpretation. This approach also relates to attentive interfaces [Duc02,Sel04] and multimodal in-terfaces [Ovi03] but contrasts with early HCI efforts to use eye-tracking in ways analogue to manual pointing and clicking. Merely connecting eye-tracking input to otherwise conventional network interactions is limited due to the particularities of movements and eye-tracking technology. Specifically, as noted by [ZMI99], the eyes are not a control organ, eye-tracking input is generally low resolution and inaccurate, and the
sence of a trigger analogue to a mouse click is difficult to compensate [Jac90].
An additional contribution of our work is a gaze-correction algorithm that uses knowledge of the visu-alization layout to reduce eye-tracking error. Faulty or insufficient calibration sometimes leads to local-ized screen regions in which gaze-coordinates are offset from the users true viewing point. Our algorithm relies on the known visual positioning of nodes on the screen to detect which nodes users are likely to be looking at.
In a controlled within-subject user study with twelve participants, we evaluated the performance of our gaze-enabled network visualization. We asked par-ticipants to perform two types of tasks: (i) identify whether there is a direct connection between two nodes; and (ii) identify the shortest path between two nodes. In a third task designed to evaluate the ef-ficiency of our gaze correction algorithm, users were asked to select as many nodes as possible in a given time interval by looking at them, with and without gaze correction. Our results were statistically signif-icant (p = 0.02) and showed a 30% improvement in the direct connection task, were not significant in the path task, and showed a significant (p = 0.01) 25% improvement in the node selection task.
2. Related Work
The fovea, a small area in the center of the retina, is responsible for our high resolution vision. The rest of our field of view is low resolution and defined as peripheral. The illusion of complete high definition vision is created by an unconscious scanning pro-cess: the fovea performs quick translations, called sac-cades, during which vision is temporarily blinded, be-tween short moments of focus, called fixations. Eye-tracking technology allows us to locate users’ points of gaze [WM87,Jac91].
Most often, gaze tracing is used for data collec-tion in offline, post hoc analyses of human visual per-ception [Duc07]. Examples of eye-tracking facilitated analyses span a broad range of domains including cog-nitive science, psychology, education, marketing, and interface design. In data visualization, eye-tracking has traditionally been used in post hoc analyses of visualization perception and interpretation. For exam-ple, Huang et al. [HEH08] or Pohl et al. [PSD09] use eye-tracking in the context of understanding network visualization use.
The appeal of the eye’s speed led human com-puter interaction researchers to also explore gaze as an actuatory input in ways analogue to manual in-put (e.g. mouse). This approach has met with lim-ited success due to several reasons. First, while very
fast, gaze-input comes with disadvantages such as low accuracy, jitter, drift, offsets, and calibration needs [Duc07,JK03,TJ00,KPW07]. Second, finding a gaze equivalent of a trigger command is not triv-ial and leads to the Midas touch phenomenon - the inability of the interface to reliably distinguish be-tween looking and controlling [Jac91]. Ultimately, the duration of a fixation, or dwell time, has been es-tablished as the most effective way to trigger com-mands [WM87,Jac91]. However, low dwell thresholds amplify the Midas touch problem by triggering com-mands inadvertently, while high dwell thresholds offset the speed advantage of gaze input.
The current consensus is that eyes are not control organs and should not be treated as such [ZMI99]. In-stead, Jacob proposed that interfaces should use gaze as an indicator of user intention and should react with gradual, unobtrusive changes [Jac91,JK03]. This view is formalized within the concept of attentive inter-faces [ADS05,Ver02,VSCM06,VS08,HMR05,RHN∗03] which“(a) monitor user behavior, (b) model user goals and interests, (c) anticipate user needs, (d) pro-vide users with information, and (e) interact with users” [MMC∗00]. The research described here aligns with this paradigm and also drew inspiration from work in gaze-contingent rendering [OHM∗04,DC¸ 07,
HDO03], where scenes are drawn in high resolution in foveated screen areas and with lower quality in re-gions outside of the user’s focus.
To the best of our knowledge, in visualization in gen-eral and network visualization in particular, eye track-ing has only been used in a diagnostic role. Given the unavoidable connection between eyes and data visual-ization, the fact that people’s gazes are linked to tasks they are performing [YR67], and that eye-tracking is on its way to becoming a component of regular work stations [Duc07,JK03,LBP06], we hypothesize that visualization research can benefit from exploring use of eye-tracking as an input channel. The results pre-sented here demonstrate this approach and introduce concrete techniques and algorithms.
3. Implementation
To develop a gaze responsive network visualization, we focused our methods on two issues: improving gaze ac-curacy and providing interactive visual responses. The interactive responses are: (i)a novel fovea based filter-ing that dims out edges with endpoints far removed from a user’s view focus; (ii) highlighting edges that are being traced at any given moment or have been the focus of recent attention; (iii) tracking recently viewed nodes and increasing the saliency of their neighbor-hoods. We detail these techniques in the following sec-tions.
Submission 235 / A Gaze-enabled Graph Visualization to improve graph reading tasks 3
3.1. Gaze-correction
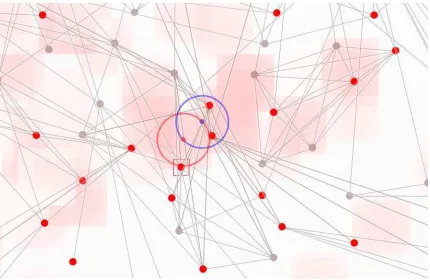
Due to poor or insufficient calibration offsets, reported eye-tracking coordinates are sometimes slightly offset from true gaze positions in some screen areas. We hy-pothesized we can alleviate this problem by leveraging the known network layout, and on the assumptions that users rarely stare at blank screen space and that long fixations correspond to node fixations. Concep-tually, we matched offset-vectors between subsequent long fixations (200-300ms) to offset-vectors between nodes lying close to these fixations (Fig. 1) to iden-tify offsets between reported coordinates and nodes that were likely the target of the users attention. We aggregate these offsets over time, gradually construct-ing and adjustconstruct-ing an offset map over the screen space. This offset map is then used to correct all incoming gaze coordinates. In (Fig.2), we show a depiction of a gaze correction. The magnitude of vectors in the offset map is displayed as a red heatmap, while the centers of the blue and red circles represent corrected gaze and raw gaze respectively.
Concretely, our implementation works as follows. We maintain a list of the last three fixations, as they are delivered by the eye-tracker API. Whenever this list changes we do the following. For each of the three fixations we find the closest three network nodes and we construct nine possible combinations. For each combination we compute a score that averages two components: proximity of the gazes to their corre-sponding nodes; and differences between vectors con-structed between three pairs of gaze points and the three pairs of corresponding nodes. We then choose the best scored configuration, and if it is below a thresh-old, we consider that the current three fixations match those three nodes. This allows us to compute offsets between reported fixation coordinates and likely true coordinates.
Finally, we integrate the currently computed offset into the existing offset map. This map is essentially a partitioning of the screen space into cells of 10x10 pix-els, where each cell contains a two-dimensional vector representing the offset that should be applied to any subsequent gaze landing in that cell. To integrate an offset vector into the map we combine (e.g., weighted average) the current offset vector with the vector cur-rently stored in the map. We also do this for cells neighboring that where the gaze landed, albeit with a decreasing contribution into the current score (e.g., less weight), depending on how far removed the neigh-boring cell is from the reported or center cell.
[image:4.612.319.523.30.159.2]Correction happens in screen space rather than vi-sualization space and as such the computed offset map is bounded in size. This means it can be computed rel-atively quickly and then adjusted on the fly as users
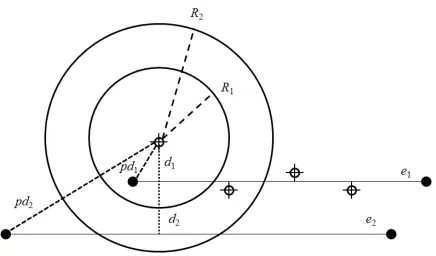
Figure 1:Correcting the gaze input: Even though fix-ations g1, g2, g3 are not exactly over graph vertices
v1, v2, v3 their relative position matches that of the
proximal graph vertices. We therefore conclude that
g1, g2, g3 were fixations on the graph verticesv1, v2, v3.
Figure 2: Gaze correction in our system. The blue circle represents the corrected gaze while the red one matches the raw gaze sample. Red indicates regions with high offsets.
interact with the visualization and viewing conditions change.
We note that in a sense this approach is similar to work by Salvucci et al. [Sal99,SA00] who use Markov and Bayesian models to predict gaze targets based on probable behavior, to that of MacKenzie and Zhang [MZ08] who use letter and word prediction to improve their eye-typing system, and finally to work interpret-ing fixations as part of gaze gestures [DS07,DDLS07].
3.2. Gaze-enabled network interactions
We implemented three types of interactions. The next three sub-sections describe a series of node and edge scores that are computed from gaze data. The fourth sub-section describes how these scores are combined and used during rendering to create visual responses.
[image:4.612.313.528.237.377.2]The last sub-section discusses a few implementation details that apply to all interactions.
[image:5.612.72.290.87.215.2]3.2.1. Gaze-enabled filtering
Figure 3:Foveated edge filtering.
Gaze-enabled edge filtering aims to dim edges that pass through the user’s fovea but have both endpoints far removed from it. To achieve this, given a current gaze point, we compute filtering scores (Sef) for all
edges according to the diagram in Figure3and using Formula1. Specifically, we use two circles centered at the user’s focus point to create a gradual transition be-tween areas in which the filtering is applied (foveated region, inner circle) and where it is not (peripheral region, outside the outer circle). Current edge scores are combined with previous scores to ensure gradual changes in this measure. Finally,Sefis combined with
other saliency measures and used to render edges , as will be described in section 3.2.4.
Sfilt=f(pd) + (1−f(pd))×min(1,
d R2
)
wheref(pd) = 1− pd−R1
R2−R1
(1)
3.2.2. Detecting viewed edges
We also aim to detect edges that are viewed as users are tracing them and increase their saliency. To this end we compute edge viewing scores (Sev) for all
edges.
We first divide edges into segments of equal lengths. A score is maintained for segment endpoints to indi-cate whether recent gazes landed nearby. Each gaze sample landing close to an edge segment endpoint will increase the endpoint’s score by a factor inversely pro-portional to the distance between the gaze and the endpoint. At the same time all scores are gradually decreased each time a new gaze is processed.
These segment endpoint scores are combined into
a total edge score as follows. A bar is extended in both directions of an endpoint with non-zero score (Figure 4). The bar’s length is directly proportional with the magnitude of the score. All bar lengths of an edge are then added together, divided by a constant, in our case 500, and capped to 1. This step ensures edge scores between 0 and 1 and gives preference to edges close to or longer than 500 pixels.
Figure 4:Computing edge score segment bars.
An improvement was introduced to account for a behavior observed during testing. People seemed to require shorter fixations and longer saccades when tracing edges that were fairly isolated or travelling through empty space, but required longer fixations with shorter saccades between them when tracing edges in dense areas. To account for this, we compute a density score for each segment endpoint by adding up the number of other endpoints that lie within a certain distance from it. We use this density score to extend longer bars from low density endpoints and shorter bars from high density endpoints. This ensures that we easily detect views of isolated edges yet at the same time reduce false positives in dense areas where two random fixations could easily match an edge.
Two types of edge viewing scores are computed us-ing this methodology. The first is a short-term score (Sev) that captures edges that are currently viewed.
This score can change between its minimum and max-imum values within a few hundred milliseconds. The second is a long-term score (S′
ev) that captures edges
of interest, those that have been viewed repeatedly in the last several seconds. We use the first score to in-crease or dein-crease the value of the second score by a constant that depends on the desired life-span of the second score.
3.2.3. Detecting sub-networks of interest
Highlighting sub-networks of interest aims to make node neighborhoods that are of current interest more salient. To achieve this we first compute an interest score for each node in a way analogue to edge seg-ment endpoint scores: if a user’s gaze lingers close to a node, its score will be increased by a factor inversely proportional to the distance between the gaze and the node. As in the case of edges, we decay all node scores each time a new gaze is processed.
Once node scores are computed we diffuse them across their neighborhoods. For example, for a current gaze fixationg, the closestmvertices{v1, v2, . . . , vm}
Submission 235 / A Gaze-enabled Graph Visualization to improve graph reading tasks 5
Figure 5:Highlighting of a viewed edge.
get a particular score s. The next level of adjacent ver-tices{vi1, vi2, . . . , vim}for each vi ∈ {v1, v2, . . . , vm}
gets a score of s/f where f is a dividing factor. We continue this diffusion process until vertices in leveln receive score s
fn−1 < twhere tis a threshold. In our
implementation we have keptm= 3 andf= 4. Simi-larly to edges scores, we keep two scores for each node, a short term score Sv computed as described above
and a long term scoreS′
[image:6.612.73.291.328.450.2]vthat is computed fromSv.
Figure 6:Highlighting a sub-network of interest.
3.2.4. Rendering
We described several types of scores computed for nodes and edges. Upon rendering we combine these scores and link them to visual properties such as color and alpha blending. In our implementation we have used the mapping described below. However, we note that other mappings can be explored as long as they are gradual and unobtrusive.
When drawing nodes, the previously described node scoresSv and S′v are factored into the node’s color
and opacity. To compute node color we used formula 2 while for opacity we used formula 3. The four con-stants determine the base color for unviewed nodes,
the saliency for viewed nodes, and weight of each score into the visual response. The values chosen in our evaluated implementation, given color components be-tween 0 and 255, wereC1 = 50,C2 = 30, C3 = 90, C4 = 120.
Red(v) = C1+Sv×C2+Sv′ ×C3
Green(v) = C1
Blue(v) = C1
(2)
Alphav=C1+Sv×C2+Sv′ ×C4 (3)
Similarly, when drawing edges we also varied opac-ity and the red color component to highlight interest-ing edges, as shown in formulas 4, 5, 6. Moreover, we rendered edges in two layers: a short-term layer that highlights edges currently viewed and a long-term layer to highlight edges that have been of interest in the last several seconds or more.
Red(u, v) =C5+C6×Sev
+C7×Sev,long
+C8×(S
′ u+Sv′)
2 Green(u, v) =C5
Blue(u, v) =C5
(4)
Alpha(u, v) =Sef×(C9+C10×Sev)
+C11×(1−Sef)×Sev
(5)
Alpha’(u, v) =Sef×(C12×Sev′ +C13×(S
′ u+Sv′)
2 )
+C14×(1−Sef)
×(C12×Sev′ +C13×(S
′ u+Sv′)
2 )
(6)
In the color computation, C5 indicates the base component of edges (125 in our implementation).C6, C7, and C8 represent the weights given to the three scores they precede. The sum ofC5 throughC8 should be lower than or equal to 1.
Blending edge filtering with edge interest scores is not trivial. If edge filtering scores are simply multi-plied to the interest scores, then a user tracing a long edge may find that the edge disappears while his gaze reaches the edge mid-point. Thus, viewed edges should be “exempt” from filtering. To achieve this, the com-puted alpha values combine two components: what happens when edges are not filtered (the first term
in the summation) and what happens when they are filtered (the second term in the summation). Thus, for short term alphas (Alpha), in the case of non-filtered edges we combine a base component (C9) with a com-ponent determined by ( Sev,short) (C9 +C10<= 1).
The long-term alpha (Alpha’) does not have a base component and thus this layer is invisible for edges that are not of interest.C12 and C13 are weights of the two scores they precede (C12 +C13 <= 1). Fi-nally,C11 andC14 indicate the visibility of edges that should be filtered out but are currently viewed.
3.3. Implementation Notes
Our gaze correction implementation relies on fixa-tions provided by the eye-tracking API. These fix-ations are computed by the API from a stream of gaze-samples acquired at a frequency of 120Hz. As such, they represent a discretization of the actual data stream. Conversely, the gaze interactions described in section 3.2 work directly with individual gaze samples. These small but frequent bits of information are ag-gregated over different time scales to indicate whether nodes and edges are being viewed. The advantage of this continuous approach over using discrete fixations is that responses can be gradual rather than binary, that errors are smaller and less noticeable, and that visual responses can be produced while a fixation is in progress.
All distance thresholds involved in gaze-based inter-actions should be defined in screen space. Whenever computations are done in visualization space, these thresholds need to be adjusted by the zoom level. For instance, the 500 pixel normalization threshold men-tioned in section 3.2.2 refers to lengths on the screen rather than lengths in visualization space and con-versions should be applied whenever necessary. Thus, since bar lengths are computed in model space we lower the 500 pixel threshold by a factor proportional to the zoom level.
4. Evaluation
4.1. Study design
We performed a within-subjects user study to evaluate our gaze-enabled network visualization (eye-tracking condition) against the same visualization without gaze interaction (control condition). The dataset used for the study was a book recommendation network dataset. The network had approximately 900 nodes and 2500 edges and had been drawn using theneato algorithm [?]. The eye-tracker used in the study was a RED120HZ from Sensory Motor Instruments (SMI).
We recruited 12 participants, 9 male and 3 female,
most of which were graduate students in our depart-ment. Their ages ranged between 24 and 30 years. None of the participants reported vision deficiencies or color blindness. Reimbursement was set at $10 with an additional $5 awarded to the user with the best ag-gregated accuracy over all tasks and conditions. The study lasted approximately one hour.
The study was designed to test the potential of gaze interactions to improve network tasks and to demon-strate the effectiveness of the gaze correction algo-rithm. For the first goal we tested two network tasks: determining the existence of direct connections (task 1) and finding shortest paths (task 2) between pairs of highlighted nodes, in the two conditions.
Instances of task 1 were limited at 3 seconds after which the screen faded out. Users would advance to the next question by pressing Y or N to answer the current question. We showed 175 instances of task 1, the same ones in both conditions. Uers were not al-lowed to use the mouse.
Instances of task 2 were limited at 35 seconds and generally involved paths of length three or four. To provide their answers, users had to click on the nodes forming the path. Within the last five seconds of the total 35, the screen faded slightly indicating to users that time draws to an end and they should provide the answer. We showed 20 such questions, the same ones in both conditions. In this task users were allowed to pan but not zoom.
Users performed both tasks in one condition before solving them again in the other condition. To reduce learning effects, half of the participants started the study in the eye-tracking condition while the other half started with the control condition. A three minute break was introduced between the two conditions.
In a second stage we tested the effectiveness of the gaze-correction algorithm. With eye-tracking support enabled, users were shown a view of the graph in which a quarter of the nodes ( 225) were un-selected (gray) while all others were selected (red). They were then asked to select as many unselected nodes as possible in a two minute period by looking at them. They were allowed two minutes with gaze correction active and two minutes with gaze correction inactive. These two conditions were again alternated to minimize learning effects. In this task users could pan but not zoom.
The actual study was preceded by a training ses-sion. First, subjects were familiarized with the con-cepts of node-link diagrams and the tasks they were going to complete. They were then shown the visual-ization, several instances of tasks, and were instructed on how to advance through the study. For the first two tasks they were shown correct answers. Users were also
Submission 235 / A Gaze-enabled Graph Visualization to improve graph reading tasks 7
explained and shown how the gaze-enabled visualiza-tion reacts to their view.
Finally, at the end of the study subjects completed a short questionnaire indicating their preference be-tween eye-tracking and conventional visualization, a 1−5 rating of the appeal and usefulness of eye-tracking, and a 1−5 indicator of whether the visual responses were obtrusive or not.
4.2. Results
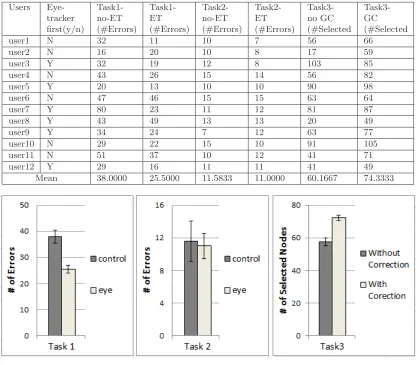
Table 1 and Figure 8 list and summarize the quan-titative results of our user study. We analyzed the data using a paired t-test and found statistically sig-nificant accuracy improvements in task 1 of approxi-mately 30% and in task 3 of approxiapproxi-mately 25%. No difference was found for task 2. The full results are listed below:
task 1: t(11) = 2.6719, p = 0.02172, mean-difference= 12.5, effect size (Cohen’s d) = 0.7713;
task 2:t(11) = 0.745,p= 0.4719, mean-difference= 0.5833, effect size (Cohen’s d) = 0.2151;
task 3: t(11) = 3.1017, p = 0.01007, mean-difference= 14.17, effect size (Cohen’s d) = 0.8954.
In terms of qualitative assessment, all users ex-pressed a preference for the eye-tracking enabled sys-tem, all of them rated it as helpful or very helpful, and most of them rated it as appealing or very appealing. These results are summarized in Figure 8. While not listed, none of the users found eye-tracking to be ob-trusive.
We believe several reasons contributed to the lack of meaningful results for task 2. First of all, the high error rate (more than 50%) indicates that the task was difficult to complete within the allotted time. This is likely to have introduced significant variability in the results and made them highly depend on chance. Second, while striving to minimize obtrusiveness we may have reduced the visual effect to the point that it was no longer helpful. Finally, the technique itself works better in some case than others. For example, in highly connected networks, entire regions light up around viewed nodes, thereby rendering any highlight-ing advantage void. Additional research is required to improve this type of interaction.
An important result is that gaze correction was shown to be working. However, the magnitude of the improvement is dependent on factors such as eye-tracking calibration, lighting, or user particularities. In ideal settings, when eye-tracking works well, the correction effect would be negligible, such as in the case of users 5 and 7. In poor conditions the effect can be significant. For example, just two users performed better on task 1 in the control condition, users 2 and 8.
Those users also happen to have two of the most sig-nificant improvements in task 3, suggesting that the eye-tracking was not functioning properly. Conversely, users that show only mild improvements in task 3 gen-erally showed significant improvements in task 1.
5. Discussion
Data visualization provides an ideal application area for eye-tracking enabled interactions because of the in-herent interplays between eyes and visualization and between people’s gazes and tasks they are perform-ing [YR67]. Current visualizations can be thought of as complete views that support many possible visual queries and tasks at the same time without specifically tending to any one of them. By interpreting users’ in-tentions from eye-tracking data, we can reduce per-ceptual overload and fit visualizations to user’s tasks and intentions, we reduce the overhead of manual in-teraction, and ultimately create visualization systems that participate proactively in the analytic process.
The results of our user study demonstrated the effectiveness of eye-tracking in supporting low level tasks but at the same time failed to reveal benefits in the more high-level task of path detection. We believe this was in part due to the design of our methods but also due to the difficulty of evaluating complex tasks quantitatively. However, given the reliability in detecting viewed nodes and edges, the strong effects in the short perceptual task, and the effectiveness of our gaze correction, we hypothesize that our methods can be used as a foundation for further exploration of high level interactive and analytic metaphors.
We also hypothesize that we can further improve on our detection of visual targets and user tasks. In sec-tions 3.1 and 3.2.2 we mentioned several assumpsec-tions about peoples gaze patterns: long fixations for nodes, shorter fixations for edge (section 3.1); longer fixations in regions of high density, shorter fixations in regions of low density (section 3.2.2). These assumptions were made from informal observations during design and do not rely on data or models of visual perception. While such gaze models exist for specific areas such as reading, they have not been generalized for visual objects and layouts specific to our field. A better un-derstanding of how visual parameters correlate to gaze measures such as fixation duration, saccade distance, or revisitation would enable us to detect viewed object in a more principled way.
In a complete analysis system additional infor-mation could be leveraged. For instance, since eye-movement and fixation precedes motor eye-movement and action [Duc07], mouse patterns can be used to con-firm and adjust data about fixations. Using our gaze-correction in an environment with multiple views, one
Table 1:Quantitative results.
Users Eye- Task1- Task1- Task2- Task2- Task3-
Task3-tracker no-ET ET no-ET ET no GC GC
first(y/n) (#Errors) (#Errors) (#Errors) (#Errors) (#Selected (#Selected
user1 N 32 11 10 7 56 66
user2 N 16 20 10 8 17 59
user3 Y 32 19 12 8 103 85
user4 N 43 26 15 14 56 82
user5 Y 20 13 10 10 90 98
user6 N 47 46 15 15 63 64
user7 Y 80 23 11 12 81 87
user8 Y 43 49 13 13 20 49
user9 Y 34 24 7 12 63 77
user10 N 29 22 15 10 91 105
user11 N 51 37 10 12 41 71
user12 Y 29 16 11 11 41 49
[image:9.612.90.511.444.600.2]Mean 38.0000 25.5000 11.5833 11.0000 60.1667 74.3333
Figure 7:Quantitative results.
Figure 8:Qualitative user feedback.
Submission 235 / A Gaze-enabled Graph Visualization to improve graph reading tasks 9
visualization could correct offsets for another visual-ization that may occupy the same screen space.
Modeling of higher level analytic tasks specific to data visualization would allow us to apply similar principles to detecting and supporting tasks that go beyond perception and data reading. Gaze-enabled in-teractions can be explored at multiple temporal scales. Our methods hint at this by describing a perceptual task that is supported within a fraction of a second, and a deliberative task supported by visual responses spanning multiple seconds. Interactions that rely on data captured and aggregated during an entire analy-sis session or even extended periods of time would be worth exploring.
Finally, our work doesn’t investigate the interplay between mouse interaction and gaze-interaction. A valid assumption is that users could outperform the eye-tracking enabled visualization in task 1 if allowed to select nodes and highlight their outgoing edges. In fact, one of the reasons for limiting task 1 to three seconds was our desire to capture the effect of eye-tracking on short, perceptual tasks for which the cost of interaction plays a significant overhead. We hy-pothesize that there is a class of interactive queries that would be cumbersome to specify manually and deliberately but would be easy to compute based on users’ unconscious gaze patterns. Task 2 tried to cap-ture such a query. Asking the user to provide and con-tinuously update information about nodes of interest would be unfeasible. Using eye-tracking, the same pro-cess can be done automatically and without missing any of the user’s visual interests.
6. Conclusion
In this paper we introduced techniques for using eye-tracking as an interactive input in the context of net-work visualization, and demonstrated their effective-ness in a controlled user study. Specifically, we dim out edges with endpoints outside of the users view fo-cus, we highlight edges that are visually traced, and increase the saliency of sub-networks around nodes viewed often. We also describe an algorithm that im-proves eye-tracking accuracy by leveraging the known layout of the network. In a user study with twelve participants we showed that these techniques allow users to more accurately determine if two nodes are connected. At the same time we demonstrated the ef-fectiveness of the gaze correction technique quantita-tively. Given the reliability in detecting viewed nodes and edges, the strong effects in the connectivity task, and the success of the gaze correction technique, and the inherent role that eyes are playing in data vi-sualization, we hypothesize that further exploration
of gaze-enabled interactions for visualization will be valuable.
References
[ADS05] Ashmore M., Duchowski A. T., Shoemaker G.: Efficient eye pointing with a fisheye lens. In Pro-ceedings of Graphics interface 2005 (2005), Canadian Human-Computer Communications Society, pp. 203– 210. 2
[BMBL09] Borgatti S. P., Mehra A., Brass D. J., Labianca G.: Network analysis in the social sciences.
science 323, 5916 (2009), 892–895. 1
[BS09] Bullmore E., Sporns O.: Complex brain net-works: graph theoretical analysis of structural and func-tional systems. Nature Reviews Neuroscience 10, 3 (2009), 186–198. 1
[CCNS08] Chin G., Chavarria D., Nakamura G., Sofia H.: Biographe: high-performance bionetwork analysis using the biological graph environment. BMC bioinformatics 9, Suppl 6 (2008), S6. 1
[CGM04] Coffman T., Greenblatt S., Marcus S.: Graph-based technologies for intelligence analysis. Com-munications of the ACM 47, 3 (2004), 45–47.1
[DC¸ 07] Duchowski A. T., C¸ ¨oltekin A.: Foveated gaze-contingent displays for peripheral lod management, 3d visualization, and stereo imaging.ACM Transactions on Multimedia Computing, Communications, and Applica-tions (TOMCCAP) 3, 4 (2007), 6. 2
[DDLS07] Drewes H., De Luca A., Schmidt A.: Eye-gaze interaction for mobile phones. InProceedings of the 4th international conference on mobile technology, ap-plications, and systems and the 1st international sym-posium on Computer human interaction in mobile tech-nology (2007), ACM, pp. 364–371.3
[DS07] Drewes H., Schmidt A.: Interacting with the computer using gaze gestures. In Human-Computer Interaction–INTERACT 2007. Springer, 2007, pp. 475– 488. 3
[Duc02] Duchowski A. T.: A breadth-first survey of eye-tracking applications. Behavior Research Methods, In-struments, & Computers 34, 4 (2002), 455–470. 1
[Duc07] Duchowski A. T.: Eye tracking methodology: Theory and practice, vol. 373. Springer, 2007. 2,7
[GN00] Gansner E. R., North S. C.: An open graph vi-sualization system and its applications to software engi-neering.Software Practice and Experience 30, 11 (2000), 1203–1233. 1
[HDO03] HOWLETT S., DINGLIANA J. L., O’SULLIVAN C. A.: Eye movements and inter-active graphics. 2
[HEH08] Huang W., Eades P., Hong S.-H.: Beyond time and error: a cognitive approach to the evaluation of graph drawings. InProceedings of the 2008 Workshop on BEyond time and errors: novel evaLuation methods for Information Visualization (2008), ACM, p. 3. 2
[HMR05] Hyrskykari A., Majaranta P., R¨aih¨a K.-J.: From gaze control to attentive interfaces. InProceedings of HCII (2005). 2
[Jac90] Jacob R. J.: What you look at is what you get:
eye movement-based interaction techniques. In Proceed-ings of the SIGCHI conference on Human factors in computing systems(1990), ACM, pp. 11–18. 2
[Jac91] Jacob R. J.: The use of eye movements in human-computer interaction techniques: what you look at is what you get. ACM Transactions on Information Systems (TOIS) 9, 2 (1991), 152–169. 2
[JK03] Jacob R. J., Karn K. S.: Eye tracking in human-computer interaction and usability research: Ready to deliver the promises. Mind 2, 3 (2003), 4. 2
[KPW07] Kumar M., Paepcke A., Winograd T.: Eye-point: practical pointing and selection using gaze and keyboard. In Proceedings of the SIGCHI conference on Human factors in computing systems(2007), ACM, pp. 421–430.2
[KT06] Kurant M., Thiran P.: Extraction and analy-sis of traffic and topologies of transportation networks.
Physical Review E 74, 3 (2006), 036114. 1
[LBP06] Li D., Babcock J., Parkhurst D. J.: openeyes: a low-cost head-mounted eye-tracking solu-tion. In Proceedings of the 2006 symposium on Eye tracking research & applications (2006), ACM, pp. 95– 100.2
[MMC∗00] Maglio P. P., Matlock T., Campbell C. S., Zhai S., Smith B. A.: Gaze and speech in at-tentive user interfaces. InAdvances in Multimodal In-terfacesICMI 2000. Springer, 2000, pp. 1–7.2
[MZ08] MacKenzie I. S., Zhang X.: Eye typing using word and letter prediction and a fixation algorithm. In
Proceedings of the 2008 symposium on Eye tracking re-search & applications(2008), ACM, pp. 55–58. 3
[OHM∗04] OSullivan C., Howlett S., Morvan Y., McDonnell R., O’Conor K.: Perceptually adaptive graphics.Eurographics state of the art reports 4(2004).
2
[Ovi03] Oviatt S.: Multimodal interfaces. The human-computer interaction handbook: Fundamentals, evolving technologies and emerging applications(2003), 286–304.
1
[PSD09] Pohl M., Schmitt M., Diehl S.: Compar-ing the readability of graph layouts usCompar-ing eyetrackCompar-ing and task-oriented analysis. InProceedings of the Fifth Eurographics conference on Computational Aesthetics in Graphics, Visualization and Imaging (2009), Euro-graphics Association, pp. 49–56.2
[RHN∗03] Ruddarraju R., Haro A., Nagel K., Tran Q. T., Essa I. A., Abowd G., Mynatt E. D.: Percep-tual user interfaces using vision-based eye tracking. In
Proceedings of the 5th international conference on Mul-timodal interfaces(2003), ACM, pp. 227–233.2
[SA00] Salvucci D. D., Anderson J. R.: Intelligent gaze-added interfaces. In Proceedings of the SIGCHI conference on Human factors in computing systems
(2000), ACM, pp. 273–280.3
[Sal99] Salvucci D. D.: Inferring intent in eye-based in-terfaces: tracing eye movements with process models. In
Proceedings of the SIGCHI conference on Human Fac-tors in Computing Systems (1999), ACM, pp. 254–261.
3
[Sel04] Selker T.: Visual attentive interfaces.BT Tech-nology Journal 22, 4 (2004), 146–150. 1
[TJ00] Tanriverdi V., Jacob R. J.: Interacting with eye movements in virtual environments. In Proceedings of the SIGCHI conference on Human factors in computing systems(2000), ACM, pp. 265–272. 2
[Ver02] Vertegaal R.: Designing attentive interfaces. InProceedings of the 2002 symposium on Eye tracking research & applications (2002), ACM, pp. 23–30.2
[VS08] Vertegaal R., Shell J. S.: Attentive user in-terfaces: the surveillance and sousveillance of gaze-aware objects. Social Science Information 47, 3 (2008), 275– 298. 2
[VSCM06] Vertegaal R., Shell J. S., Chen D., Ma-muji A.: Designing for augmented attention: Towards a framework for attentive user interfaces. Computers in Human Behavior 22, 4 (2006), 771–789. 2
[WM87] Ware C., Mikaelian H. H.: An evaluation of an eye tracker as a device for computer input2. InACM SIGCHI Bulletin(1987), vol. 17, ACM, pp. 183–188. 2
[YR67] Yarbus A. L., Riggs L. A.:Eye movements and vision, vol. 2. Plenum press New York, 1967. 2,7
[ZMI99] Zhai S., Morimoto C., Ihde S.: Manual and gaze input cascaded (magic) pointing. InProceedings of the SIGCHI conference on Human factors in computing systems(1999), ACM, pp. 246–253. 1,2