Static & Dynamic Reverse Engineering Techniques for Java Software Sytems pdf
232
0
0
Full text
(2) TARJA SYSTÄ. Static and Dynamic Reverse Engineering Techniques for Java Software Systems. U n i v e r s i t y o f Ta m p e r e Ta m p e r e 2 0 0 0.
(3) ACADEMIC DISSERTATION University of Tampere, Department of Computer and Information Sciences Finland. Acta Electronica Universitatis Tamperensis 30 ISBN 951-44-4811-1 ISSN 1456-954X http://acta.uta.fi.
(4) TARJA SYSTÄ. Static and Dynamic Reverse Engineering Techniques for Java Software Systems. ACADEMIC DISSERTATION To be presented, with the permission of the Faculty of Economics and Administration of the University of Tampere, for public discussion in the Paavo Koli Auditorium of the University, Kehruukoulunkatu 1, Tampere, on May 8th, 2000 at 12 o’clock.. U n i v e r s i t y o f Ta m p e r e Ta m p e r e 2 0 0 0.
(5) Acknowledgements. I am very grateful to my supervisor Kai Koskimies for all his support. Over the years, Kai has encouraged me through my Licentiate and PhD studies. He has given me a lot of feedback and many useful pieces of advice, every time I needed them. I would also like to thank Erkki Mäkinen for proofreading my papers, encouraging and guiding me in my studies, and being always able to find answers for all kinds of questions. Kai hired me in 1993 as a researcher for the SCED research project for almost three years. It was a pleasure and privilege to work with Jyrki Tuomi and Tatu Männistö on SCED. The SCED project was financially supported by the Center for Technological Development in Finland (TEKES), Nokia Research Center, Valmet Automation, Stonesoft, Kone, and Prosa Software.. After the SCED project, my PhD studies have been financially supported by Tampere Graduate School in Information Science and Engineering (TISE). The funding I received from TISE allowed me to fully concentrate on my PhD studies and to visit the University of Victoria, Canada, during years 1997-1998. The visit was partly funded by the Academy of Finland. I am grateful to Hausi Müller for welcoming me to the Rigi research project at UVic. He gave me a good opportunity to continue my studies, and made it easy and pleasant for me to work and collaborate with the Rigi members. I enjoyed those one and half years I was able to spend in Victoria.. I would like to express my gratitude to the reviewers of the dissertation, Hausi Müller and Jukka Paakki. Their feedback was useful for improving the work. I would also like to thank Gail Murphy for many useful comments.. I have been working in the Department of Computer Science, University of Tampere, over six years. Thanks to the supportive staff members of the department, working during those years has been so much fun. Special thanks to Teppo Kuusisto, Tuula Moisio, and Marja Liisa Nurmi for all their help..
(6) Contents 1. Introduction. 1. 2. Reverse engineering. 5. 2.1. Extracting and viewing information . . . . . . . . . . . . . . . . . . . . . . . .. 6. 2.1.1. A single view . . . . . . . . . . . . . . . . . . . . . . . . . . . . . . . .. 7. 2.1.2. A set of different views . . . . . . . . . . . . . . . . . . . . . . . . . . .. 9. Reverse engineering approaches and tools . . . . . . . . . . . . . . . . . . . . .. 12. 2.2.1. Understanding the software through high-level models . . . . . . . . . .. 13. 2.2.2. Software metrics . . . . . . . . . . . . . . . . . . . . . . . . . . . . . .. 17. 2.2.3. Supporting re-engineering and round-trip-engineering . . . . . . . . . .. 19. 2.2.4. Other tools facilitating reverse engineering . . . . . . . . . . . . . . . .. 21. 2.2.5. Summary . . . . . . . . . . . . . . . . . . . . . . . . . . . . . . . . . .. 22. 2.2. 3. 4. Modeling with UML. 23. 3.1. Class diagrams . . . . . . . . . . . . . . . . . . . . . . . . . . . . . . . . . . .. 25. 3.2. Sequence diagrams . . . . . . . . . . . . . . . . . . . . . . . . . . . . . . . . .. 27. 3.3. Collaboration diagrams . . . . . . . . . . . . . . . . . . . . . . . . . . . . . . .. 27. 3.4. Statechart diagrams . . . . . . . . . . . . . . . . . . . . . . . . . . . . . . . . .. 29. 3.5. Activity diagrams . . . . . . . . . . . . . . . . . . . . . . . . . . . . . . . . . .. 35. SCED. 37. 4.1. Dynamic modeling using SCED . . . . . . . . . . . . . . . . . . . . . . . . . .. 39. 4.1.1. 39. Scenario diagrams . . . . . . . . . . . . . . . . . . . . . . . . . . . . .. ii.
(7) 4.1.2. 5. 6. 7. State diagrams . . . . . . . . . . . . . . . . . . . . . . . . . . . . . . .. 45. 4.2. Examining the models . . . . . . . . . . . . . . . . . . . . . . . . . . . . . . .. 49. 4.3. Summary . . . . . . . . . . . . . . . . . . . . . . . . . . . . . . . . . . . . . .. 50. Automated synthesis of state diagrams. 52. 5.1. The BK-algorithm . . . . . . . . . . . . . . . . . . . . . . . . . . . . . . . . . .. 53. 5.2. Applying the BK-algorithm to state diagram synthesis . . . . . . . . . . . . . . .. 57. 5.3. Problems in the synthesis of state diagrams . . . . . . . . . . . . . . . . . . . .. 72. 5.4. The speed of the synthesis algorithm . . . . . . . . . . . . . . . . . . . . . . . .. 76. 5.5. Limitations . . . . . . . . . . . . . . . . . . . . . . . . . . . . . . . . . . . . .. 77. 5.6. Related research . . . . . . . . . . . . . . . . . . . . . . . . . . . . . . . . . . .. 79. 5.7. Summary . . . . . . . . . . . . . . . . . . . . . . . . . . . . . . . . . . . . . .. 82. Optimizing synthesized state diagrams using UML notation. 83. 6.1. Definitions and rules . . . . . . . . . . . . . . . . . . . . . . . . . . . . . . . .. 84. 6.2. Packing actions . . . . . . . . . . . . . . . . . . . . . . . . . . . . . . . . . . .. 90. 6.3. Transformation patterns . . . . . . . . . . . . . . . . . . . . . . . . . . . . . . .. 91. 6.4. Internal actions . . . . . . . . . . . . . . . . . . . . . . . . . . . . . . . . . . .. 96. 6.5. Entry actions . . . . . . . . . . . . . . . . . . . . . . . . . . . . . . . . . . . .. 98. 6.6. Exit actions . . . . . . . . . . . . . . . . . . . . . . . . . . . . . . . . . . . . .. 101. 6.7. Action expressions of transitions . . . . . . . . . . . . . . . . . . . . . . . . . .. 105. 6.8. Removing UML notation concepts from state diagrams . . . . . . . . . . . . . .. 106. Rigi. 110. 7.1. Methodology . . . . . . . . . . . . . . . . . . . . . . . . . . . . . . . . . . . .. 110. 7.2. Rigi views . . . . . . . . . . . . . . . . . . . . . . . . . . . . . . . . . . . . . .. 112. 7.3. Scripting . . . . . . . . . . . . . . . . . . . . . . . . . . . . . . . . . . . . . . .. 115. 7.4. Reverse engineering object-oriented software using Rigi . . . . . . . . . . . . .. 116. 7.5. Summary . . . . . . . . . . . . . . . . . . . . . . . . . . . . . . . . . . . . . .. 118.
(8) 8. 9. Applying Shimba for reverse engineering Java software. 120. 8.1. Overview of the implementation . . . . . . . . . . . . . . . . . . . . . . . . . .. 120. 8.2. Constructing a static dependency graph . . . . . . . . . . . . . . . . . . . . . .. 121. 8.3. Software metrics used in Shimba . . . . . . . . . . . . . . . . . . . . . . . . . .. 124. 8.4. Collecting dynamic information . . . . . . . . . . . . . . . . . . . . . . . . . .. 126. 8.4.1. The event trace . . . . . . . . . . . . . . . . . . . . . . . . . . . . . . .. 126. 8.4.2. The control flow . . . . . . . . . . . . . . . . . . . . . . . . . . . . . .. 127. 8.5. Managing the explosion of the event trace . . . . . . . . . . . . . . . . . . . . .. 140. 8.6. Merging dynamic information into a static view . . . . . . . . . . . . . . . . . .. 143. 8.7. Using static information to guide the generation of dynamic information . . . . .. 143. 8.8. Slicing a Rigi view using SCED scenarios . . . . . . . . . . . . . . . . . . . . .. 145. 8.9. Raising the level of abstraction of SCED scenarios using a high-level Rigi graph .. 147. 8.10 Related work . . . . . . . . . . . . . . . . . . . . . . . . . . . . . . . . . . . .. 150. 8.10.1 Dynamic reverse engineering tools . . . . . . . . . . . . . . . . . . . . .. 150. 8.10.2 Tools that combine static and dynamic information . . . . . . . . . . . .. 153. 8.11 Summary . . . . . . . . . . . . . . . . . . . . . . . . . . . . . . . . . . . . . .. 155. A case study: reverse engineering FUJABA software. 158. 9.1. Tasks . . . . . . . . . . . . . . . . . . . . . . . . . . . . . . . . . . . . . . . .. 158. 9.2. The target Java software: FUJABA . . . . . . . . . . . . . . . . . . . . . . . . .. 160. 9.3. Dynamic modeling . . . . . . . . . . . . . . . . . . . . . . . . . . . . . . . . .. 161. 9.3.1. Modeling the internal behavior of a method . . . . . . . . . . . . . . . .. 161. 9.3.2. Modeling the usage of a dialog . . . . . . . . . . . . . . . . . . . . . . .. 168. 9.3.3. Structuring scenarios with behavioral patterns . . . . . . . . . . . . . . .. 171. 9.3.4. Modeling the behavior of a thread object . . . . . . . . . . . . . . . . .. 176. 9.3.5. Tracking down a bug . . . . . . . . . . . . . . . . . . . . . . . . . . . .. 178. Relationships between static and dynamic models . . . . . . . . . . . . . . . . .. 181. 9.4.1. Merging dynamic information into a static view . . . . . . . . . . . . . .. 182. 9.4.2. Slicing a Rigi view using SCED scenarios . . . . . . . . . . . . . . . . .. 182. 9.4.
(9) 9.4.3. 9.5. Raising the level of abstraction of SCED scenario diagrams using a highlevel Rigi graph . . . . . . . . . . . . . . . . . . . . . . . . . . . . . . .. 184. Discussion . . . . . . . . . . . . . . . . . . . . . . . . . . . . . . . . . . . . . .. 188. 9.5.1. Results of the case study . . . . . . . . . . . . . . . . . . . . . . . . . .. 189. 9.5.2. Limitations of Shimba . . . . . . . . . . . . . . . . . . . . . . . . . . .. 190. 9.5.3. Experiences with Shimba . . . . . . . . . . . . . . . . . . . . . . . . . .. 191. 10 Conclusions. 194. 10.1 Discussion . . . . . . . . . . . . . . . . . . . . . . . . . . . . . . . . . . . . . .. 194. 10.1.1 Modeling the target software . . . . . . . . . . . . . . . . . . . . . . . .. 194. 10.1.2 Applying reverse engineering approaches to forward engineering . . . . .. 196. 10.1.3 Support for iterative dynamic modeling . . . . . . . . . . . . . . . . . .. 198. 10.2 Summary of contributions . . . . . . . . . . . . . . . . . . . . . . . . . . . . .. 199. 10.3 Directions for future work . . . . . . . . . . . . . . . . . . . . . . . . . . . . .. 202. 10.4 Concluding remarks . . . . . . . . . . . . . . . . . . . . . . . . . . . . . . . . .. 203. Bibliography. 204. Appendices. 212. A Rigi domain model for Java: Riginode file. 212. B Rigi domain model for Java: Rigiarc file. 214. C Rigi domain model for Java: Rigiattr file. 217. D Calculating software metrics in Shimba. 222. v.
(10) Chapter 1. Introduction The need for maintaining, reusing, and re-engineering existing software systems has increased dramatically over the past few years. Changed requirements or the need for software migration, for example, necessitate renovations for business-critical software systems. Reusing and modifying legacy systems are complex and expensive tasks because of the time-consuming process of program comprehension. Thus, the need for software engineering methods and tools that facilitate program understanding is compelling. A variety of reverse engineering tools provide means to support this task. Reverse engineering aims at analyzing the software and representing it in an abstract form so that it is easier to understand, e.g., for software maintenance, re-engineering, reuse, and documenting purposes.. To understand existing software systems, both static and dynamic information are useful. Static information describes the structure of the software as it is written in the source code, while dynamic information describes the run-time behavior. Both static and dynamic analysis result in information about the software artifacts and their relations. The dynamic analysis also produces sequential event trace information, information about concurrent behavior, code coverage, memory management, etc.. Program understanding can be supported by producing design models from the target software. This reverse engineering approach is also useful when constructing software from high-level de-. 1.
(11) Chapter 1. Introduction sign information, i.e., during forward engineering. The extracted static models can be used, for instance, to ensure that the architectural guidelines are followed and to get an overall picture of the current stage of the software. The dynamic models, in turn, can be used to support tasks such as debugging, finding dead code, and understanding the current behavior of the software.. The rise of new programming languages and paradigms drives changes in current reverse engineering tools and methods. Today’s legacy systems are written in COBOL or C, while tomorrow’s legacy systems are written in C++, Smalltalk, or Java. The adaption of the object-oriented programming paradigm has changed programming styles dramatically. Extracting information about the dynamic behavior of the software is especially important when examining object-oriented software. This is due to the dynamic nature of object-oriented programs: object creation, object deletion/garbage collection, and dynamic binding make it very difficult, and most times impossible, to understand the behavior by just examining the source code.. One of the most challenging tasks in reverse engineering is to build descriptive and readable views of the software on the right level of abstraction. One approach is to merge the extracted information into a single view and to support information filtering and hiding techniques and means to build abstractions in order to keep the view readable and understandable. However, when both static and dynamic information are considered, the chosen view often serves either the static or the dynamic aspect but rarely both. In practice, the dynamic information is just viewed against a formerly built static model. It is easy to add, e.g., information about code coverage to a static view but it is much more difficult to add information about concurrent or sequential behavior to that view. In addition, if a lot of information is attached to a single view it easily loses its readability.. Another approach to view the information extracted is to use different views and models for different purposes. For example, traditional message sequence charts (MSCs) [49] can be used to capture the interaction in a sample case, state diagrams to view the total behavior of the software, and static models to view the static software artifacts and their dependencies. Since static and dynamic models are distinguished in forward engineering, it is natural to do so also in reverse en-. 2.
(12) Chapter 1. Introduction gineering. As in forward engineering, having separate views requires that there is a meaningful and consistent connection among these views. If such connections exist, the views can be used to comprehend each other, providing extended ways to support information exchange, slicing the views, and building abstractions. Furthermore, if the reverse engineering tool used is able to produce similar diagrams and models that have been used in the design phase of the software construction process, then an iterative software development approach that combines forward and reverse engineering techniques can be supported. Such software development is called round-trip-engineering.. SCED [56] is a prototype tool that has been built to support the dynamic modeling of objectoriented applications. It was originally designed to be used in analysis and design phases of the development process of object-oriented software. In this research, SCED is used to model the results of reverse engineering the run-time behavior of Java applications and applets. The main user interaction in SCED involves two independent editors: a scenario diagram editor and a state diagram editor. A scenario diagram in SCED is a variation of an MSC that semantically corresponds to a sequence diagram in Unified Modeling Language (UML) [95, 85]. A SCED state diagram notation can be characterized as a simplified UML statechart diagram notation. In SCED, state diagrams can be synthesized automatically from a set of scenario diagrams. The basic synthesis algorithm used was originally presented by Biermann and Krishnaswamy [7], and its adoption to state machine synthesis from scenarios is discussed by Koskimies and Mäkinen [54]. This algorithm with a few modifications has been implemented in SCED [56]. At any time during scenario editing the user can select one participating object and synthesize a state diagram automatically for it by using a single menu command. The state diagram can be synthesized from one scenario only or from a specified set of scenarios. Since the synthesis algorithm is incremental, scenarios can be synthesized to an existing state diagram. The synthesis algorithm is discussed in Chapter 5.. Several tools have been developed to visualize run-time behavior of object-oriented software systems [51, 59, 61, 99, 120]. Event traces are typically shown in a form of MSCs. In this research, the visualization of the run-time behavior has been taken one step further: not only SCED scenario diagrams but also the final specification of the dynamic behavior, i.e. the state diagram, is. 3.
(13) Chapter 1. Introduction composed automatically as a result of the execution of a target system. This step is made possible by using the state diagram synthesis feature of SCED. Generated state diagrams allow the user to examine the dynamic behavior from a different angle compared to scenario diagrams. While scenario diagrams show the interaction among several objects, a state diagram shows the total behavior of a certain object or a method, disconnected from the rest of the system.. This dissertation shows that integration of dynamic and static information aids the performance of reverse engineering tasks. An experimental environment called Shimba has been built to support reverse engineering of Java software systems. The static information is extracted from Java byte code [118]. It can be viewed and analyzed with the Rigi reverse engineering tool [74]. The dynamic event trace information is generated automatically as a result of running the target system under a customized Java Development Kit (JDK) debugger. Information about the dynamic control flow of selected objects or methods can also be extracted. The event trace can then be viewed and analyzed with the SCED tool. To support model comprehension, the models built can be used to modify and improve each other by means of information exchange, model slicing, and building abstractions.. This dissertation is structured as follows. Reverse engineering approaches and tools are discussed in Chapter 2. Behavioral modeling with UML is briefly discussed in Chapter 3. Chapter 4 gives an overview of the SCED tool and describes its diagrams used for dynamic modeling, comparing them to the ones used in UML. In Chapter 5, the state diagram algorithms presented by Koskimies and Mäkinen are introduced with few modifications caused by the extended scenario notation of SCED. The synthesized state diagram can be simplified by adding UML statechart diagram concepts into it. The simplifying methods are introduced in Chapter 6. The Rigi tool and its reverse engineering methodology are briefly discussed in Chapter 7. The reverse engineering approach and features of Shimba are described in Chapter 8. To validate the usability of the approach, explained in Chapter 8, a target Java software system is examined. The results and examples of this case study are presented in Chapter 9. This research is related to other work in Chapter 8.10. Finally, Chapter 10 discusses the research, highlights the contributions, and addresses some future plans.. 4.
(14) Chapter 2. Reverse engineering Chikofsky and Cross [18] define reverse engineering as a process of analyzing a subject system with two goals in mind:. (1) to identify the system’s components and their interrelationships and (2) to create representations of the system in another form or at a higher level of abstraction.. Reverse engineering aims to support program comprehension. Reverse engineering approaches can thus facilitate, for example, maintenance, reuse, documentation, re-engineering, and forward engineering of the target software. Program comprehension can be supported by producing design models from existing software. In this dissertation, modeling the static structure of the target software is called static reverse engineering, and modeling its dynamic behavior is called dynamic reverse engineering.. Reverse engineering is difficult for various reasons. First, the target software can be, and often is, poorly documented. In addition, the documentation is seldom up to date. Second, persons who designed and implemented the software cannot always be reached for consultation. Such difficulties often mean that the only reliable source of information is the source code. Third, there is a gap between the top-down process often used in a forward engineering process and the bottom-up analysis of the source code typically used in static reverse engineering. Deriving similar models. 5.
(15) 2.1. EXTRACTING AND VIEWING INFORMATION. from source code as were used in the design phase of the forward engineering process is difficult and in many cases impossible. For example, a Java software system can be designed using UML. Code generators can even be used to construct skeletons of classes automatically. However, there is no one-to-one correspondence between UML modeling concepts and Java software artifacts. For instance, aggregation and composition do not have direct counterparts in Java and, vice versa, method bodies cannot be expressed in UML. Fourth, the functionality and purpose of some structures used in the source code might be difficult to understand. Such structures can be technical and/or language dependent solutions to implementation problems. Fifth, the source code includes both domain dependent and domain independent code. The former is especially problematic, forcing the engineer to become familiar with the domain as well. Sixth, combining results of dynamic reverse engineering and static reverse engineering is difficult, especially for examining object-oriented software systems. Object-oriented programs are inherently dynamic: object creation, object deletion/garbage collection, and dynamic binding cause behavior that is difficult, and often impossible, to understand by just examining the source code. Thus, dynamic reverse engineering is especially important for understanding object-oriented software systems. For the reasons above, automating the tedious task of reverse engineering is especially difficult.. Chikofsky and Cross [18] further characterize design recovery as a subset of reverse engineering in which domain knowledge, external information, and deduction or fuzzy reasoning are added to the observations of the subject system. The objective of design recovery is to identify meaningful higher-level abstractions beyond those obtained directly by examining the system itself.. 2.1 Extracting and viewing information All reverse engineering environments need tools for extracting the information to be analyzed. Static information includes software artifacts and their relations. In Java, for example, such artifacts could be classes, interfaces, methods, and variables. The relations might include extension relationships between classes or interfaces, calls between methods, and so on. The static reverse engineering process may also include syntax and type checking, and control and data flow analy6.
(16) 2.1. EXTRACTING AND VIEWING INFORMATION. sis [2]. Dynamic information contains software artifacts as well. In addition, it contains sequential event trace information, information about concurrent behavior, memory management, code coverage, etc. Static information can be extracted, e.g., by using parsers based on grammars. For extracting dynamic information, debuggers, profilers, or event recorders can be used. In addition, source code instrumentation is an often used approach. Furthermore, when analyzing languages like Java or Smalltalk, the instructions of the virtual machine (VM) can be instrumented instead.. The extracted information is not useful unless it can be shown in a readable and descriptive way. Supporting program comprehension by building (graphical) design models from existing software is supported in many reverse engineering and design recovery tools and environments. There are basically three kinds of views that can be used to illustrate the extracted information: static views, dynamic views, and merged views. Static views contain only static information, dynamic views contain only dynamic information, and merged views are used to show both static and dynamic information in a single view. Figure 2.1 shows different choices of building views to the target software.. 2.1.1. A single view. Merging dynamic and static information into a single view has both advantages and disadvantages. A single view would directly illustrate connections between static and dynamic information. In addition, the quality of the view can be improved and ensured when merging static and dynamic information. For example, because of polymorphism, a static analysis is not enough to conclude the exact method calls; a method call written in the source code represents a set of possible operations, rather than a certain single operation that is invoked at run-time. Dynamic analysis is needed to determine the actual method calls.. Building abstractions for merged views can be difficult because static and dynamic abstractions usually differ considerably. While static abstractions are subsystems, dynamic abstractions are typically use cases or behavioral patterns (i.e., repeated similar behavior). The user therefore has. 7.
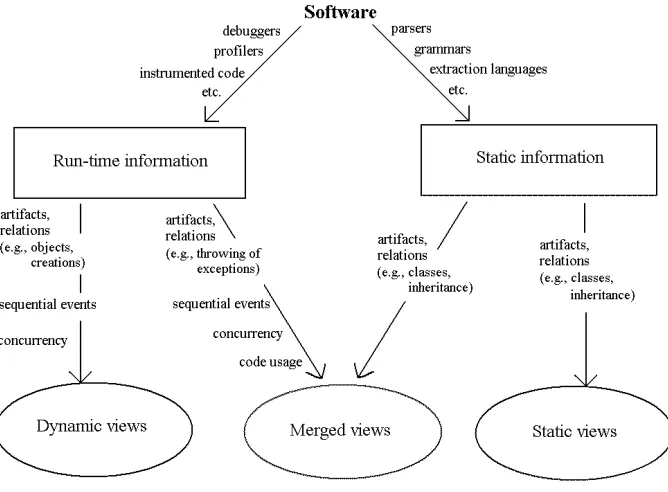
(17) 2.1. EXTRACTING AND VIEWING INFORMATION. Figure 2.1: Different choices of constructing views to the target software. to choose at an early stage whether to build the abstractions from a static or dynamic point of view. For example, consider a banking system that consists of banks, consortiums of banks, and ATMs. An ATM can be used, e.g., for withdrawing cash or for paying bills. From a static point of view, an ATM, a consortium, and a bank themselves represent subsystems. From a dynamic point of view, in turn, “withdrawing money using an ATM” and “paying a bill using an ATM” are two different use cases, both representing communication among ATM, consortium, and bank subsystems.. Forming merged views themselves might be complicated. For example, it is easy to add code coverage information that shows the actual run-time usage of the software artifacts to a static view but it is much more difficult to add information about concurrent or sequential behavior to it. In UML, collaboration diagrams can be used to view both dynamic event trace information and static aspects of the software. However, even moderate size collaboration diagrams easily become hard to read and in reverse engineering the amount of extracted information is typically very large. In general, the more information attached to a single view, the less readable it becomes, thus losing one of its main purposes. To focus on desired aspects of the software, uninteresting information. 8.
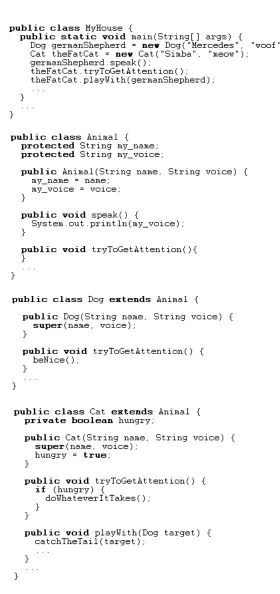
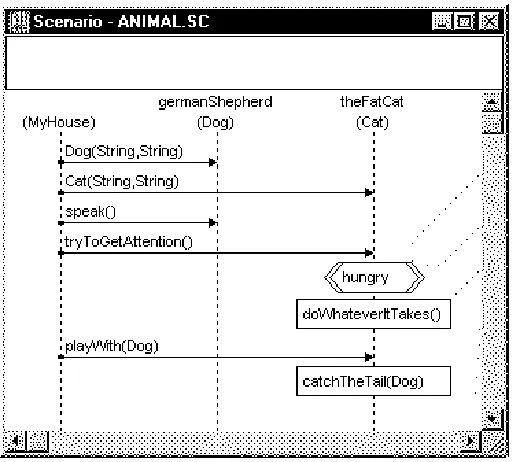
(18) 2.1. EXTRACTING AND VIEWING INFORMATION. can be filtered out or hidden. On the other hand, if such techniques provides the only means to focus on the chosen aspect of the software, e.g., sequential event trace information, then merging that information into the view is questionable. Unless the merge serves another purpose, choosing a more suitable and descriptive view would probably promote the reverse engineering task better.. 2.1.2. A set of different views. Figure 2.2 shows the source code of an example Java program. When reverse engineering the example program, the static information could be shown as a class diagram as depicted in Figure 2.3. The class diagram shows the static model elements of the subject program, as well as their contents and relationships. The dynamic behavior could be visualized as a scenario diagram, which describes the object interactions. Time (or execution) in the scenario diagram flows from top to bottom. Figure 2.4 shows a SCED scenario diagram that could characterize the dynamic behavior of the example Java program. In forward engineering different diagrams are used to model the static structure and dynamic behavior of the software system. For instance, in UML there are static diagrams, dynamic diagrams, and diagrams that model both the static and dynamic aspects of the software. From a large set of diagrams, the user chooses the ones that best suit her purposes. Ideally, this should also be the case in reverse engineering. If a large set of diagrams is chosen, the problem of keeping them consistent and connected to each other needs to be considered. On the other hand, a single diagram is often insufficient to model the software and the problems explained in the previous section occur. The number and type of diagrams to be used depend on the purpose and needs in the same way as in forward engineering.. Separating static and dynamic views allows showing information that would be hard, or even impossible, to include in a single merged view. This, in turn, offers better possibilities to support slicing, requiring that there is a connection that enables information exchange between the views. For example, if scenario diagrams are used for viewing the event trace information, the static model can be sliced based on the information included in a desired set of scenarios (i.e., only a desired part of the static model is shown). The resulting slice shows the structure of a particular. 9.
(19) 2.1. EXTRACTING AND VIEWING INFORMATION. Figure 2.2: The source code of an example Java program. 10.
(20) 2.1. EXTRACTING AND VIEWING INFORMATION. Figure 2.3: The static structure of the program in Figure 2.2 is shown as a class diagram.. Figure 2.4: The program in Figure 2.2 has to be executed to capture its dynamic behavior. A scenario diagram can be used to visualize the execution.. 11.
(21) 2.2. REVERSE ENGINEERING APPROACHES AND TOOLS. part of the software that causes that behavior. Furthermore, the static knowledge of the software can be used to guide the generation of dynamic information, i.e., to focus on the behavior of the desired parts of the software.. Using a set of different views makes it possible to build abstractions for dynamic views according to different principles than for static ones. For example, behavioral patterns can be used to raise the level of abstraction of scenario diagrams, while structural dependencies can be used as a criterion when building abstractions to static views. Forcing the dynamic information to be abstracted based on static criteria would probably hide some essential features in the behavior and make it more complicated to understand the overall behavior. However, in some cases it might be meaningful, e.g., to modify scenario diagrams to show interaction among high level static components instead of showing the interaction between classes or even objects.. 2.2 Reverse engineering approaches and tools A wide range of reverse engineering and design recovery tools have been developed for both industrial use and academic research. Most of them provide better support for static reverse engineering than for dynamic reverse engineering. Some of the tools focus on understanding the software by building high-level models of the structure and/or the behavior of the software, some tools can be used to analyze the software based on software metrics and other measurements, and some tools support re-engineering and round-trip-engineering by providing facilities for both forward and reverse engineering of the software. There are also tool sets that support all these approaches.. In what follows, we briefly describe different reverse engineering and design recovery approaches and give examples of tools and tool sets that support these approaches.. 12.
(22) 2.2. REVERSE ENGINEERING APPROACHES AND TOOLS. 2.2.1. Understanding the software through high-level models. Tools that extract static and dynamic information from the target software typically produce a lot of detailed information. Hence, good views for showing that information is not usually enough, but abstractions need to be built for making the views clearer and more understandable. In static reverse engineering, abstract high-level components to be found and constructed might represent subsystems or other logically connected software artifacts. In dynamic reverse engineering, abstractions are typically behavioral patterns, use cases, or views that show interaction among highlevel static components.. Constructing abstract and descriptive high-level views of the target software is the most challenging phase in the reverse engineering process described in Figure 2.1. Gathering information and building the initial views are not straightforward either: an empirical study by Murphy et al. compares nine static call graph extractors and shows considerable differences among the results obtained from three C software systems [72]. The main reason for this was that the requirements for tools computing call graphs are typically more relaxed than those for compilers. In general, the information can be extracted and initial views of the software can be constructed automatically. However, manual processing is needed in most cases for building high-level views from the detailed low-level views. In static reverse engineering, language structures and metrics can be used to partly automate the process. There are slightly more efficient ways to automate the construction of abstract dynamic views. For example, pattern matching algorithms can be used to automatically search for behavioral patterns. Furthermore, abstractions are typically constructed for the static views before constructing them for the dynamic views. The static hierarchies can then be used for clustering the dynamic information automatically (cf. Sections 8.9 and 9.4.3).. Most of the static reverse engineering tools and environments use graphical representations to view the extracted information. Some of the tools allow manipulations of the view/views and give support for building high-level models of the target software to facilitate program comprehension. Next we give examples of such tools. An introduction of six static reverse engineering or design recovery tools is followed by a description seven tools that emphasize dynamic reverse engineer-. 13.
(23) 2.2. REVERSE ENGINEERING APPROACHES AND TOOLS. ing. The tools are selected to give examples of unique categories of reverse engineering and design recovery approaches.. The Rigi reverse engineering environment [74], for example, uses a directed graph to view the software artifacts and their relations and supports the extraction of abstractions and design information out of existing software systems [73]. To build more abstract views to the software, the user can form hierarchical structures for the graph by using subsystem composition facilities supported by the graph editor. Such structures are shown as nested views. Rigi is discussed in Chapter 7 in more detail.. Since Rigi is easy to customize, tailor, and extend, it has been integrated with several other tools and environment, for example, the Portable Bookshelf (PBS) [34] and the Dali [52] tool sets. The PBS is intended to be developed, managed, and used by three types of people: a builder, a librarian, and a patron. A builder creates the bookshelf architecture. She designs a general programunderstanding schema and integrates usable tools to support a librarian in her work. A librarian populates the bookshelf repository with information about the target software system. Finally, a patron is an end-user of the bookshelf content who needs detailed information to re-engineer the legacy code [34].. Dali is a workbench for architectural extraction, manipulation, and conformance testing [52]. It integrates several analysis tools and saves the extracted information in a repository. Dali uses a merged view approach, modeling all extracted information as a customized Rigi graph. In addition to static information, the constructed Rigi graph contains information about the behavior of the target software system, extracted using profilers and test coverage tools. The user can organize and manipulate the view and hence produce other, refined views on a desired level of abstraction.. Imagix4D from Imagix Corporation [46] supports reverse engineering and documenting C and C++ software systems. The source code of the target software can be analyzed and browsed at any level of abstraction using different views. Imagix4D uses 3D views to help the user to focus and. 14.
(24) 2.2. REVERSE ENGINEERING APPROACHES AND TOOLS. analyze particular aspects of the software.. DESIRE [8] is a model-based design recovery system that can be used for concept recognition and program understanding. It provides intelligent assistant facilities to search for instances of user-defined concepts, to identify concepts that correspond to some domain model concept, and to propose a concept assignment for a given interest set. DESIRE is also able to produce call graphs, reference points of global variables, symbols defined in a given scope, filterings and clusterings of components and dependencies, etc.. ManSART is a software architecture recovery system that uses an abstract syntax tree (AST) of the program as a source of information [14]. The AST is produced using Refine-based workbenches by Reasoning Systems [86]. With ManSART the user is able to interpret and integrate the results of localized, perhaps language-specific, source code analysis in the context of large size systems written in multiple languages [14].. Dynamic reverse engineering tools often use variations of a basic MSC or directed graphs to visualize the run-time behavior of the target software system. For example, a directed graphs can be used to visualize the run-time object interactions by representing objects as nodes and visualizing method calls or variable accesses as arcs between the nodes. Both of these graphical representations are simple and self-explanatory and thus suitable to be used for program understanding purposes. However, without notational extensions, they do not scale up. A large amount of runtime information is typically generated, even as a result of a relatively brief usage of the system. Thus, managing and abstracting the extracted information is necessary. This is usually the most challenging problem in dynamic reverse engineering. Behavioral patterns are often used to build abstract views of the dynamic event trace information. High-level views can also be constructed by taking advantage of abstractions built for the static view. Both of these approaches are used in this research.. Ovation uses execution pattern views to visualize and explore a program’s execution at different. 15.
(25) 2.2. REVERSE ENGINEERING APPROACHES AND TOOLS. levels of abstraction [26, 27]. It offers several means to manipulate the view, e.g., for raising the level of abstraction and to manage the event explosion problem.. Sefika et al. introduce an architectural-oriented visualization approach that can be used to view the behavior of a target system in different levels of granularity [99]. They introduce a technique called architectural-aware instrumentation, which allows the user to gather information from the target system at the desired level of abstraction. Such include subsystem, framework, pattern, class, object, and method levels.. Walker et al. use high-level models for visualizing program execution information [120]. In the main view, called a cel, high-level software components are represented as boxes. The mapping between low-level software artifacts and high-level components they belong to is done manually using a declarative mapping language. The visualization technique by Walker et al. also focuses on showing summary information (e.g., current call stacks and summaries of calls).. Scene tool produces and visualizes event traces as scenario diagrams [59]. It allows the user to browse the scenarios and other associated documents. For compressing the large amount of extracted event trace information Scene shows the operation calls (messages) in a closed form as default: the internal events of a call are not shown unless ’opened’ by clicking the call arc. In this way the user can proceed to the interesting level, in a top-down fashion.. ISVis is visualization tool that supports the browsing and analysis of execution scenarios [51]. In ISVis, the event trace can be analyzed using a Scenario View. The static information about files, classes, and functions belonging to the target software are listed in a Main View of ISVis. The view allows the user to build high-level abstractions of such software actors through containment hierarchies and user-defined components. A high-level scenario can be produced based on static abstractions.. Program Explorer combines static information with run-time information to produce views that. 16.
(26) 2.2. REVERSE ENGINEERING APPROACHES AND TOOLS. summarize relevant computations of the target system [60, 61]. It uses directed graphs to illustrate class relationships and object interactions. The order of the interactions is viewed as interaction charts. To reduce the amount of run-time information generated the user can choose when to start and stop recording events during the execution. Merging, pruning, and slicing techniques are used for removing unwanted information from the views.. Richner et al present a query-based approach to recover high-level views of object-oriented applications [87]. Static and dynamic aspects of the target software are modeled in terms of logic facts. Depending on the queries made, the views may contain static and/or dynamic information and model the information on different levels of abstraction. The queries also provide a way to restrict the amount of information generated.. A design pattern systematically names, explains, and evaluates and important and recurring design in object-oriented design. Each pattern describes a frequently occurring problem and describes the core of the solution to it. Gamma, Helm, Johnson, and Vlissides have catalogued and described several popular creational, structural, and behavioral design patterns [36]. Tools that support the identification of the design patterns help engineers to learn and understand object-oriented software systems. Bansiya introduces the DP++ tool that automates design-pattern detection, identification, and classification in C++ programs [5]. The DP++ tool identifies several structural and behavioral patterns.. 2.2.2. Software metrics. Software metrics have traditionally been used in forward engineering to improve the quality of the software. For example, software metrics can be used to measure the complexity of the software design and to predict properties of the final product. They can also be used to predict the amount of testing necessary or the total development costs [25].. Software metrics can play a significant role also in the reverse engineering process. Complexity metrics can be applied to support the identification of complex parts of the software. Such. 17.
(27) 2.2. REVERSE ENGINEERING APPROACHES AND TOOLS. parts typically need restructuring to improve the reusability and the reliability of the software. One of the most commonly used complexity measure is cyclomatic complexity [70]. It has been widely used in various reverse engineering environments and applied as the basis for other metrics.. Design flaws can also be identified by applying appropriate metrics. Metrics for object interactions can reveal tightly coupled and/or loosely cohesive parts of the software [16, 17, 39]. Tightly coupled parts are inflexible for modifications and reuse. Loosely cohesive parts might also need restructuring. For example, low cohesion inside a class in an object-oriented software system might hint that the class contains unfitting or unused methods or variables.. Metrics that examine the inheritance hierarchy of object-oriented software systems are used to predict reusability and complexity of the software. For example, deep inheritance trees constitute greater design complexity since more methods and classes are involved in dynamic binding. On the other hand, they provide more choices for potential reuse.. Li and Henry have used software metrics that focus on inheritance hierarchy, complexity, coupling, and cohesion to measure maintainability in two independent empirical studies [64, 65]. Some of the metrics can be applied to software written in any language, while others are dependent on the programming paradigm or the language. For example, object-oriented metrics [66, 43] are used to evaluate object-oriented software systems.. Software metrics are used in many reverse engineering environments to help the user to analyze constructed views of the target software. In Rigi, a “low coupling and high cohesion” principle is used for subsystem structure identification when reverse engineering C programs [73]. McCabe Reengineer from McCabe & Associates Inc. [71] provides views of the system architecture and views of the interaction among modules, based on the analysis of the source code. Complexity and structuredness of software modules is measured using metrics. The results are shown using a specific coloring on the views.. 18.
(28) 2.2. REVERSE ENGINEERING APPROACHES AND TOOLS. CodeCrawler is a platform built to support program understanding by combining metrics and program visualization [28]. CodeCrawler provides views that show selected structural aspects of the software as a simple two-dimensional graph. A node in a graph represents a software artifact in C++ code (e.g., a class). CodeGrawler is able to visualize up to five metric values simultaneously on a single node: the size of a node can render two measurements (the width and the height), the position of the node can also render two measurements (X and Y coordinates), and the color of the node that may vary between white and black can be used to visualize one measurement.. Hindsight reverse engineering tool from IntegriSoft Inc. is able to produce different kinds of reports, charts, and diagrams that help program understanding [48]. Hindsight uses software metrics to analyze the complexity of the target software. It also supports dynamic testing of the software. The dynamic information is generated using a source code instrumentation technique.. Logiscope from CS Verilog supports both static and dynamic analysis of a target software system [23]. It is able to produce static call and control graphs of the target software. Quantitative information based on software metrics and graphs can be generated to help the user to diagnose defects. For dynamic analysis of a target software system Logiscope provides the TestChecker tool to measure structural test coverage and to detail the uncovered source code paths. TestChecker uses source code instrumentation approach to generate the dynamic information.. 2.2.3. Supporting re-engineering and round-trip-engineering. Chikofsky and Cross characterize re-engineering as an examination of a subject system to reconstitute it in a new form and the subsequent implementation of the new form [18]. Reverse engineering approaches are typically used for understanding the subject system in a re-engineering process. However, reverse engineering techniques can and should be applied for forward engineering as well. That would support a change from a conventional “water fall” style of forward engineering to a more incremental and evolutionary style of software construction. In other words, round-trip-engineering would be supported. To support re-engineering and round-trip-engineering. 19.
(29) 2.2. REVERSE ENGINEERING APPROACHES AND TOOLS. a reverse engineering tool should be able to produce standard object-oriented analysis and design (OOAD) models from the target software. This would give the user an obvious benefit: since such models are (probably) familiar to the user from designing the software, using them for reverse engineering would unburden her from learning yet another model or diagram notation.. Various tools supporting forward engineering of object-oriented software are also able to extract class diagrams for existing software systems, for example, Rational Rose from Rational Software Corporation [82, 83, 84], Paradigm Plus from Computer Associates International [22], OEW from Innovative Software GmbH [47], Graphical Designer from Advanced Software Technologies Inc. [1], Domain Objects from Domain Objects Inc. [29], COOL:Jex from Sterling Software Inc. [105], etc. To give full support for round-trip engineering extraction of class diagrams is not enough. It is far more difficult to construct dynamic models like UML statechart diagrams and use case diagrams from the recorded run-time behavior than to generate class diagrams from the source code. As discussed in Section 8.10.1, dynamic reverse engineering tools typically use directed graphs or variations of an MSC to visualize the run-time behavior. In this research, not only SCED scenario diagrams but also state diagrams are used for modeling the run-time behavior (cf. Chapter 8). However, the ultimate goal of constructing state diagrams was supporting program understanding, rather than supporting round-trip-engineering. Hence, state diagrams are used for understanding the behavior of a target Java software system, not for specification of a software system to be implemented.. Versatile tools and environments that support both forward and reverse engineering are available. StP from E2S is a modeling-based software development environment that also supports reverse engineering, testing, and requirements engineering [33]. StP provides different tool sets for developing and maintaining software written in different languages. For example, StP/UML, StP/OMT, and StP/Booch integrated with third-party programming environments can be used for incremental code generation and reverse engineering of object-oriented software systems.. The Viasoft Existing Systems Workbench (ESW) from Viasoft Inc. is an integrated software tool. 20.
(30) 2.2. REVERSE ENGINEERING APPROACHES AND TOOLS. set that supports software maintenance in various ways [119]. The tool set includes, for example, a reengineering tool Renaissance, a static analysis and a documentation generator SmartDoc, application and program understanding and visualization tools Alliance and Insight, a software testing and debugging tool SmartTest, a code generation and converting tool AutoChange, and a metrics tool Recap.. Tool sets Ensemble and ObjectTeam from Sterling Software Inc. support application development of C and object-oriented programs, respectively [105]. Ensemble provides graphical views for analyzing the design of the target software. Complexity metrics can be applied to the software to help the designer to make a re-design or re-use decision. Ensemble also supports testing and documentation generation.. 2.2.4. Other tools facilitating reverse engineering. Reverse engineering a target software system can be supported in several ways. As discussed above, design models can be constructed to characterize the structure and the behavior of the software visually, while metrics can be used to point out its interesting aspects or design flaws. Tools that support browsing the documentation or source code also support program comprehension. Hypersoft tool supports automated detection of software structures that are critical for understanding and re-engineering C software systems [77]. It also enables the navigation of such structures through automatically generated hypertext documents. Furthermore, the Hypersoft tool supports the examination of the side effects of software renovations, detecting errors, and controlling the testing of the re-engineered software. Tools that support other reverse engineering tools form yet another interesting group of tools. Software Refinery from Reasoning Systems, for example, is a set of tools that can be used to generate reverse other engineering tools [86]. It contains tools for generating source code parsing and conversion tools. Software Refinery supports C, Ada, and Cobol.. 21.
(31) 2.2. REVERSE ENGINEERING APPROACHES AND TOOLS. 2.2.5. Summary. Both static and dynamic reverse engineering are needed to understand an object-oriented software system fully. Compared to procedural languages, the importance of dynamic reverse engineering needs to be emphasized when studying object-oriented software systems. This is due to the dynamic nature of object-oriented programs. The extracted information needs to be shown in a readable and descriptive way. Static and dynamic information can be presented in separated views or merged in a single view. Both approaches have advantages and disadvantages. In this research, the multiple view approach is promoted.. A wide range of reverse engineering and design recovery tools can be categorized in various ways. We identify the following three groups: tools that support program understanding through highlevel models, tools that use software metrics for studying software properties, and tools that support re-engineering and round-trip engineering. The Shimba environment presented in this dissertation belongs to the first group.. 22.
(32) Chapter 3. Modeling with UML The Unified Modeling Language (UML) has been accepted as an industrial standard for specifying, visualizing, understanding, and documenting object-oriented software systems [95, 85]. It provides several diagram types that can be used to view and model the software system from different perspectives and/or at different levels of abstraction. UML supports all lifecycle stages of the forward engineering process from requirements specification to implementation and testing. The same diagram types used in forward engineering have been used for reverse engineering purposes as well [1, 29, 83, 84, 105].. First object-oriented analysis and design (OOAD) methods were published in the late 80’s and early 90’s. In addition to the three independent core methods of UML, namely Booch ’91 [9], object-oriented modeling and design (OMT-1) [94], and object-oriented software engineering (OOSE) [50], methods were published, e.g., by Coad and Yourdon [19], Shlaer and Mellor [98], and Wirfs-Brock et al. [122]. The development of UML began in 1994. The first draft called Unified Method 0.8 was released in 1995. It merged second editions of Booch ’91 and OMT-1, namely Booch ’93 [10] and OMT-2 [90, 91, 92, 93]. When OOSE was merged into the Unified Method in 1996, the name was changed to UML. The first official version, UML 1.0, was published in 1997, followed by versions 1.1 and 1.3. The evolution of UML is depicted in Figure 3.1. Another attempt to join different OOAD methodologies was Fusion [20], which included concepts of OMT, Booch ’91, and CRC [122].. 23.
(33) Chapter 3. Modeling with UML. Figure 3.1: Evolution of UML[85]. UML provides diagrams that capture information about the static structure of the software, and diagrams that model the dynamic behavior of the software. Some of the diagrams (e.g., a collaboration diagram) combine both dynamic and static aspects of the software. UML also contains organizational constructs for managing and arranging other models. Furthermore, UML provides concepts and general model elements that can be used to make some common extensions without changing the underlying modeling language and concepts and general model elements that can be used to extend different models. Table 3.1 shows the diagram types of UML.. Next we discuss selected UML diagrams, starting from class diagrams. Since the focus of this research is on dynamic modeling, the rest of this chapter discusses behavioral modeling using UML, the emphasis being on sequence diagrams and statechart diagrams. Collaboration diagrams and activity diagrams are also briefly characterized.. 24.
(34) 3.1. CLASS DIAGRAMS. Diagram types Static structure diagrams Use case diagrams Behavioral diagrams. Implementation diagrams. Diagrams class diagram object diagram use case diagram statechart diagram activity diagram sequence diagram collaboration diagram component diagram deployment diagram. Table 3.1: Different diagram types of UML[95]. 3.1 Class diagrams A class diagram is a graphical presentation of the static view that shows a collection of declarative (static) model elements, such as classes, interfaces, types, as well as their contents and relationships [85, 95]. In what follows, we discuss the main parts of the class diagram notation.. A class is the descriptor for a set of objects with similar structure, behavior, and relationships. A class is drawn as a rectangle with three compartments separated by horizontal lines. The top compartment holds the class name. The middle and bottom compartments are reserved for a list of attributes and a list of operations, respectively. An interface is a named set of operations that characterize the behavior of an element [95]. Interfaces are shown as rectangles with two compartments. The top compartment shows the name of the interface and includes a stereotype “<<interface>>”. The bottom compartment contains the list of operations. Besides classes and interfaces, a class diagram may also contain, for instance, packages and types.. Various kinds of relationships may exist among model elements of a class diagram. An association between two or more classes indicate that there are connections among instances of the classes. The connections can be, for example, method calls or links between the objects. An association between two classes is shown as a solid line connecting the rectangles of the classes. Additional information can be attached to an association. For example, an association may be directed and it. 25.
(35) 3.1. CLASS DIAGRAMS. may show the multiplicity and rolenames of instances involved in the connection at each end of the associations. Generalization relationships can be used to show inheritance between classes. Generalization is depicted as a solid line from the subclass to the superclass, with a large hollow triangle at the end of the superclass. Composition is a form of aggregation with strong ownership and coincident lifetime [95]. Composition may be shown as a solid filled diamond at the end of the owner class.. Figure 3.2 shows a simple class diagram describing an elevator system. The system consists of five classes. Class Janitor inherits class Person, indicating that a janitor is a person. In addition to four operations inherited from class Person, operation maintain() can be called for each instance of class Janitor. Classes Elevator and House have a composition relationship. It indicates that an elevator is a part of a house. The multiplicities of the composition defines the situation more specifically: in a house there can be up to four elevators and a particular elevator can be in one house only. Other relationships are normal associations. The class diagram has been drawn using the FUJABA tool [88].. Figure 3.2: A class diagram describing an elevator system. The class diagram has been constructed using the FUJABA tool[88].. 26.
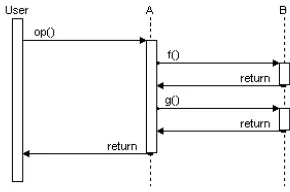
(36) 3.2. SEQUENCE DIAGRAMS. 3.2 Sequence diagrams A sequence diagram describes the object interaction arranged in time sequence. Participating objects are shown by their lifelines as vertical lines. A lifeline shows the existence of an object over a period of time. For any period during which the object is active, the lifeline is broadened to a double solid line. Messages exchanged by objects are drawn as arrows between lifelines. A message is a conveyance of information from one object to another, with the expectation that an activity will ensue [95]. It may be a signal or a call of an operation. The receipt of a message instance is normally considered an instance of an event, which is a specification of a noteworthy occurrence that has a location in time and space [95]. Sequence diagrams occur in slightly different formats when intended for different purposes [85]. Two examples of sequence diagrams are given in Figures 3.3 and 3.4. Figure 3.3 shows a simple sequence diagram with three concurrent objects. Comments are written on the left of the diagram as plain text. Timing constraints are closed inside braces. The sequence diagram in Figure 3.4 contains the following additional UML sequence diagram concepts: an object creation (e.g., op() creates an object ob1), conditional branching (events [x > 0] foo(x) and [x < 0] bar(x)), conditional branches in the communication (branching dotted line of ob4:C4), a recursion (the object obj1 calls its own more() method), and an object deletion (crosses at the end of lifelines of ob1:C1 and ob2:C2). Branching shown as multiple arrows leaving a single point may represent conditionality or concurrency, depending on whether the guard conditions are mutually exclusive or not [85]. The branching in Figure 3.4 hence represents conditionality.. 3.3 Collaboration diagrams A collaboration diagram shows an interaction organized around objects (needed in the interaction) and their links to each other. A collaboration diagram is very close to a sequence diagram. They both show interactions, but they emphasize different aspects. A sequence diagram shows the interaction over time but does not show other relationships among objects than the messages belonging to the interaction. A collaboration diagram, in turn, does not show time as a separate dimension. The order of messages can be expressed by numbering. The relationships among the objects are. 27.
(37) 3.3. COLLABORATION DIAGRAMS. Figure 3.3: A simple sequence diagram with concurrent objects [85] (Notation Guide). Figure 3.4: A sequence diagram with focus of control, conditional, recursion, creation, and destruction [85] (Notation Guide). 28.
(38) 3.4. STATECHART DIAGRAMS. explicitly shown in a collaboration diagram. Hence, a collaboration diagram also includes a static aspect. While sequence diagrams show the explicit sequence of stimuli and are hence better for realtime specification and complex scenarios, collaboration diagrams show the full context of an interaction, including objects and relations relevant to a particular interaction [85]. Figure 3.5 shows an example of a collaboration diagram.. Figure 3.5: A collaboration diagram with message flows[85](Notation Guide). 3.4 Statechart diagrams A state machine of an object is a directed graph that consists of states and transitions, describing the response of the object to external stimuli. A statechart diagram is a graph that represents a state machine. The semantics and notation used in UML follow Harel’s statecharts [40]. Statecharts are a widely used notation for structuring state machines and avoiding the combinatorial explosion that plagues them. Harel’s statecharts play a significant role in the design process of a larger development methodology that has been implemented as a commercial product called STATEMATE [41, 42] from I-logic Inc. STATEMATE is a set of tools used for modeling reactive systems. STATEMATE is most beneficial in requirements analysis, specification, and high-level. 29.
(39) 3.4. STATECHART DIAGRAMS. design [42]. Rhapsody is another tool from I-Logic, in which Harel’s statecharts are used. The Rhapsody tool can be used for analyzing, modeling, designing, implementing, and verifying the behavior of embedded systems software. Prior to UML, statecharts have been adopted by other OOAD methodologies as well, including OMT. The use of statecharts in object-oriented design is discussed by Coleman et al. [21].. A state in a UML statechart diagram is a condition or situation during the life of an object during which it satisfies some condition, performs some activity, or waits for some event [95]. In a system, objects stimulate each other causing state changes by sending and receiving events. When a specified event occurs and the associated guard conditions are satisfied, an object can change its state. Such a state change is called a transition. A statechart diagram thus relates events and states.. UML statechart diagrams are drawn as directed graphs in which nodes represent states and directed edges represent transitions. A state is drawn as a rounded rectangle containing the activities it performs in that state and an optional name for the state, separated with a horizontal line from the action part. A transition is drawn as an arrow from the source state to the target state. Statechart diagrams may also have special kinds of states. An initial state indicates the starting point of a statechart diagram. Reaching a final state means that the execution of the statechart diagram has completed. There can be only one initial state but several final states in a statechart diagram. An initial state is drawn as a small filled black circle and a final state as a bull’s-eye icon.. A state may contain actions and activities. Actions are atomic and non-interruptible, while activities take time to complete and can be interrupted by an event. An ongoing activity can be expressed as a nested statechart diagram, or by a pair of actions: an entry action starts the activity and an exit action stops it. Entry and exit actions can be individual actions as well. Entry actions are executed when entering the state and exit actions when leaving it. Keywords “do/”, “entry/”, and “exit/” are attached to activities, entry actions, and exit actions, respectively. A state can also have internal transitions that may have actions attached to them. An internal transition is fired when a specified event occurs. That causes the execution of an action attached to it, but not a state change nor an. 30.
(40) 3.4. STATECHART DIAGRAMS. interruption of the activities of the state. The event part is separated form the action part by a slash.. A simple transition consists of four parts: an event name, event parameters, a guard condition, and actions. The first three define the circumstances under which the transition may fire. When fired, the actions attached to the transition are executed. A transition without an explicit trigger event is called a completion transition. It is fired when the activities of its source state are completed provided that its optional guard condition is satisfied. A concurrent transition may have multiple source and/or target states. It represents a synchronization and/or a splitting of control into concurrent threads [85]. An action-expression is a chain of actions, separated with a delimiter. An action-expression must be an atomic, non-interruptible operation. Such an action-expression can be attached to transitions, entry actions, exit actions, or internal transitions. The statechart diagram in Figure 3.6 contains a simple transition with a label and an action, completion transitions, concurrent transitions, an entry action, and and activity.. Figure 3.6: A statechart diagram with simple and concurrent transitions. Action action1 is executed when transition e is fired. Entering state Finalization , in turn, causes an entry action cleanup to be executed, after which an activity activity1 is started.. Flat state transition diagrams have often been criticized for being impractical and ineffective for modeling large systems. Harel introduces some concepts for raising the expressive power of statecharts [40]. One of them is a superstate notation; a way to cluster and refine states. The semantics of a superstate is an exclusive-or (XOR) of its substates; to be in a superstate an object must be in exactly one of its substates. A superstate is drawn as a large rounded box enclosing all of its substates. Transitions drawn to enter a superstate contour are entering the initial state enclosed inside. 31.
(41) 3.4. STATECHART DIAGRAMS. the superstate. Transitions drawn to leave the superstate contour apply to any of its substates. An example of state generalization by using the superstate notation is shown in Figures 3.7 and 3.8. The information content of these state diagrams is the same (i.e., exactly same paths/event sequences can be found from them). Even these two small state diagrams give an idea of the benefits of nesting states; it is a powerful tool against combinatorial explosion of transitions. UML statecharts can be nested similarly. The contents of the superstate, which is called a composite state in UML, can also be shown as a separate statechart diagram. In that case, running the enclosed statechart diagram is expressed as an activity. Collapsing the contents of statechart diagrams this way provides extended means to keep the diagrams compact. Figure 3.9 shows such a high-level statechart diagram constructed from the state machine in Figure 3.8.. Figure 3.7: A flat state diagram of a car transmission. Figure 3.8: A nested state diagram of the car transmission. 32.
(42) 3.4. STATECHART DIAGRAMS. Figure 3.9: A high-level statechart diagram of the car transmission. In addition to XOR composition of states, there is another way of structuring Harel’s statecharts, namely AND decomposition. A state consisting of AND components is said to be an orthogonal product of its components, meaning that being in such a state, the system must be in all of its AND component subcharts. Hence, orthogonality is a way of representing independence and concurrency. Such a state is visually shown as a state box that is split into components using dashed lines, each separated component representing one orthogonal component [40]. Transitions drawn to enter a superstate contour are interpreted to enter the initial states of all enclosed orthogonal statecharts. A transition drawn to leave the superstate contour applies to all the substates the system is currently in. Figures 3.10 and 3.11 show two Harel’s statecharts both capturing the same information; Figure 3.10 shows a flat statechart and in Figure 3.11 there is a state diagram with two orthogonal components. The label b(in G) of the transition from state B to state A in Figure 3.11 expresses conditionality: the transition is fired when an event b occurs but only if the system is in state G of the orthogonal component. Similar notation is used in UML statechart diagrams for expressing concurrency. If there is a completion transition drawn to leave from the contour of such a decomposed state, the state is exited when all the subdiagrams have reached their final state.. In addition to UML statechart diagram concepts discussed in this chapter, the notation includes history states, deep history states, junction states, joins, and submachine reference states. These concepts are not reviewed in this dissertation.. 33.
(43) 3.4. STATECHART DIAGRAMS. Figure 3.10: A flat statechart. Figure 3.11: A statechart that consists of two orthogonal components. 34.
(44) 3.5. ACTIVITY DIAGRAMS. 3.5 Activity diagrams An activity diagram is a special case of a statechart diagram, in which the states are primarily activity states or action states and in which all (or at least most) of the transitions are triggered by the completion of an activity in the source states [95](p. 135). An activity state has an internal computation and at least one leaving completion transition that fires on the completion of the activity of the state. It should not have any internal or outgoing transitions that are based on explicit events. An action state is atomic, i.e., it cannot be interrupted by transitions. In addition, a way to nest activity diagrams using subactivity states is introduced in UML [85]. A subactivity state invokes another activity diagram. The subactivity state is not exited until the final state of the nested diagram is reached, or when trigger events occur on transitions coming out of the subactivity state. An activity diagram suites best for describing situations where all or most of the events represent the completion of internally generated actions (i.e., for procedural flow of control). An activity state is drawn as a shape with straight top and bottom and with convex arcs on the two sides. There is no special notation for an action state. It is usually drawn as a ordinary state. Figure 3.12 shows an example of an activity diagram.. 35.
(45) 3.5. ACTIVITY DIAGRAMS. Figure 3.12: An activity diagram[85]. 36.
(46) Chapter 4. SCED SCED has been developed to improve automated support for dynamic modeling in OO software construction [56]. During the development of SCED, the OMT methodology [94, 90, 91] was chosen as a guideline and notation basis. The diagrams used for dynamic modeling in OMT are extended in UML. SCED diagrams are also extended from OMT ones, providing notations that are semantically close to corresponding diagrams in UML. The graphical notation of the diagrams differs, the reason being that SCED was developed during years the 1992 – 1995, while the earliest version of UML, called Unified Method, was introduced in October 1995.. The name “SCED” comes from words SCenario EDitor, since the scenario editor part was implemented first. This emphasizes one of the main ideas behind SCED: the dynamic modeling starts with constructing scenarios. When a sufficiently complete set of scenarios exists, they are transformed into a state diagram for desired participating objects. SCED was developed to be used in forward engineering of object-oriented software systems, although the tool is usable also for other kinds of modeling tasks with a scenario driven approach. In this dissertation, it is shown how SCED can be used for reverse engineering purposes.. An overview of the implementation is presented next. The rest of this chapter introduces the scenario and state diagram notations of SCED. The content of this dissertation relies heavily on the proposed notations. For detailed information about SCED, the reader is referred to [55, 56, 57,. 37.
(47) Chapter 4. SCED 67, 68, 69, 110].. SCED consists of two independent editors: a scenario editor and a state diagram editor. Most of the user interaction is concentrated in these editors. The third part of SCED is a generator, which is just a command activated part (i.e., it is not visible to the user). At any time during scenario editing the user can select one participating object and ask the generator to synthesize a state diagram automatically for it. The synthesis can be done for one scenario only or for a specified set of scenarios. In the latter case, the generator synthesizes each scenario that includes the selected object. Moreover, scenarios can be synthesized to an existing state diagram. The resulting state diagram is then editable using the state diagram editor. The state diagram synthesis algorithm is discussed in Chapter 5 in more detail. The generator can also be asked to optimize a state diagram by adding UML statechart diagram components to it. The optimization algorithms are described in Chapter 6. Finally, some support for checking the consistency between a state diagram and scenarios is available, as discussed in Section 4.2.. SCED was developed in and for the Microsoft Windows environment. The software can be run under Windows NT and Windows 95/98. The tools that are being used for the development work have been selected so that porting to Unix with OSF/Motif should be possible with moderate effort. These tools, versions of which have been changed several times during the development of SCED, are: 1. Borland C++ — C++ language compiler [31, 108, 109]. 2. LEDA — Library of Efficient Data types and Algorithms [75]. Portable across wide range of platforms. 3. wxWindows — GUI library [101]. Portable between MS–Windows, Windows NT, Motif, Open Look.. 38.
Figure
![Figure 3.4: A sequence diagram with focus of control, conditional, recursion, creation, and de-struction [85] (Notation Guide)](https://thumb-us.123doks.com/thumbv2/123dok_us/8116683.238353/37.595.172.453.137.353/figure-sequence-diagram-conditional-recursion-creation-struction-notation.webp)
+7

![Figure 3.12: An activity diagram[85]](https://thumb-us.123doks.com/thumbv2/123dok_us/8116683.238353/45.595.157.468.264.614/figure-an-activity-diagram.webp)
Outline
Scenario diagrams
Applying the BK-algorithm to state diagram synthesis
Problems in the synthesis of state diagrams
Related research
Exit actions
Removing UML notation concepts from state diagrams
Reverse engineering object-oriented software using Rigi
Dynamic reverse engineering tools
Modeling the internal behavior of a method
Relationships between static and dynamic models
Related documents
Les services associ es a la biodiversit e sont donc potentielle- ment nombreux dans le contexte des productions v eg etales, si bien qu’une baisse de biodiversit e dans
The optimal value of ω is obtained by developing an analytical model based on Continuous Time Markov Chain (CTMC), which takes into account the system specific limitations
ﻪﺑ ﯽﺳرﺮﺑ رﻮﻈﻨﻣ ﯽﮔداﻮﻧﺎﺧ يﺎﻫزﺎﯿﻧ سﺎﯿﻘﻣ رﺎﺒﺘﻋا هوﺮﮔ رﺎﻬﭼ 30 ﺮﻔﻧ بﺎﺨﺘﻧا ي زا ﮏﯾ ﺮﻫ صﻮﺼﺧ رد و ﺪﻧﺪﺷ هوﺮﮔ سﺎﯿﻘﻣ ،ﺎﻫ يﺎﻫزﺎﯿﻧ ﯽﮔداﻮﻧﺎﺧ ﺎﺑ ﻪﻣﺎﻨﺸﺳﺮﭘ زا ﯽﮑﯾ هداﻮﻧﺎﺧ ياﻮﺘﺤﻣ
The number of employees in Sweden in the companies that responded amounts to approximately 470 000 (the principles for the sample are presented in "The design of the
When TA and GS-miApoB encoding cassettes were placed in 4 different orientations in a single backbone, variant #3, where the transcription occurs in the
In this paper we considered a dynamic principal-agent model with adverse selection and moral hazard and proved a dynamic irrelevance theorem: In any implementable decision rule
Second, socioeconomic, cultural and linguistic differences between ethnic groups and Dutch society may play little role in the higher education system, compared to lower segments of
