This is a repository copy of Generalised additive multiscale wavelet models constructed
using particle swarm optimisation and mutual information for spatio-temporal evolutionary
system representation.
White Rose Research Online URL for this paper:
http://eprints.whiterose.ac.uk/74618/
Monograph:
Wei, H.L., Billings, S.A. and Zhao, Y. (2007) Generalised additive multiscale wavelet
models constructed using particle swarm optimisation and mutual information for
spatio-temporal evolutionary system representation. Research Report. ACSE Research
Report no. 961 . Automatic Control and Systems Engineering, University of Sheffield
[email protected] https://eprints.whiterose.ac.uk/ Reuse
Unless indicated otherwise, fulltext items are protected by copyright with all rights reserved. The copyright exception in section 29 of the Copyright, Designs and Patents Act 1988 allows the making of a single copy solely for the purpose of non-commercial research or private study within the limits of fair dealing. The publisher or other rights-holder may allow further reproduction and re-use of this version - refer to the White Rose Research Online record for this item. Where records identify the publisher as the copyright holder, users can verify any specific terms of use on the publisher’s website.
Takedown
If you consider content in White Rose Research Online to be in breach of UK law, please notify us by
Generalised Additive Multiscale Wavelet Models Constructed
Using Particle Swarm Optimisation and Mutual Information
for Spatio-Temporal Evolutionary System Representation
H. L. Wei, S. A. Billings, Y Zhao
Research Report No. 961
Department of Automatic Control and Systems Engineering The University of Sheffield
Mappin Street, Sheffield, S1 3JD, UK
Generalised Additive Multiscale Wavelet Models Constructed
Using Particle Swarm Optimisation and Mutual Information
for Spatio-Temporal Evolutionary System Representation
H. L. Wei, S. A. Billings, Y Zhao
Department of Automatic Control and Systems Engineering The University of Sheffield
Mappin Street, Sheffield S1 3JD, UK
[email protected], [email protected]
Abstract: A new class of generalised additive multiscale wavelet models (GAMWMs) is introduced for high dimensional spatio-temporal evolutionary (STE) system identification. A novel two-stage hybrid learning scheme is developed for constructing such an additive wavelet model. In the first stage, a new orthogonal projection pursuit (OPP) method, implemented using a particle swarm optimisation (PSO) algorithm, is proposed for successively augmenting an initial coarse wavelet model, where relevant parameters of the associated wavelets are optimised using a particle swarm optimiser. The resultant network model, obtained in the first stage, may however be a redundant model. In the second stage, a forward orthogonal regression (FOR) algorithm, implemented using a mutual information method, is then applied to refine and improve the initially constructed wavelet model. The proposed two-stage hybrid method can generally produce a parsimonious wavelet model, where a ranked list of wavelet functions, according to the capability of each wavelet to represent the total variance in the desired system output signal is produced. The proposed new modelling framework is applied to real observed images, relative to a chemical reaction exhibiting a spatio-temporal evolutionary behaviour, and the associated identification results show that the new modelling framework is applicable and effective for handling high dimensional identification problems of spatio-temporal evolution sytems.
1. Introduction
Spatio-temporal evolutionary (STE) systems, considered in this study, are a class of complex dynamical systems where the system states evolve spatially as well as temporally. Spatio-temporal evolutionary phenomena widely exist in various areas of science and engineering including biology, chemistry, ecology, geography, medicine, physics, and sociology (Kaneko 1993, Jahne 1993, Silva and Principe 1997, Astic et al. 1998, Bascompte and Sole 1998, Czaran 1998, Spors and Grinvald 2002, Dimitrova and Berezney 2002, Berezney et al. 2005, Dolak and Schmeiser 2005). To replicate, imitate, or analyse STE phenomena, several efficient representations, for example the well known cellular automata (CA) (Wolfram 1994, Ilachinski 2001), coupled map lattice (CML) models (Kaneko 1993), and cellular neural networks (CNNs) (Chua and Yang 1988a, 1988b, Chua and Roska 2002, have been proposed. In these representations, it is often assumed that the associated mathematical model structure, along with the model parameters, is known, so that the model can be used to describe or imitate some specific phenomena. However, the evolution law of real-world STE phenomena may not always be completely known, and relative evolution rules need to be acquired from observed data of relevant images or patterns. Hence, in recent years, identification problems of spatio-temporal systems have received much attention and interest from researchers in diverse fields, and several efficient identification methods and algorithms have been proposed, see for example Adamatzky and Bronnikov (1990), Adamatzky (1994, 1997), Parlitz and Merkwirth (2000), Sitz et al. (2003), Coca and Billings (2001), Mandelj et al. (2001), Billings and Coca (2002), Veenman et al. (2003), Billings and Yang (2003), Xia and Leung (2005), Billings et al. (2005).
One prominent feature of STE systems, compared with classical pure temporal signals or static images, is that there exists, in any given STE system, an inherent evolution law that determines the dynamical variation of relevant patterns with time. The individual value of a state at a local position of the current pattern, at the present time instant, is determined by individual values at several local positions of one or more previous patterns. In this sense, approaches for dealing with STE systems are often significantly different from those for processing classical pure temporal signals or static images, even though spatio-temporal approaches are also involved in some complex image processing, see for example Kim and J. Woods (1997, 1998), Ricquebourg and Bouthemy (2000), Sanchez-Marin et al. (2001), Caspi and Irani (2002), Ngo et al. (2003), Yang and Parvin (2003), and Nguyen et al. (2007). Compared to classical pure temporal signal modelling and static image processing, the identification and modelling of high dimensional STE systems are more challenging.
nonlinear models containing a great number of ‘input’ variables. However, because of the curse-of-dimensionality, which is ubiquitously involved in any high dimensional nonlinear function learning and nonlinear modelling procedures, most existing STE system identification approaches can only handle low dimensional problems, where only a small size of neighbourhood and a very short time lag are considered.
Additive models and generalised additive models (GAMs) (Stone 1985, 1986, Buja et al. 1989, Hastie and Tibshirani 1990) are an important class of representations for high dimensional nonlinear signals. It follows that GAMs can not only avoid the curse of dimensionality, but also provide the ability to detect nonlinear dynamics and nonlinear patterns, without sacrificing interpretability of the relevant component functions. Also, GAMs, combined with other modelling techniques, have recently become extremely popular and have been widely applied in high dimensional data processing and modelling (Aerts et al. 2002, Ruppert et al. 2003, Wood 2004, Brezger and Lang 2006, Lado et al. 2006, Wei and Billings 2006a). Wavelet transforms (Daubechies 1992, Mallat 1998), due to their inherent properties and excellent capability for time-frequency domain representations of arbitrary signals (Unser 1995, Van De Ville et al. 2004), should be one of the best candidates to form the most powerful elementary building blocks to implement generalised additive models.
The construction of wavelet-based adaptive additive models may need to solve some nonlinear-in-the-parameters problems. Traditionally, Gaussian-Newton type nonlinear optimisation methods are often applied to estimate the unknown model parameters, with a stipulation that the gradients of the associated object functions are differentiable and easy to explicitly calculate. In this study, however, the recently developed particle swarm optimisation (PSO) algorithm (Eberhart and Kennedy 1995, Kennedy and Eberhart 1995) is employed as an alternative to solve complex nonlinear optimisation problems. Compared with classical nonlinear least squares algorithms, the PSO algorithm, as a population-based evolutionary method, possesses several desirable attractive properties, for example, this type of algorithm is easy to implement but quite efficient in dealing with a wide class of nonlinear optimisation problems. As a stochastic algorithm, PSO does not need any information on the gradients of the relevant object functions, this ensures that PSO is highly suitable for nonlinear optimisation problems where the relevant object functions are not differentiable or the gradients are computationally expensive or very difficult to obtain (van den Bergh 2002).
the second stage, a forward orthogonal regression (FOR) learning algorithm (Billings and Wei 2007a, Wei and Billings 2007), implemented using a mutual information estimation method, is then applied to refine and improve the initially obtained wavelet model by removing redundant wavelet functions from the model.
As will be seen from the illustrative example, by combining the PSO based nonlinear OPP learning method with the effective mutual information aided FOR algorithm, the resultant additive wavelet model can provide very good representations for a class of high dimensional STE systems. One feature of the new GAMWM, produced by the above two-stage hybrid learning algorithm, is that now the resultant model is transparent to model users. Involved wavelets are ranked according to the capability in representing the total variance in the system output signal. This is desirable for many application cases where physical insight on the individual variables and associated model basis functions are of interest. Also, notice that the proposed GAMWM is nearly self-implemented, that is, all model parameters can automatically be adjusted by the proposed algorithms. This is desirable for any structure-unknown or black-box modelling problem. In summary, the main contribution of this work is that it provides, for the first time, an effective automatic and adaptive model identification approach for STE systems involving very high dimensional modelling procedures, by means of the proposed two stage hybrid constructive learning scheme that can produce sparse and transparent models with good generalisation properties.
This paper is organised as follows. In section 2, the general form of STE systems is briefly described. In section 3, the structure of the new GAMWM is presented. In section 4, a two-stage hybrid learning scheme, involving both the PSO based orthogonal projection pursuit approach and the mutual information aided forward orthogonal regression algorithm, is addressed in detail. In section 5, an example, relative to real observations for a chemical experiment, is presented to demonstrate the application of the new modelling framework. Some conclusions are given in section 6.
2. Spatio-Temporal Evolutionary Systems
The general form of spatio-temporal evolutionary (STE) systems is briefly introduced. In this study, the 2-D case, which has obvious physical meaning and is widely applied in practice, is taken as an example. For simplicity, only the zero-input (autonomous) class of STE systems is considered here. Model representations for these situations can easily be extended to other more complex cases in a straightforward way.
Assume that the 2-D image or pattern produced by an STE system, at the time instant t, consists of
a I×J rectangular array of cells, Ct(i,j), with Cartesian coordinates (i,j), i=1,2, …, I, j=1,2, …, J.
Following Chua and Roska (2002), let Srt(i,j)be the sphere of influence of the radius r of cell
) , (i j
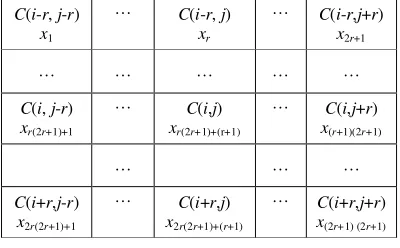
Table 1. The (2r+1)×(2r+1) neighbourhood defined by (1)
C(i-r, j-r)
x1
… C(i-r, j)
xr
… C(i-r,j+r)
x2r+1
… … … … …
C(i, j-r)
xr(2r+1)+1
… C(i,j)
xr(2r+1)+(r+1)
… C(i,j+r)
x(r+1)(2r+1)
… … …
C(i+r,j-r)
x2r(2r+1)+1
… C(i+r,j)
x2r(2r+1)+(r+1)
… C(i+r,j+r)
x(2r+1) (2r+1)
} |} | |, {| max : ) , ( { ) , ( 1 ,
1 i p j q r
j i C j i S J q I p t t
r = ≤ ≤ ≤ ≤ − − ≤ (1)
where t=1,2, …, i=1,2, …, I, j=1,2, …, J, and r is a non-negative integer number indicating how many
neighborhood cells are involved in the evolution procedure. The sphereSrt(i,j) is sometimes referred
to as the (2r+1)×(2r+1) neighbourhood. Let si,j(t)∈Rbe the state variable representing the cell
) , ( ) ,
(i j S i j
Ct ∈ rt . From the definition of Srt(i,j), a total of (2r+1)2state variables are involved in (1),
see Table 1, where the symbol C(i,j) will be used to indicate cells at arbitrary evolution time instants.
Let si,j(t) be the (i,j)th cell to be updated at time t. A wide range of STE systems can be described
by the discrete-time, discrete-space and continuous-state spatio-temporal difference equation of the form below )) ( , ), 2 ( ), 1 ( ( ) (
,j lag
i t f t t t n
s = s − s − L s −
, ), 1 ( , ), 1 ( , ), 1 (
( , − L , − L , − L
= f si−r j−r t sij t si+r j+r t
, ), 2 ( , ), 2 ( , ), 2 ( , ,
, − − L − L + + − L
− t s t s t
si rj r ij i r j r
)) ( , ), ( , ), ( , ,
,j r lag ij lag i r j r lag r
i t n s t n s t n
s− − − L − L + + − (2)
where f is some nonlinear function,nlagis the time lag, defined as a positive integer, indicating how
many past images or patterns are involved in the evolution procedure, and s(t−k) is the state vector
formed by the (2r+1)2 state variables relative to the patterns at the time instant (t-k) with k=1,2, …,
lag
n , that is,
)] ( ), ( , ), ( [ )
(t−k = si−r,j−r t−k L si,j t−k si+r,j+r t−k
s (3)
lattice models. For convenience of description, introduce d single-indexed variablesxk(t) as below
)] (
, ), 2 ( ), 1 ( [ )] ( , ), ( ), ( [ )
(t = x1 t x2 t xd t = s t− s t− st−nlag
x L L (4)
where ( ) [ 2( ), , 2()] ) 1 2 ( )
1 2 )( 1 (
1 t x t
x k
t− = +k− r+ L k r+
s for k=1,2, …, nlag . For the case nlag =1, the
description (4) is shown in Table 1. Also, let y(t) represent the state variable si,j(t) corresponding to
the central cell Ct(i,j). Then, Eq. (2) becomes
)) ( ( ) (t f t
y = x = f(x1(t),x2(t),L ,xd(t)) (5)
In conventional coupled map lattice models, the nonlinear function f in model (2) is often assumed to be known as some deterministic function, and the model is mainly used to imitate or produce some specific phenomena. However, for real-word complex STE systems, a pre-determined function f may not sufficiently characterise the underlying dynamics. It may be better to learn, from available real observations, an appropriate model for a given STE system.
The task of STE system identification is to construct, based on available data, a model that can represent, as close as possible, the observed evolution behaviour. Unlike constructing static models for typical data fitting, the objective of dynamical modelling is not merely to seek a model that fits the given data well, it also requires, at the same time, that the model should be capable of capturing the underlying system dynamics carried by the observed data, so that the resultant model can be used in simulation, analysis, and control studies.
Notice that equation (2) involves a total of d=(2r+1)2nlagvariables. A large value for either r or
lag
n will mean that a great number of variables may be involved in the representation (2). For example,
let r=2 and nlag=4, then a total of 100 variables will be involved. This means that the identification
procedure of STE systems may require constructing a very high dimensional nonlinear model involving a great number of ‘input’ (or ‘independent’) variables. This property of STE systems prohibits most traditional identification and modelling frameworks that are suitable for classical pure temporal dynamical process modelling, and new identification approach for STE systems need to be developed.
3. The New Generalised Additive Multiscale Wavelet Model
The new generalised additive multiscale wavelet models (GAMWMs) are a special implementation of the typical generalized additive models, where the additive functional components are approximated using a family of multiscale wavelet functions. Starting with the discretisation of the wavelet transform, this section represents the architecture of the new GAMWMs.
Consider a wavelet family below
−
= −
a b x a x b
a ψ
ψ , 1/2
)
( (6)
where a∈R+, b∈R, and the mother waveletψis admissible. The admissibility condition is depicted
using the Fourier transform ψˆ(ξ)of the function ψ asCψ =
∫
−∞∞ξ−1ψˆ(ξ)2dξ<∞. It has been shown(Daubechies 1992) that for reasonableψ , there exists a gridG={(am,bn):am∈R+,bn∈R;m,n∈Z},
such that the family m,n(x)=am1/2 (am1x−bn)
− − ψ
ψ , with(am,bn)∈G, constitute a frame forL2(R)(the
space of all square integrable functions), with frame bounds A, B; that is, for allg∈L2(R)
∑
< > ≤ ≤n m
n
m B f
g f
A
,
2 2
,
2 | , | || ||
||
|| ψ (7)
where the symbols ‘<, >’ and ‘|| ||’ denote the inner product and the norm, respectively, following the ordinary definitions. The fact that ψm,n, whose parameters are restricted to a grid G, constitute a frame
forL2(R)can guarantee that for any g∈L2(R), there exits a sequence {cm,n:m,n∈Z}∈l2(Z2)(the set
of all double square summable sequences of complex numbers indexed by integers) such that
∑∑
=
m n
n m n
m x
c x
g( ) ,ψ , ( ) (8)
A special choice of the grid G is to letam=a0m,bn=nb0a0m, witha0>1, b0>0. Daubechies (1992)
gave a theoretical approach for calculating the wavelet coefficients cm,n in (8). For some very special
choices of ψ and G, the family ψm,n can constitute an orthogonal basis for ( )
2 R
L . The most popular
choice is a0=2, b0=1, for which there exists ψ , with good time-frequency localisation properties,
such that ψm,n(x)=2−m/2ψ(2−mx−n) constitute an orthogonal basis forL2(R).
Notice that this study considers nonlinear spatio-temporal dynamical modeling problems, where relative observations are often sparse and where the independent (input) variables involved in the
dynamical model are often formed by some variables representing the past states in time and at different spatial locations. This is different from a typical signal decomposition, where a given signal is represented using a static model formed by some wavelet-based elementary building blocks. For
nonlinear dynamical modeling, the choice a0=2andb0 =1 may not usually be optimal. In fact, the
choices of optimal values fora0andb0are still an open problem when wavelet decompositions are used
3.2 The new GAMWM
Generalised additive models (GAMs) (Stone 1985, 1986, Buja et al. 1989, Hastie and Tibshirani 1990) provide an efficient approach for dealing with data fitting problems in some high dimensional space. GAMs can not only avoid the curse of dimensionality, but also provide the ability to detect nonlinear dynamics and nonlinear patterns, without sacrificing interpretability of the relevant component functions. A general representation of GAMs for a d-dimensional function f of the form (5) is given as
)) ( , ), ( ), ( ( )
(t f x1 t x2 t x t
y = L d
)) ( ( ))
( ( )) (
( 1 2 2
1
0 f x t f x t f x t
f + + + + d d
= L (9)
where f0 is a constant, generally set to be the mean value of the desired ‘output’ signal y(t), and fi(⋅)
are some univariate nonlinear functions that need to be identified. In practice, several specific functions, including splines and wavelets, have been introduced as the elementary building blocks to construct GAMs (Aerts et al. 2002, Ruppert et al. 2003, Wood 2004, Billings and Wei 2005, Wei and Billings 2006b).
In this study, wavelet frames will be adopted to represent these d functional componentsfi(⋅) for
i=1,2, …, d. It is assumed that these d functional components are square-integrable over the domain
of interest for given data sets. Also, the constant term f0 can be set to zero and thus can be omitted. If
the constant term is different from zero for a given system, it can then be assimilated by one or more of the d functional components, which are approximated using multiscale wavelet decompositions.
While the wavelet decomposition (8), where the dilation and translation parameters amandbnare
predetermined and constricted to a grid G, can be applied to identify a generalised model (9) for some low dimensional identification problems (d is small), for very high dimensional identification problems (d is large), the employment of (8) may be undesirable and the resultant model may become intractable, because now the model may involve a large number of candidate wavelet basis functions, and data arranging and data storage for such a situation may become prohibited.
An alternative to overcome the above difficulty is to approximate each of the d functional components, using an adaptive wavelet decomposition, where the dilation and translation parameters are estimated by means of nonlinear optimisation. For simplicity of description, the balance
factora−1/2in (6) will be dropped, and the family of wavelets of the form
) ( ) , ; ( ) (
) , (
b ax b
a x x
b
a =ψ =ψ −
ψ (10)
will be used as the elementary building blocks to approximate the ith functional component fi(⋅) as
∑
=
= mi k
k i k i i k i i
i x t c x t a b
f
1
, , , ( (); , ) ))
(
where the parameters ai,k,bi,k,ci,kare estimated, from given data, using some nonlinear optimisation
algorithm. The model (9) can now be written as
)) ( , ), ( ), ( ( )
(t f x1 t x2 t x t
y = L d
∑∑
∑
= = =
=
= d
i m
k
k i k i i k i d
i i i
i
b a t x c t
x f
1 1
, , ,
1
) , ); ( ( ))
(
( ψ (12)
The generalised additive multiscale wavelet model (GAMWM) given by (12) will be used, in this study, to represent high dimensional STE systems. The remaining issue is how to construct, from given data, such an additive wavelet model.
4. Constructing the New GAMWM
Inspired by the successful applications of the projection pursuit regression (PPR) (Friedman and Stuetzle 1981) and other constructive learning algorithms (Fahlman and Lebiere 1990, Jones 1992, Hwang et al. 1994, Kwok and Yeung 1997a, 1997b, Reed and Marks 1999), this study proposes a simple orthogonal projection pursuit (OPP) learning scheme, implemented by a particle swarm optimisation (PSO) algorithm. Similar to other constructive algorithms, models produced by the OPP algorithm may, however, be redundant. To remove or reduce redundancy, a forward orthogonal regression (FOR) learning algorithm (Billings and Wei 2007a, Wei and Billings 2007), implemented using a mutual information estimation method, is applied to refine and improve the initially generated model by the OPP algorithm.
Note that in the following, the inner product is defined for sampled vectors in N-dimensional
Euclidian space, for example, the inner product of the two vectors u=[u(1),u(2),L ,u(N)]Tand
T N v v
v(1), (2), , ( )]
[ L
=
v is defined as <u,v>=uTv=
∑
kN=1u(k)v(k); this is different from that definedin (7), where the inner product is imposed to functions inL2(R).
4.1 The OPP algorithm for coarse model identification
The basic idea of the OPP algorithm for coarse model identification is to successively approximate the function f by progressively minimising approximation errors. At each step, the wavelet transform
(10) is performed on each of the d involved model variables{x1(t),x2(t),L ,xd(t)}, and the resultant
Let y=[y(1),y(2),...,y(N)]T∈RN be the vector of given observations of the output signal,
T k k
k
k =[x (1),x (2),L ,x (N)]
x the vector of the observations for the kth input variable, with k=1,2, …,
d. For any givenθ=[a,b,c]T, let ψk =ψ(xk;a,b) and g(xk;θ)=cψk.
The OPP algorithm is implemented in a stepwise fashion; at each step a construction vector that
minimises the projection error will be determined. Starting with r0=y , let
} || ) ; ( {|| min
arg 0 2
,
0 r g x θ
θ k
k = −
Θ and J0,k =||r0−g(xk;Θ0,k)||2. The first construction vector can then
be chosen as ( ; ) 1 1
1 g xl θl
g = , where 1 argmin{ 0,k}
k J
=
l and
k
k l
l =Θ0,
θ .The residual vector, which
can be used as the “fake desired target signal” to produce the second construction vectorg2, is defined
as r1=r0−α1g1, where
2 1 1 0
1=<r ,g >/||g ||
α . It can be shown that the residual vector r1is orthogonal
with the relevant construction vector g1.
Assume that at the (n-1)th step, a total of (n-1) construction vectors ( ; )
j j
j g xl θl
g = , with
j=1,2, …, n-1, have been obtained. Let rn−1 be the associated residual vector,
} || ) ; ( {|| min
arg 1 2
, r gx θ
θ n k
k
n = −
Θ − and Jn,k =||rn−1−g(xk;Θn,k)||2. The nth construction vector can
then be given by ( ; )
n n
n g xl θl
g = , where, argmin{ n,k}
k
n= J
l and
k k nl
l =Θ ,
θ .
The associated residual vector can be defined as
n n n
n r g
r = −1−α (13)
where 2 1 || || , n n n n g g r > < = −
α (14)
From (14), 2 2 1 2 1 2 || || , || || || || n n n n n g g r r
r = − −< − > (15)
By respectively summing (13) and (15) for n from 2 to m+1, yields
m m n n n n
n g r
g g r
y
∑
=
− > +
< = 1 2 1 || || , m m n n ng r
∑
= +
= 1
α (16)
∑
= − > < − = m n n n n m 1 2 2 1 2 2 || || , || || || || g g r yr (17)
ratio:ESR=||rn||2 ||y||2 ; when ESR becomes smaller than a pre-specified threshold value, the
growing procedure can then be terminated.
Now the OPP algorithm can briefly be summarised as follows. The OPP algorithm:
Initialisation: r0 =y; ESR=0;
while {ESR≥ηor n≤mPEM}; //{η is a pre-specified very small threshold value.}// //{mOPP is the maximum number of construction functions // permitted to be included in the network} //
for n=1 to mOPP for k=1 to d
//{Starting from some random (but reasonable) value for the // parameter vectorθ, optimise the following function using // the PSO algorithm.}//
{
2}
1
, argmin ||r g(x ;θ)||
θ n k
k
n = −
Θ − ;
2 , 1
,k || n ( k; nk)|| n
J = r− −gx Θ ;
end for (k) } { min arg n,k
k
n= J
l ;
n
n nl
l =Θ ,
θ ; ) ; ( n n
n g xl θl
g = ; // The involved wavelet is ( ; , ) ( )
n n n n
n
n a b a x b
xl l l =ψ l l − l
ψ // 2 1 || || , n n n n g g r > < = − α ; n n n
n r g
r = −1−α ;
2 2 || || || ||
ESR= rn y ; end for (n)
end while
It is clear from (15) that the sequence 2 ||
||rn is strictly decreasing and positive; thus, by following
the method given in Kwok and Yeung (1997b) and Huang et al. (2006), it can easily be proved that the
residual rnis a Cauchy sequence, and as a consequence, the residualrn converges to zero. The
the relevant object functions are not differentiable or the gradients are computationally expensive or difficult to obtain. However, like the projection pursuit regression and the matching pursuit algorithms, the OPP algorithm may produce redundant models. To refine and improve the OPP produced network models, the forward orthogonal regression (FOR) learning algorithm, assisted by a mutual information method (Billings and Wei 2007a), is then applied to remove any severe redundancy.
4.2 The PSO algorithm for parameter optimisation
Particle swarm optimisation (PSO), originally inspired by some sociological behaviour associated with, for example, bird flocking (Kennedy et al. 2001), is a population-based stochastic optimisation algorithm that was first proposed by Kennedy and Eberhart in 1995 (Kennedy and Eberhart 1995, Eberhart and Kennedy 1995). In PSO, the population is referred to as a swarm, while the individuals are referred to as particles; each particle moves, in the search space, with some random velocity, and remembers and retains the best position it has ever been. The mechanism of PSO can succinctly be explained as follows. The position of each particle can be viewed as a possible solution to a given optimization problem. In each iteration (one step move), each particle accelerates its move toward a new potential position, by adaptively using information about its own personal bestposition obtained so far, as well as the information of the global best position achieved so far by any other particles in the swarm. Thus, if any promising new position is discovered by any individual particle, then all the other particles will move closer towards it. In this way, PSO will finally find, in an iterative manner, a best solution to the given optimisation problem (Parsopoulos and Vrahatis 2004, van den Bergh and Engelbrecht 2004).
Now consider an s dimensional optimisation problem, where the relevant parameter vector to be
optimised is denoted by T s
s ∈Θ⊂R
=[θ1,θ2,L ,θ ]
θ . Assume that a total of L particles are involved in
the relevant swarm. Denote the position of the ith particle at the present time t by θi(t), the relative
velocity by vi(t), the personal best position by pi(t), and the global best position obtained so far by
) (t g
p . Following Kennedy et al. (2001), Shi and Eberhart (1998a, 1998b), Clerc and Kennedy (2002),
PSO can be implemented using the iterative equations below
)] ( ) ( [ ) ( { ) 1
(t i t c1r1 i t i t
i v p θ
v + =χ + − +c2r2[pg(t)−θi(t)]} (18a)
) 1 ( ) ( ) 1
(t+ = i t + i t+
i θ v
θ (18b)
where i=1,2, …, L; c1 and c2are the acceleration coefficients, also referred to as the cognitive and
social parameters; χ=2/|2−φ− φ2−4φ|, withφ=c1+c2>4, is a constriction factor used to
obtain good convergence performance by controlling explosive particle movements; r1 and r2are
random numbers that are uniformly distributed in [0,1]. Typical choices for c1 and c2 are to
Letπ(θ)be the function that needs to be minimised, then the personal best position of each particle
can be updated as below (van den Bergh and Engelbrecht 2004)
< + + ≥ + = + )) ( ( )) 1 ( ( if ), 1 ( )) ( ( )) 1 ( ( if ), ( ) 1 ( t t t t t t t i i i i i i i p θ θ p θ p p π π π π (19)
While the global best position achieved by any particle during all previous iterations is defined as
)) 1 ( ( min arg ) 1
(t+ = i t+
g
i
p p
p π , 1≤i≤L. (20)
In the OPP algorithm discussed in the previous section, the objective function is defined as
∑
= − − − = − = − N t k n k nn r t g x t
1
2 1
2 1
1(θ) ||r g(x ;θ)|| [ () ( ( );θ)]
π (21)
whereg(xk(t);θ)=θ3ψ(θ1x(t)−θ2) and N is the number of training samples.
With regard to the termination of the optimisation procedure, the criterion can be chosen as follows. Let ‘mPSO’ be the maximum number of permitted iterations. The optimization procedure can then be terminated when either the iteration index exceeds ‘mPSO’, or when the parameter to be
optimized becomes stable, that is, when ||θ(t+1)−θ(t)||2≤δ, whereδis a pre-specified small number,
say δ≤10−5.
4.3 The FOR algorithm for model refinement
Assume that a total of mjwavelets of the form ψj,k(xi)=ψ(xj;aj,k,bj,k)=ψ(aj,kxi−bj,k), with
k=1,2, …, mj, are involved for the jth ‘input’ variablexj, after having performed the PSO based OPP
procedure on the given data set. The number of involved wavelets for all the d variables is then
M=m1+m2+L +md. Denote the set of these M wavelets by
} ) , ( ), , ; ( ) ( :
{ , , = , , ∈Γ
=
Ω ψjk ψjk xj ψ xj ajk bjk j k (22)
whereΓ={(j,k): j=1,2,L ,d;k=1,2,L ,mj}. Note that all the parametersaj.k andbj,k have already
been estimated at the coarse model identification procedure. Experience shows that the set Ωmay be redundant, and a refinement procedure thus needs to be performed to produce a parsimonious model.
The objective of this refinement stage is to reselect the most significant wavelet functions from the
setΩ, to form a more compact model for a given nonlinear identification problem. Letyandxkbe
defined as in previous sections, and let ψj,k =ψ(xj;aj,k,bj,k), where (j,k)∈Γ. Also, let D be a set
that exactly consisting of the M wavelet vectorsψj,k in Ω, with (j,k)∈Γ, that is,
} , , 2 , 1 , :
{ i M
The model refinement problem amounts to finding, from the vector dictionary D, a full dimensional
subsetDm ={p1,L ,pm} { , , }
1 im
i φ
φ L
= , where
k
i
k φ
α = , ik∈{1,2,L ,M} and k=1,2, …, m (generally
M
m<< ), so that ycan be satisfactorily approximated using a linear combination of p1,p2,L ,pm as
below
m m mp e p
y=β1 1+L +β + (24)
where emis the associated model residual vector.
The orthogonal least squares (OLS) type algorithms (Billings et al. 1989, Chen et al. 1989) can be used to determine model basis functions (model terms). In this study, however, a variation of the OLS algorithm, called the forward orthogonal regression (FOR) algorithm, implemented using a mutual information method (Billings and Wei 2007a, Wei and Billings 2007), is employed for the model refinement. Assume that x and y are two random discrete variables, with alphabet X andY ,
respectively, and with a joint probability mass function p(x, y) and marginal probability mass functions )
(x
p andp(y). The mutual information I(x,y) is the relative entropy between the joint distribution
and the product distributionp(x)p(y), given as (Cover and Thomas 1991)
=
∑∑
∈ ∈ ( ) ( )
) , ( log ) , ( )
, (
y p x p
y x p y
x p I
x Xy Y
y
x (25)
The mutual informationI(x,y)is the reduction in the uncertainty of y due to the knowledge of x, and
vice versa. Mutual information provides a measure of the amount of information that one variable shares with another one. If y is chosen to be the system output (the response), and x is one regressor in a linear model, I(x,y)can then be used to measure the coherence of x with y in the model. Several
algorithms have been proposed to estimate mutual information from observed data, see for example Moddemeijer (1989, 1999), Darbellay and Vajda (1999), and Paninski (2003) and the references therein.
Detailed discussions on the utility of the mutual information for model term selection can be found
in Billings and Wei (2007a) and Wei and Billings (2007). Now, let p1,p2,L ,pnbe the n selected
linearly independent basis vectors after the nth step search, and letq1,q2,L ,qn be a group of
orthogonal vectors, generated from the vectors p1,p2,L ,pn , by means of some orthogonal
transformation. Following Billings et al. (1989), Chen et al. (1989), the error reduction ratio (ERR),
produced by including the nth basis vectorqn, or equivalently by including pn, is defined as
2 2 2
|| ||
|| || ERR
y qn n n
γ
whereγn=<y,qn >/||qn||2. ERR can be used to measure the significance of individual model terms
in that it provides an index indicating the contribution made by each selected individual model term to explain the total variance in the desired output signal.
Letenbe the residual vector produced at the nth search step. Similar to in the OPP algorithm, the
model residual vector encan be used to form a criterion to terminate the search procedure. Following
the suggestion in Billings and Wei (2007b), the following adjustable prediction error sum of squares (APRESS), also referred to as the adjustable generalised cross-validation (AGCV), will be used to monitor the regressor search procedure
) ( MSE ) / 1 (
APRESSn= −λn N 2 n (27)
whereMSE(n) || n|| /N 2
e
= is the mean-square-error that is associated to the model of n model terms.
The number of regressors (wavelet functions) will be chosen as the value where APRESS arrives it minimum. Billings and Wei (2007b) suggest that the adjustable parameterλ be chosen between 5 and 10.
Following Billings and Wei (2007a) and Wei and Billings (2007), the mutual information based forward orthogonal regression (FOR) algorithm, is briefly summarised below.
The FOR-MI algorithm:
Step 1: SetU1={1,2,L ,M}; for j=1 to M
j
j φ
q(1) = ;
I(1)[j]=MI(r0,q(j1)); // Calculate the mutual information for all // candidate basis vectors.//
end for
1 argmax{ (1)[]} 1 i I U i∈ =
l ; V1={l1};
1
1 φl
p = ; q1=p1; 2 1 1 1 || || , q q y > < =
γ ; r1=r0−γ0q1;
2 2 1 2 1 || || || || ] 1 [ ERR y q γ = ; N N 2 1 2 || || ) / 1 ( 1 ] 1 [ APRESS r λ − = ;
Step n, n≥2: Forn=2 to M
Un=Un−1\Vn−1;
for j∈Un
∑
− = > < − = 1 1 2 ) ( || || , n k k k k j j n j q q q φ φ q ;argmax{I(n)[j]} U j n n ∈ =
l ; ={ } {arg(|| ( )||2<ε)} ∈ n j U j n n n
V l U q ;
n
n φl
p = ; qn=q(lnn); 2
|| || , n n n q q y > < =
γ ; rn =rn−1−γnqn;
2 2 2 || || || || ] [ ERR y qn n
n =γ ;
N N n n n 2 2 || || ) / 1 ( 1 ] [ APRESS r λ − = ;
for k=1 to n
, 2 || || , k k n n k r q q p > <
= , fork<n; rk,n=1, fork=n;
end for (end loop for k ) end for (end loop for n )
The FOR algorithm provides an effective tool for successively selecting significant model terms (basis functions) in supervised learning problems. Terms are selected step by step, one term at a time. The inclusion of redundant bases, which are linearly dependent on the previous selected bases, can be
efficiently excluded by eliminating the candidate basis vectors for which ||q(jn)||2 are less than a
predetermined thresholdε, say ε≤10−10. Assume that a total of m significant vectors are selected,
then the unknown parameterβ=[β1,β2,L ,βm]T, relative to the model (24), can easily be calculated
from the triangular equation Rβ=γ , where R is an upper triangular matrix and
T m]
, , , [γ1γ2L γ
=
γ withγi=<y,qi>/||qi||2 for i=1,2,…, m.
5. Application in Chemical Reaction Modelling
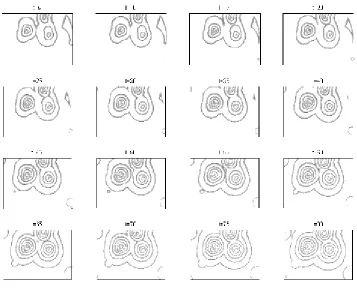
The new wavelet based additive modelling framework can be applied to identify some SPE phenomena, where the true models are unknown and the initial candidate models may thus involve a great number of ‘input’ or ‘independent’ variables. To illustrate the application of the new modelling procedure, the Belousov-Zhabotinsky (Belousov 1959, Zhabotinsky 1964, Winfree 1972, Kuramoto 1984) reaction was considered here as an example.
The BZ reaction, as an excitable medium, is an important class of chemical reactions exhibiting a spatio-temporal oscillatory behaviour. As a classical example of nonequilibrium thermodynamics, the BZ reaction provides an interesting chemical model of nonequilibrium biological phenomena, and the modelling and identification of these type of reactions is of extreme interest for theoretical analysis of relevant phenomena.
Fig. 1 Some snapshots for the BZ reaction at different time instants. The size of each template is 360×500(360 pixels in the vertical direction and 500 pixels in the horizontal direction).
The proposed GAMWM modelling framework was applied to these sampled images, and the objective was to identify a mathematical model for the BZ reaction. Details of the identification procedure are given below.
5.1 The initial models and the training data
Consider the model of the form (2), where the number of total model variables is determined by
two factors: the radius of the neighbourhood, r, and the time lag, nlag. Two cases were considered
here: r=1, nlag=4, and r=2, nlag=4. The initial models, corresponding to these two cases, thus involve
The state variablesi,j(t), at the present time instant t, was initially assumed to be associated with
state variables in the past four adjacent neighbourhoods at the previous time instants t-1, t-2, t-3, and t -4. Any five patterns, at the abutting time instants t, t-1, t-2, t-3, t-4, are called an adjacent pattern group. For arbitrary time instant, the data pair,{x(t),y(t)}, wherex(t)and y(t) are defined by (4) and (5), is
called a data pair. Notice that x(t)and y(t) are also implicitly associated with the spatial location
indices i and j (see Table 1). As a consequence, for any given time instant t, there may be a large number of data pairs.
Training data sets, for the two initial models, corresponding to the two cases r=1, nlag=4, and r=2,
lag
n =4, were independently formed as follows. Firstly, 8 adjacent pattern groups were randomly
chosen from the first 80 sampled patterns. Secondly, 500 data pairs were randomly chosen in each of these 8 adjacent pattern groups. The resultant two data sets, consisting of a total of N=4000 data pairs,
N k k y
k), ( )} 1,2,..., (
{x = , were then used for model identification, where y(k) represents the value of the
relevant central cell at the present time instant, and T
d k
x k x k x
k) [ ( ), ( ), , ( )]
( = 1 2 L
x represent the
values of the d involved cells at a squared lattice, at the previous time instants. Note that for the first case, d=36, and for the second case, d=100.
5.2 Identification results
The construction function was chosen to be the cardinal B-spline function of order 2, which is defined as
≤ ≤ −
≤ ≤ − +
=
otherwise.
, 0
1 0 for , 1
0 1 for , 1 )
( x x
x x
x
ψ (28)
Note that the function given by (28) is not a ‘wavelet’ in the strict sense. This function, as well as other cardinal B-splines, however, as an elementary component with several key wavelet properties, can be used to form a class of biorthogonal wavelet systems, which can be applied for signal representation including multiresolution analysis (MRA) (Unser et al. 1993, Chui 1992, Unser 1999).
The function (28) was used as the elementary building blocks for constructing the generalised additive multiscale wavelet models. All the experiment conditions involved in the modelling procedure are shown in Table 2. The error-to-signal ratio (ESR), produced by the OPP+PSO algorithm,
for the two modelling cases, that is, for r=1, nlag=4 and r=2, nlag=4, is shown in Fig. 2. A total of 200
construction functions of the form (10) were involved, for both of the two cases, after having performed the optimisation procedure on the associated data sets.
Table 2. Some conditions involved in the modelling for the identification of the BZ reaction.
Size of the arrays of cells 360×500
Number of model variables For the first case: 36. For the second case: 100.
mOPP in the OPP algorithm 200 η in the OPP algorithm 10-4
Swarm’s size in the PSO algorithm 20
c1, c2 in the PSO algorithm c1= c2=2.05 χ in the PSO algorithm 0.7298
mPSO in the PSO algorithm 500 δin the PSO algorithm 10-5 ε in the FOR algorithm 10-10 λ in the FOR algorithm 10
formψj,k =ψ(xj;aj,k,bj,k) , with j=1,2, …, d (d=36 or 100) and k=1,2, …, mj. Note that both the
dilation and translation parameters of the wavelets have already been optimised. The adjustable prediction error sum of squares (APRESS), defined by (27), suggests that a total of 26 and 22 wavelets should be included in the final models, respectively, for the two cases. The structure of the final models is of the form (12), and the parameters of the associated wavelets are shown in Tables 3 and 4, respectively, where the basis functions were ranked according to the order they have entered into the model. Notice that the symbolss(i,j;o), in the first column of Tables 3 and 4, have the same meanings
as those ofsi,j(o), representing the stave variables associated with the cells at the locations (i, j).
Fig. 2 The ESR index produced by the PSO based OPP algorithm. The solid line is for the first case r=1,
lag
Table 3. Model parameters and the associated mutual information and ERR values for the first case modeling, where r=1and nlag=4.
Parameter Cell
c a b
Mutual Information
ERR (%)
s(i, j; t-1) -0.1113613234 3.8408459941 2.8450837979 0.4225 11.4484
s(i, j; t-1) 0.0557852403 4.2996948717 3.2497767282 0.6439 1.6516
s(i, j-1; t-1) 1.7919585090 0.5078399143 0.9507093126 0.6496 86.5475
s(i, j-1; t-1) 0.1394020814 4.0337783748 3.1490571756 0.2555 0.0330
s(i, j-1; t-1) 0.0534835351 2.4148153204 1.4352719087 0.2852 0.0320
s(i, j-1; t-1) 0.2087648842 5.0744523011 2.7837964511 0.3465 0.0003
s(i, j; t-4) -0.0250904775 0.9499966382 -0.3344248874 0.3010 0.0101
s(i, j; t-3) 0.1290364751 3.3279581627 2.3296782012 0.2933 0.0088
s(i+1, j; t-1) -0.1724189094 1.1313358888 0.1327239467 0.2849 0.0227
s(i-1, j; t-1) -0.1181300168 1.1650008763 0.1647982765 0.2492 0.0473
s(i, j; t-3) -0.1059315572 3.1479703660 2.3208915380 0.3304 0.0034
s(i-1, j+1; t-1) -0.9535664802 1.1016170640 -0.1513421027 0.3027 0.0131
s(i, j; t-2) 0.2282715580 1.0233317306 0.0325486342 0.2610 0.0017
s(i-1, j+1; t-1) -0.1118315067 1.2314969328 0.2314266980 0.2680 0.0033
s(i+1, j-1; t-2) -0.0978967141 3.7570593203 2.571605679 0.2415 0.0004
s(i+1, j; t-1) -0.0180375003 13.1181416431 10.1035711418 0.2390 0.0001
s(i, j; t-4) 0.1478468955 1.1819682761 0.1847641348 0.2313 0.0026
s(i+1, j-1; t-2) 0.0585486243 4.5782269976 3.1362071320 0.2557 0.0003
s(i-1, j+1; t-1) 1.0128540478 0.8015637372 -0.3732090912 0.2574 0.0001
s(i+1, j+1; t-2) -0.0489460422 2.8986512223 1.9034078809 0.2378 0.0025
s(i, j+1; t-3) 0.0069154423 4.2272195966 2.8592631148 0.2060 0.0007
s(i, j-1; t-3) 0.0203976108 9.9551936231 6.8318100170 0.1986 0.0004
s(i-1, j-1; t-2) -0.0534139564 2.7418648560 1.6758961781 0.2039 0.0036
s(i, j+1; t-3) 0.0498998614 4.6110908548 2.8916749940 0.2002 0.0002
s(i-1, j+1; t-2) -0.0746461110 2.2972781915 1.3314358378 0.2075 0.0035
s(i+1, j+1; t-1) -0.2650697089 1.1203267338 -0.1289945838 0.2046 0.0026
Sum of ERR 99.8403%
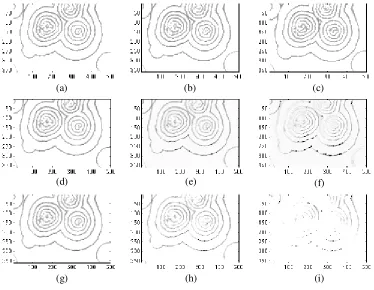
5.3 Model performance evaluation
To evaluate the performance of the identified additive wavelet models, the short-term predictive capability of the models was inspected. Denote the observation of the image (pattern) measured at the
time instant t by X(t). The k-step-ahead prediction, denoted by Xˆ(t+k|X(t),X(t−1),X(t−2),
) ); 3 (t f
X − , wheref represents the identified nonlinear function, is the iteratively produced result by
the identified model, on the basis of X(t), X(t-1), X(t-2) and X(t-3), but without using information on observations for patterns at any other time instants. As an example, the measurements at the time instants t=81, 82, 83, 84, were considered and used to calculate the 1-, 4-, and 8-step-ahead predictions, and these are shown in Fig. 3.
Table 4. Model parameters and the associated mutual information and ERR values for the second case modeling, where r=2and nlag=4.
Parameter Cell
c a b
Mutual Information
ERR (%)
s(i, j; t-1) 1.0000920021 1.2292201279 1.1692873968 0.4362 94.6567
s(i+1, j-1; t-1) 1.0961117713 0.2252175522 1.1795704565 0.3454 1.4067
s(i-1, j+2; t-2) -0.1443107728 2.3059178081 1.3076835666 0.2933 2.0007
s(i, j; t-1) -0.1171817131 3.0572377230 2.3400923504 0.3349 1.6040
s(i, j; t-2) 0.0110158450 4.4819903536 3.48612375230 0.3345 0.0047
s(i+1, j; t-3) 0.2349323434 1.7830321993 0.9173262355 0.2930 0.0515
s(i+1, j-1; t-2) 0.0047590764 7.6437365155 5.8012090756 0.3106 0.0001
s(i+1, j-1; t-2) -0.0077441796 8.1703845040 5.5222689564 0.3103 0.0028
s(i-2, j-1; t-1) -0.0374089268 3.8082029627 2.5280894175 0.2739 0.0022
s(i+2, j+1; t-1) -0.0886680186 2.8836245906 1.8770173153 0.2669 0.0167
s(i, j+2; t-2) -0.0280476559 5.8975582677 4.8570011044 0.2667 0.0016
s(i+1, j; t-3) -0.0955759272 2.5469787758 1.2902705475 0.2501 0.0040
s(i+2, j-1; t-2) -0.0654987697 2.3447767771 1.3473739411 0.2437 0.0034
s(i+2, j+1; t-3) 0.0123840401 2.4881153550 1.5489510183 0.2442 0.0029
s(i, j; t-1) 0.2500311636 2.5176213549 1.5514863164 0.2434 0.0227
s(i, j+2; t-4) 0.2463242832 0.4876748764 -0.5138555005 0.2276 0.0128
s(i, j+2; t-2) 0.0048319233 2.9458302335 1.9318118117 0.2323 0.0002
s(i-1, j+2; t-2) 0.0123733687 5.7636275247 4.7199405993 0.2391 0.0017
s(i-1, j; t-4) 0.0241436192 8.4533718197 5.5030465346 0.2319 0.0080
s(i-1, j-2; t-2) -0.1667885198 1.3174794458 0.3064101933 0.2129 0.0116
s(i-1, j; t-4) 0.0787648605 3.3853091789 2.2114094953 0.2294 0.0067
s(i-2, j-2; t-3) -0.0079349342 4.8920332394 3.8801885685 0.2204 0.0003
Sum of ERR 99.8224%
∑ ∑
∑ ∑
= =
= = −
= I
i J
j j i I
i J
j
k j i j i
t s
t s t s t
1 1
2 , 1 1
2 ) (
, ,
| ) ( |
| ) ( ˆ ) ( | )
(
NMSE (29)
wheresi,j(t) represent the observations at the time instant t, ˆ( )( ) , t
sikj represent the corresponding k
-step-ahead predicted values from a given model, and I and J define the size of the associated patterns. Starting with the observations at the time instants t=81, 82, 83, 84, the two identified models given in Tables 3 and 4 were used to calculate k-step-ahead predictions, for k=1,2, …, 10. The predicted values were then compared with the associated observations, corresponding to the time instants t=85, 86, …, 94, respectively. The associated normalised mean-square-errors, for the two models, are shown in Fig. 4.
(i)
(a) (b) (c)
(d) (e)
(g)
(f)
[image:24.612.118.492.100.390.2](h)
Fig. 3 The 1-, 4-, and 8-step-ahead predictions, based on the observations at the time instants t=81,82,83,84, for the BZ reaction. (a)-(c) True measurements at the time instants t=85, 89, and 94; (d)-(f) The 1-, 4-, and 8-step-ahead predicted results for (a), (b) and (c), respectively, using the model given in Table 3; (g)-(i) The 1-, 4-, and 8-step-ahead predicted results for (a), (b) and (c), respectively, using the model given in Table 4.
[image:24.612.183.420.481.662.2]6. Conclusions
Identification of spatio-temporal evolutionary (SEE) systems often involves a great number of ‘input’ variables, meaning that a very high dimensional modelling problem may have to be solved. To effectively solve such types of very high dimensional identification problems, a new family of wavelet based generalized additive multiscale models has been introduced. A novel two-stage hybrid learning method has been proposed for constructing such an additive multiscale model. The new learning algorithm produces a transparent model, where individual basis functions (model terms) are explicitly available.
By introducing the PSO algorithm, which is easy to implement, the calculation of gradients required by classical nonlinear optimisation algorithms can be avoided. This makes the new multiscale modelling framework very suitable for STE system identification, where relevant object functions may not be differentiable or relevant gradients are very difficult to obtain. By applying the mutual information based forward orthogonal regression (FOR) algorithm, the initially produced model by the PSO based orthogonal projection pursuit (OPP) learning algorithm, can significantly be refined and improved, and a parsimonious model containing only a small number of basis functions can then be obtained.
The proposed learning scheme and algorithms can also be applied in high dimensional pure temporal dynamical system identification including very high dimensional time series modelling and prediction. In addition, the proposed method may also be adapted to an alternative approach for neighbourhood detection of STE systems, as discussed in the example.
Acknowledgements
The authors gratefully acknowledge that this work was supported by Engineering and Physical Sciences Research Council (EPSRC), U.K. They gratefully acknowledge the help from Dr A. F. Routh who supervised and Dr Y. Zhao who conducted the B-Z experiments.
References
A. Adamatzky and V. Bronnikov, “Identification of additive cellular automata,” J. Comput. Syst. Sci., vol. 28, pp. 47–51, 1990.
A. Adamatzky, Identification of Cellular Automata. London: Taylor & Francis, 1994.
A. Adamatzky, “Automatic programming of cellular automata: Identification approach,” Kybernetes, vol.26, pp. 126–133, 1997.
M. Aerts, G. Claeskens, and M. P. Wand MP, “Some theory for penalized additive models,” J. Statist.