R E S E A R C H
Open Access
Leukemia cells induce changes in human bone
marrow stromal cells
Sara Civini
1, Ping Jin
1, Jiaqiang Ren
1, Marianna Sabatino
1, Luciano Castiello
1, Jianjian Jin
1, Huan Wang
1,
Yuanlong Zhao
1, Francesco Marincola
2,3and David Stroncek
1*Abstract
Background:Bone marrow stromal cells (BMSCs) are multipotent cells that support angiogenesis, wound healing, and immunomodulation. In the hematopoietic niche, they nurture hematopoietic cells, leukemia, tumors and metastasis. BMSCs secrete of a wide range of cytokines, growth factors and matrix proteins which contribute to the pro-tumorigenic marrow microenvironment. The inflammatory cytokines IFN-γand TNF-αchange the BMSC secretome and we hypothesized that factors produced by tumors or leukemia would also affect the BMSC secretome and investigated the interaction of leukemia cells with BMSCs.
Methods:BMSCs from healthy subjects were co-cultured with three myeloid leukemia cell lines (TF-1, TF-1αand K562) using a trans-well system. Following co-culture, the BMSCs and leukemia cells were analyzed by global gene expression analysis and culture supernatants were analyzed for protein expression. As a control, CD34+ cells were also cocultured with BMSCs.
Results:Co-culture induced leukemia cell gene expression changes in stem cell pluripotency, TGF-βsignaling and carcinoma signaling pathways. BMSCs co-cultured with leukemia cells up-regulated a number of proinflammatory genes including IL-17 signaling-related genes and IL-8 and CCL2 levels were increased in co-culture supernatants. In contrast, purine metabolism, mTOR signaling and EIF2 signaling pathways genes were up-regulated in BMSCs co-cultured with CD34+ cells.
Conclusions:BMSCs react to the presence of leukemia cells undergoing changes in the cytokine and chemokine secretion profiles. Thus, BMSCs and leukemia cells both contribute to the creation of a competitive niche more favorable for leukemia stem cells.
Keywords:Bone marrow stromal cells (BMSCs), Leukemia, Tumor microenvironment, Hematopoietic niche
Background
Acute myeloid leukemia (AML) is a clonal, malignant disorder. Treatment of AML is often complicated by dis-ease propagation and relapse due to a small subset of cells called leukemia stem cells (LSC). LSC show a less mature phenotype compared with leukemia cells and they display a constitutive activation of factors such as NF-κB, Akt, and Wnt/β-Catenin which are involved in survival and self-renewal [1-3]. Leukemia stem cells are a heterogeneous population, which were first found among CD34+CD38-populations, but they are also present among
CD34+CD38+and CD34-cells [4]. Normal hematopoietic stem cells and LSCs reveal a high degree of similarity and although LSCs show increased expression of CD44, CD96, CD47 and the loss of CD90 expression, no unique LSC marker has yet been found [5-9].
In the hematopoietic niche, LSCs interact with bone marrow stromal cells (BMSCs) to create a microenviron-ment that is favorable for LSC survival [10,11]. The interac-tions between leukemia cells and the niche encompass membrane receptors and soluble factors. These factors in-clude CXCR4/CXCL12 (SDF-1) signaling, which is involved in the homing, survival, and proliferation of leukemia cells in AML [12,13] and chronic myeloid leukemia (CML) [14]. It is also important to note that CD44 and VLA-4 receptors expressed by leukemia cells play a role in their adhesion to
* Correspondence:[email protected]
1Cell Processing Section, Department of Transfusion Medicine, Clinical
Center, National Institutes of Health (NIH), Building 10, Room 3C720, 9000 Rockville Pike, Bethesda, MD 20892-1184, USA
Full list of author information is available at the end of the article
stromal cells in the niche and the consequent induction of anti-apoptotic effects that support leukemia cell survival [15,16].
BMSCs, which are also known as mesenchymal stromal cells or mesenchymal stem cells, are a multipotent popu-lation that plays an active role in the hematopoietic niche. They maintain hematopoietic stem cells (HSCs) dormant within the niche and they play a role in the release of acti-vated HSCs [17-24]. These cells secrete a wide range of cytokines, growth factors and matrix proteins involved in the hematopoiesis and hematopoietic stem cells mainten-ance [25-30].
It has been shown that in chronic lymphocytic leukemia (CLL), BMSCs through cysteine-cysteine metabolism pro-vide leukemia cells with the antioxidant species (GSH) and promote cell survival in oxidative stress conditions [31,32]. In multiple myeloma, BMSCs up-regulate the se-cretion of several factors (IL-6, IGF-1, VEGF, FGF, SDF-1 and TNFα) as a result of their direct interaction with mye-loma cells through integrins and soluble factors produced by myeloma cells. This interaction of myeloma cells and BMSCs in turn promotes a pro-tumorigenic environment in which the survival, growth and drug resistance of mul-tiple myeloma cells is guaranteed [33-35].
To further understand the interaction between BMSCs and leukemia stem cells in the bone marrow microenvir-onment, we selected three myeloid leukemia cell lines with different degrees of stemness and co-cultured them with BMSCs from healthy donors. We found that BMSCs responded to leukemia cells by up-regulating many pro-inflammatory and IL17-signaling related genes.
Methods
Study design
BMSCs from healthy donors were co-cultured with three different myeloid leukemia cell lines. AML cell lines TF-1 and TF-1α were selected because of their phenotype: CD34+/CD38+and CD34+/CD38-, respectively; the TF-1α phenotype being less mature than the TF-1 phenotype. We also selected K562, a CD34- chronic myeloid leukemia cell line, as a third cell line of bone marrow origin. A 1-μm Transwell system (BD Biosciences, San Jose’, CA USA) was used to maintain the cultured BMSC and leukemia cell populations separate from each other. BMSCs were also co-cultured under the same conditions with CD34+ cells isolated from G-CSF-mobilized peripheral blood stem cells from healthy donors BMSCs, leukemia and CD34+ cells cultured alone (mono-cultures) were used as con-trols. Cells from both mono- and co-culture conditions were harvested at 4 h, 10 h, and 24 h. Supernatants were harvested at 48 h. Cells were analyzed for global gene expression profiles, culture media for selected cytokines and chemokines. These studies were approved by a NIH Institution Review Board.
Bone marrow stromal cells, leukemia cell lines and hematopoietic stem cells
Passage 2 BMSCs from 4 healthy donor bone marrow aspirates were provided by the Bone Marrow Stromal Cell Transplant Center, NIH, Bethesda, Maryland. BMSCs were expanded and characterized as described in our previ-ous work [29,36]. Briefly, cells from bone marrow aspirates were seeded in complete media (α−minimal essential medium (α-MEM), 2 mM glutamine, 10μg/ml gentamicin and 20% fetal bovine serum) for 24 h, and the non-adherent cells were removed. The non-adherent cells were ex-panded until a 70-80% confluence was reached. Cells were sub-cultured until passage 4 and kept in complete media.
Leukemia cell lines were purchased from ATCC: TF-1 (#CRL2003) CD34+/CD38+, TF-1α (ATCC #CRL2451) CD34+/CD38- and K562 (ATCC #CCL243) CD34-. The TF-1αand K562 cells were maintained in RPMI with 10% FBS. TF-1 cells were kept in RPMI with 10% FBS and 2 ng/μl of GM-CSF until use in co-culture experiments.
Human CD34+ hematopoietic stem cells from three different healthy donors were kindly provided by Dr J. Miller (NIH-NIDDK). Peripheral blood stem cells (PBSC) were collected by apheresis after 5 days of stimulation with G-CSF and CD34+ cells isolated from the PBSCs using CD34 antibodies conjugated to paramagnetic beads (Clin-icMACS, Miltenyi Biotec Inc, Auburn, CA USA).
Co-culture
Passage 4 BMSCs were seeded in the 6-well plates at a concentration of 5×10⁴cells/well, in RPMI plus 10% FBS on day−1. At day 0, 1×10⁶TF-1, TF-1α, K562 and CD34+ cells were seeded into the Transwell system. Mono-cultures of BMSCs, leukemia and CD34+cells were seeded at the same above mentioned conditions as controls. Cells were harvested after 4 h, 10 h and 24 h, treated with 700 μl QIAzol (Qiagen, Valencia, CA USA) and were stored at −80°C until use. Supernatants collected after 48 h were stored immediately at−80°C. For some studies 1×10⁶of the TF-1, TF-1α or K562 cells were cultured in direct contact with passage 4 BMSCs in 6 well plates.
Total RNA purification, amplification, hybridization and slide processing
Total RNA from co-culture and control samples was purified using miRNA Easy Kit (Qiagen). The RNA con-centration was measured using a Nano Drop ND-1000 Spectrophotometer (Nano Drop Technologies, Wilming-ton, DE, USA) and RNA quality was assessed with an Agilent 2100 Bioanalyzer (Agilent Technologies, Santa Clara, CA, USA).
Human genome, 4x44k slides according to manufacturer’s protocol.
Statistical and microarray data analysis
Images of the arrays were acquired using a microarray scanner Scan G2505B and image analysis was performed using Scan Control software version 9.5 (Agilent Tech-nologies). The images were extracted using the Feature Extraction Software (Agilent Technologies). Partek Gen-omic Suite 6.4 (Partek Inc., St. Louis, MO, USA) was used for data analysis, visualization, identification of dif-ferentially expressed transcripts (unadjusted p-value < 0.05) and hierarchical cluster analysis. Ingenuity Pathway Analysis website (http://www.ingenuity.com, Ingenuity System Inc., Redwood City, CA, USA) was used for ana-lysis of functional pathways. The microarray data used in this study have been deposited in National Center for Biotechnology Information Gene Expression Omnibus database (GSE45663).
Quantitative real-time PCR analysis
To validate the results of the microarray analysis, we per-formed quantitative real-time PCR (RT-PCR) analysis on total RNA from co-cultures and controls using 18S rRNA as a housekeeping gene (Assay ID Hs99999901_s1, Applied Biosystem-Life Technologies). Genes used for validation were selected from those most up-regulated in co-cultured cells compared to mono-culture controls:IL8, CCL2, ICA
M1and IL1B. Gene expression data were quantified with TaqMan Gene Expression Assay for each of the above mentioned genes (Assay IDs: Hs99999034_m1, Hs00234 140_m1, Hs00164932_m1, Hs01555410_m1, respectively, Life Technologies), according to manufacturer’s protocol. For each sample, relative gene expression level was nor-malized to 18S rRNA and determined by the 2-ΔΔCt method. The reaction was performed using ABI Prism (BD Biosystem, Life Technologies). The resulting data were an-alyzed by SDS and RQ software (Applied Biosystem). The results were shown as the relative co-culture mRNA level to mono-culture control mRNA for the selected genes.
Proteome profiles (Human Cytokine Array Panel A array kit)
Supernatants collected from co-cultured and control cells, after 48 h of culture, were thawed and immediately ana-lyzed using the Human Cytokine Array Panel A array Kit (R&D System, Inc., Minneapolis, MN USA) following the manufacturer’s protocol. Briefly, 1 ml of supernatant was incubated for 1 h with 15μl of human cytokine detection antibody cocktail. The suspension was incubated with the provided membrane at 4°C for 30 h and treated with the secondary antibody (Streptavidin-HRP) for 1 h at room temperature. The membrane was exposed to chemilumin-escence reagents SuperSignal West Pico Chemilumines-cent Substrate (Thermo Scientific, Rockford, IL, USA).
After exposing the membranes for 30 min to X-ray film, the resulting film was scanned and the pixels were counted and analyzed with ImageJ software (CIT, NIH USA). The mean pixel density for each spot was calculated by background subtraction and each value was normalized by internal positive controls. Each sample was tested in duplicate.
ELISA analysis
Levels of IL-8, and CCL2 in the supernatants from mono and co-cultured samples were measured with enzyme-linked immune adsorbent assays (Quantikine human kits; R&D System) following the manufacturer’s instructions using Victor3V ELISA reader (Perkin Elmer, Waltham, MA, USA). Minimal detectable levels were: IL-8, 3.5 pg/ml and CCL2, 1.7 pg/ml.
Results
Global gene expression analysis of BMSCs co-cultured with leukemia cells reveals up-regulation of IL-17 signaling-related genes
To study the effects of leukemia cells on BMSCs, we co-cultured BMSCs from healthy donors with three differ-ent leukemia cell lines, TF-1α, TF-1 and K562, that were selected according to their phenotypes: CD34+/CD38-, CD34+/CD38+and CD34-, respectively. The BMSCs and leukemia cells were co-cultured in transwells without physic contact. The cells were harvested at 4 h, 10 h and 24 h and total RNA was extracted. The gene expression profiles of BMSC mono-cultures and BMSCs co-cultured with the three leukemia cell lines were analyzed.
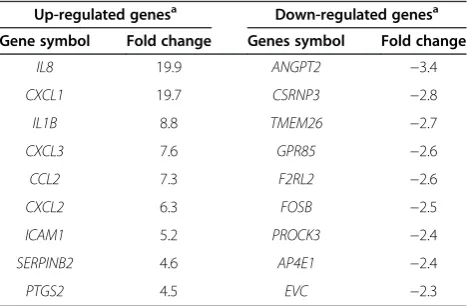
The overall comparison between mono- and co-culture BMSCs revealed that 1540 BMSC genes were differentially expressed (p-value <0.05). Supervised hierarchical cluster-ing analysis of those genes clearly separated the BMSC samples into two groups: co-cultured and mono-cultured BMSCs (Figure 1A). We found that IL8, CXCL1, IL1B,
CXCL3, CCL2, CXCL3, CXCL2 and ICAM1genes, all of which are known to be involved in the acute inflammatory response, were the most up-regulated genes in BMSCs co-cultured with leukemia cells (Table 1). Ingenuity Pathway Analysis (IPA) of the differentially expressed genes re-vealed that the most over-represented canonical pathways were the IL-17 signaling, CD40 signaling and NFκB signal-ing pathways (Figure 1B). We also compared the micro-array data from the different time points and we found that most of the changes in the BMSC gene expression profiles occurred within 4 h (data not shown).
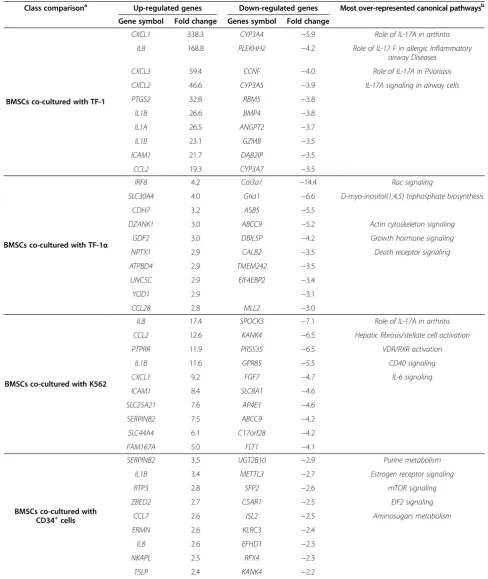
Partek Genomic Suite, we found that the number of differ-entially expressed genes in BMSCs co-cultured with TF-1, TF-1α and K562 compared with BMSC mono-cultures were 1775, 1375 and 1738 respectively. The genes IL8,
CCL2, CXCL1, IL1BandICAM1were among the most up-regulated genes in BMSCs co-cultured with both TF-1 and K562 although with significantly different fold changes (Table 2). In contrast, analysis of BMSCs co-cultured with TF-1α revealed a different signature with a mild up-regulation ofIRF8andCADHERIN7and a down-regulation ofCOL3A1(Table 2). Ingenuity pathway analysis of the three separate sets of BMSC differentially expressed genes revealed that the top canonical pathways involved were IL-17 signal-ing, CD40 signaling and IL-6 signaling in BMSCs co-cultured with TF-1 and K562, while Rac signaling, actin cytoskeleton signaling, growth hormone signaling and death
[image:4.595.57.540.89.427.2]B
A
Figure 1Gene expression analysis of BMSCs co-cultured with leukemia cells compared with BMSC mono-cultures shows changes in IL-17 signaling-related genes. (A)Hierarchical clustering analysis of 1540 differentially expressed genes in BMSCs co-cultured in transwells with three leukemia cell lines (TF-1, TF-1αand K562) compared with BMSC mono-cultures (control) using Partek Genomic Suite program (ANOVA test with unadjusted p-value < 0.05). The displayed colors represent the fold changes where shades of red and blue indicate up- and down-regulation respectively. The color key for the sample labels is on the top left.(B)Ingenuity Pathway Analysis (IPA) of the 1540 differentially expressed BMSC genes. Numerical symbols at the right side of each bar indicate the total number of genes composing the pathway. The bars indicate the percentage of up- (red bar) and down-regulated (green bar) genes in each pathway, while the orange line indicates minus-log transformed p-value. The top 10 canonical pathways are shown.
Table 1 Change in expression of BMSC genes during co-culture with leukemia cells
Up-regulated genesa Down-regulated genesa
Gene symbol Fold change Genes symbol Fold change
IL8 19.9 ANGPT2 −3.4
CXCL1 19.7 CSRNP3 −2.8
IL1B 8.8 TMEM26 −2.7
CXCL3 7.6 GPR85 −2.6
CCL2 7.3 F2RL2 −2.6
CXCL2 6.3 FOSB −2.5
ICAM1 5.2 PROCK3 −2.4
SERPINB2 4.6 AP4E1 −2.4
PTGS2 4.5 EVC −2.3
a
[image:4.595.57.291.563.716.2]Table 2 Change in expression of BMSC genes during co-culture with 3 different leukemia cell lines and with CD34+cells
Class comparisona Up-regulated genes Down-regulated genes Most over-represented canonical pathwaysb
Gene symbol Fold change Genes symbol Fold change
BMSCs co-cultured with TF-1
CXCL1 338.3 CYP3A4 −5.9 Role of IL-17A in arthritis
IL8 168.8 PLEKHH2 −4.2 Role of IL-17 F in allergic Inflammatory
airway Diseases
CXCL3 59.4 CCNF −4.0 Role of IL-17A in Psioriasis
CXCL2 46.6 CYP3A5 −3.9 IL-17A signaling in airway cells
PTGS2 32.8 RBM5 −3.8
IL1B 26.6 BMP4 −3.8
IL1A 26.5 ANGPT2 −3.7
IL1B 23.1 GZMB −3.5
ICAM1 21.7 DAB2IP −3.5
CCL2 19.3 CYP3A7 −3.5
BMSCs co-cultured with TF-1α
IRF8 4.2 Col3a1 −14.4 Rac signaling
SLC30A4 4.0 Gria1 −6.6 D-myo-inositol(1,4,5) triphosphate biosynthesis
CDH7 3.2 ASB5 −5.5
DZANK1 3.0 ABCC9 −5.2 Actin cytoskeleton signaling
GDF2 3.0 DBIL5P −4.2 Growth hormone signaling
NPTX1 2.9 CALB2 −3.5 Death receptor signaling
ATPBD4 2.9 TMEM242 −3.5
UNC5C 2.9 EIF4EBP2 −3.4
YOD1 2.9 −3.1
CCL28 2.8 MLL2 −3.0
BMSCs co-cultured with K562
IL8 17.4 SPOCK3 −7.1 Role of IL-17A in arthritis
CCL2 12.6 KANK4 −6.5 Hepatic fibrosis/stellate cell activation
PTPRR 11.9 PRSS35 −6.5 VDR/RXR activation
IL1B 11.6 GPR85 −5.5 CD40 signaling
CXCL1 9.2 FGF7 −4.7 IL-6 signaling
ICAM1 8.4 SLC8A1 −4.6
SLC25A21 7.6 AP4E1 −4.6
SERPINB2 7.5 ABCC9 −4.2
SLC44A4 6.1 C17orf28 −4.2
FAM167A 5.0 FLT1 −4.1
BMSCs co-cultured with CD34+cells
SERPINB2 3.5 UGT2B10 −2.9 Purine metabolism
IL1B 3.4 METTL3 −2.7 Estrogen receptor signaling
RTP3 2.8 SFP2 −2.6 mTOR signaling
ZBED2 2.7 C5AR1 −2.5 EIF2 signaling
CCL7 2.6 ISL2 −2.5 Aminosugars metabolism
ERMN 2.6 KLRC3 −2.4
IL8 2.6 EFHD1 −2.3
NKAPL 2.5 RFX4 −2.3
TSLP 2.4 KANK4 −2.2
a
Comparison of co-cultured and mono-cultured BMSCs (p-value <0.05). b
Ingenuity pathway analysis (IPA).
receptor signaling were among the most over-represented canonical pathways in BMSC co-cultured with TF-1α (Table 2).
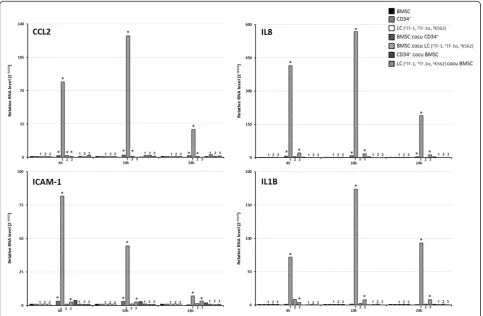
To validate the microarray data, we performed quanti-tative RT-PCR analysis. The RT-PCR results confirmed the greater expression ofCCL2, ICAM1, IL8andIL1Bin BMSCs co-cultured with leukemia cells compared with BMSC mono-cultures (Figure 2).
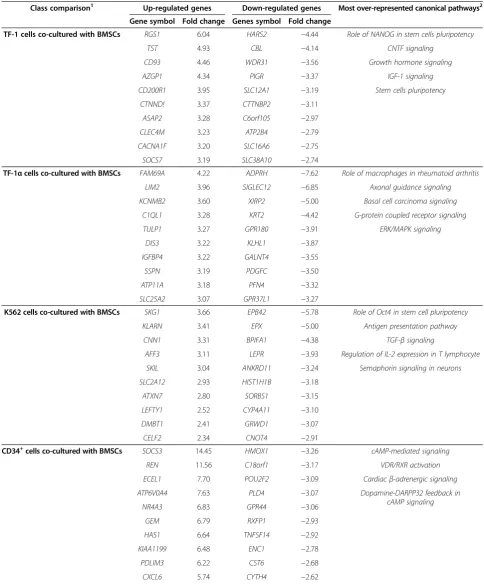
To study the effects of BMSCs on leukemia cells, the gene expression profiles of TF-1, TF-1α and K562 leu-kemia cells alone and co-cultured with BMSCs were ana-lyzed by microarrays. The microarray data were anaana-lyzed using Partek Genomic Suite and the analysis revealed that 1138, 1119 and 943 genes were differentially expressed (p-value <0.05) in TF-1, TF-1αand K562 cells co-cultured with BMSCs compared with the respective leukemia cell mono-cultures. Among the most up-regulated genes were
RGS1, FAM69A, Skg1 and SOCSs, although their fold change in expression was <7. Ingenuity pathway analysis (IPA) of the differentially expressed genes revealed that
the most represented canonical pathways were stem cells pluripotency, TGF-β signaling and carcinoma signaling (Table 3).
[image:6.595.57.541.362.678.2]Next, we studied the effects of leukemia cells on BMSCs co-cultured in direct contact. BMSCs from three healthy donors were co-cultured with the three different leukemia cell lines in direct contact. The cells were har-vested at 4 h, 10 h and 24 h and total RNA was ex-tracted. The total RNA from BMSC mono-cultures was mixed with the total RNA from TF-1, TF-1αor K562 cell mono-cultures and the resulting three mixed total RNA samples were used as a“mono-culture”control in the gene expression profiling analysis. The RNA from BMSCs co-cultured with the TF-1, TF-1a and K562 cells were ex-tracted and the gene expression profiles were analyzed by microarrays. The analysis of microarray data using Partek Genomic Suite revealed that 544 genes were differentially expressed between co-cultured and mono-cultured control cells (p-value <0.05, FDR <0.01). Hierarchical clustering analysis of these genes clearly separated the samples into
Figure 2The expression of IL-17 signaling-related genes increase in BMSCs co-cultured with leukemia cells.Quantitative RT-PCR was performed to quantify the expression levels ofCCL2,ICAM1,IL8andIL1Bin BMSCs (black column), CD34+ cells (grey bars) and TF-1 (1), TF-1a(2) and K562(3) leukemia cell (LC) (white bars) mono-cultures, BMSCs co-cultured in transwells with leukemia cell lines (black and white stripped column) and BMSCs co-cultured in transwells with CD34+ cells (grey and black stripped column). The RNA levels were shown as 2-ΔΔCtmethod.
Table 3 Change in expression of leukemia and CD34+cell genes during co-cultured with BMSCs
Class comparison1 Up-regulated genes Down-regulated genes Most over-represented canonical pathways2
Gene symbol Fold change Genes symbol Fold change
TF-1 cells co-cultured with BMSCs RGS1 6.04 HARS2 −4.44 Role of NANOG in stem cells pluripotency
TST 4.93 CBL −4.14 CNTF signaling
CD93 4.46 WDR31 −3.56 Growth hormone signaling
AZGP1 4.34 PIGR −3.37 IGF-1 signaling
CD200R1 3.95 SLC12A1 −3.19 Stem cells pluripotency
CTNND! 3.37 CTTNBP2 −3.11
ASAP2 3.28 C6orf105 −2.97
CLEC4M 3.23 ATP2B4 −2.79
CACNA1F 3.20 SLC16A6 −2.75
SOCS7 3.19 SLC38A10 −2.74
TF-1αcells co-cultured with BMSCs FAM69A 4.22 ADPRH −7.62 Role of macrophages in rheumatoid arthritis
LIM2 3.96 SIGLEC12 −6.85 Axonal guidance signaling
KCNMB2 3.60 XIRP2 −5.00 Basal cell carcinoma signaling
C1QL1 3.28 KRT2 −4.42 G-protein coupled receptor signaling
TULP1 3.27 GPR180 −3.91 ERK/MAPK signaling
DIS3 3.22 KLHL1 −3.87
IGFBP4 3.22 GALNT4 −3.55
SSPN 3.19 PDGFC −3.50
ATP11A 3.18 PFN4 −3.32
SLC25A2 3.07 GPR37L1 −3.27
K562 cells co-cultured with BMSCs SKG1 3.66 EPB42 −5.78 Role of Oct4 in stem cell pluripotency
KLARN 3.41 EPX −5.00 Antigen presentation pathway
CNN1 3.31 BPIFA1 −4.38 TGF-βsignaling
AFF3 3.11 LEPR −3.93 Regulation of IL-2 expression in T lymphocyte
SKIL 3.04 ANKRD11 −3.24 Semaphorin signaling in neurons
SLC2A12 2.93 HIST1H1B −3.18
ATXN7 2.80 SORBS1 −3.15
LEFTY1 2.52 CYP4A11 −3.10
DMBT1 2.41 GRWD1 −3.07
CELF2 2.34 CNOT4 −2.91
CD34+cells co-cultured with BMSCs SOCS3 14.45 HMOX1 −3.26 cAMP-mediated signaling
REN 11.56 C18orf1 −3.17 VDR/RXR activation
ECEL1 7.70 POU2F2 −3.09 Cardiacβ-adrenergic signaling
ATP6V0A4 7.63 PLD4 −3.07 Dopamine-DARPP32 feedback in
cAMP signaling
NR4A3 6.83 GPR44 −3.06
GEM 6.79 RXFP1 −2.93
HAS1 6.64 TNFSF14 −2.92
KIAA1199 6.48 ENC1 −2.78
PDLIM3 6.22 CST6 −2.68
CXCL6 5.74 CYTH4 −2.62
1
Comparison of leukemia or CD34+ cells co-cultured with BMSCs compared with mono-cultured leukemia or CD34+ cells (p-value < 0.05, FDR < 0.01). 2
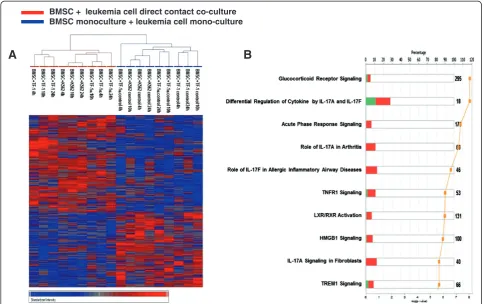
two groups: co-cultures and mono-cultures (Figure 3A). The results were similar to the analysis of BMSCs co-cultured in transwells with the leukemia cells. We found that CXCL1, CXCL6,TEP1, IL8, CCL2 and PTGS2 genes were the most up-regulated genes in BMSCs co-cultured in the direct contact with leukemia cells. Ingenuity Path-way Analysis of the differentially expressed genes revealed that the top canonical pathways involved were the gluco-corticoid receptor signaling, IL-17 signaling and acute phase response signaling (Figure 3B).
Gene expression analysis of BMSCs co-cultured with CD34+ cells revealed changes in metabolism related genes
To evaluate whether the observed BMSC gene induction was specifically induced by leukemia cells, BMSCs were co-cultured in transwells with CD34+cells from healthy
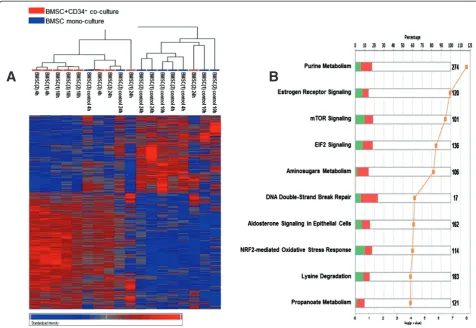
donors.The BMSCs were harvested at 4 h, 10 h and 24 h and total RNA was extracted. The gene expres-sion profiles of BMSC mono-cultures and co-cultured with the CD34+ cells were analyzed by microarrays. Analysis of the microarray data revealed that 4904 genes were differentially expressed between the two groups (p-value <0.05). Hierarchical clustering analysis of those genes separated the BMSCs into two groups but the separation between co-cultured and mono-cultured cells was not perfect. One group consisted of 8 co-cultured samples and 2 mono-cultures; the sec-ond group consisted of 7 mono-cultured samples and 1 co-cultured sample (Figure 4A). We found that the most up-regulated genes in BMSCs co-cultured with CD34+ cells compared with BMSC mono-cultures were SERPINB2, IL1B, RTP3, CCL7 and IL8 (Table 2).
A
BMSC + leukemia cell direct contact co-culture BMSC monoculture + leukemia cell mono-culture
[image:8.595.56.541.89.393.2]B
Ingenuity pathway analysis (IPA) revealed that the top ca-nonical pathways involved were the purine metabolism, mTOR signaling and EIF2 signaling (Figure 4B). To valid-ate the microarrays data, we performed a quantitative RT-PCR analysis which confirmed the greater expression of
IL8 in BMSCs co-cultured with CD34+ cells compared with BMSC mono-cultures (Figure 2).
Similarly to what was done with the leukemia cell lines, to study the effects of BMSCs on CD34+ cells, gene ex-pression profiles from CD34+cell mono-cultures and co-cultures with BMSCs were analyzed by microarrays. We found that 2075 genes were differentially expressed (p-value <0.05) in CD34+ cell co-cultures compared with mono-cultures. Among the most up-regulated genes were
SOCS3, RENandCXCL6; all with a fold change >5. Ingenu-ity pathway analysis of the differentially expressed genes re-vealed that the most represented canonical pathways were
cAMP-mediated signaling, VDR/RXR activation and car-diacβ-adrenergic signaling (Table 3).
CCL2 and IL-8 are increased in supernatants from BMSCs co-cultured with leukemia cells
Gene expression analysis revealed that most of the genes up-regulated in BMSCs co-cultured with leukemia cells were involved in IL-17 signaling. To assess the factors produced by co-cultured cells, we screened the superna-tants from co-culture and mono-culture samples at 48 h for cytokine production by R&D Human Cytokine panel A. We chose this panel because among the 36 cytokines in the panel were CXCL1, sICAM-1, IL-1B, IL-8, CCL2 and Serpin E1 all of which were found to be up-regulated at the gene level in co-cultured BMSCs. Moreover, with panel A we were able to measure the relative levels of IFNγ, IL-6 and IL-23 which are IL-17 signaling-related
[image:9.595.58.535.89.417.2]A
B
cytokines. However, most of the 36 cytokines in the panel were undetectable in our samples and the levels of cyto-kines CXCL1, ICAM-1, IL-23, IL-6, MIF and Serpin E1 were not significantly changed between co-culture and mono-culture conditions (data not shown). However, the levels of CCL2 and IL-8 were greater in supernatants from BMSCs co-cultured with leukemia cells (Figure 5), but the results were variable among BMSCs from different subjects. The levels of IFNγ and CD40L were greater in co-culture compared with mono-culture supernatants, but the differ-ence was not statistically significant. The analysis of cyto-kines in the supernatant of cultured BMSCs and leukemia cells was performed in three series of experiments with BMSCs from three healthy donors, (BMSC002, BMSC003 and BMSC006) and we found different responses among the different BMSC donors. We found increased levels of
IFNγand CD40L only in the supernatants from BMSC003 co-cultured with TF-1 and TF1α. The levels of IL-8 were increased in the supernatants from BMSC003, BMSC006 and, to a lesser extent, in BMSC002. The level of CCL2 was measurable only in supernatants from BMSC003, BMSC002 and BMSC006 co-cultured with TF-1 and K562 leukemia cells and in the supernatant from BMSC006 co-cultured with TF-1α(Figure 6).
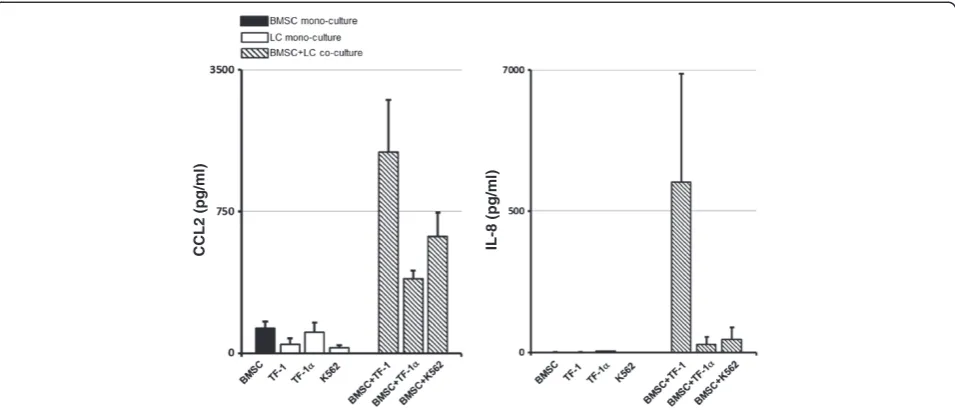
To confirm the increased levels of CCL2 and IL-8 in the supernatants from BMSCs co-cultured with leukemia cells at 48 h, we measured the levels of the two cytokines using ELISA assays. We co-cultured BMSCs from 3 different healthy donors with TF-1, TF-1αand K562 leukemia cells and harvested the supernatants from the co-cultures and mono-cultures at 48 h. We found that the concentration of CCL2 in BMSCs and TF-1, TF-1α and K562
[image:10.595.56.536.298.655.2]mono-IL-8
Figure 5IL-17 signaling-related cytokine levels are greater in supernatants from BMSCs co-cultured with leukemia cells.Supernatants from the cultures were harvested after 48 hours and tested for soluble factors using an immunoblotting assay. The supernatants were from BMSC mono-cultures (black bars), TF1, TF-1αand K562 leukemia cell mono-cultures (white bars), CD34+cells mono-cultures (grey bars), BMSCs co-cultured in
transwells with leukemia cells (black and white stripped bars) and BMSCs co-cultured with CD34+cells (black and grey stripped bars). The relative
cultures was 310.9 ± 77.3 pg/ml, 108.3 ± 74 pg/ml, 262 ± 112 pg/ml and 63.6 ± 30.7 pg/ml respectively. The concen-tration of CCL2 increased significantly in the supernatant of BMSCs co-cultured with TF-1, TF-1αand K562 (2482 ± 647 pg/ml, 915.3 ± 103 pg/ml and 1434 ± 298 pg/ml re-spectively) (Figure 7). The concentration of IL-8 in BMSC monocultures was <3.5 pg/ml for two of the donors and was 9.8 pg/ml in the third donor. The concentration of the secreted IL-8 was <3.5 pg/ml in the supernatants from TF-1 and K562 mono-cultures, but was higher (68.4 pg/ml) in the supernatants from TF-1αmono-cultures. The concen-tration of IL-8 increased in BMSCs co-cultured with TF-1, TF-1αand K562 (4216 ± 2760 pg/ml, 194 ± 180 pg/ml and 326.2 ± 300 pg/ml respectively) (Figures 7 and 8).
Discussion
The purpose of our study was to investigate the effect of the leukemia microenvironment on bone marrow stro-mal cells. BMSCs support both norstro-mal and abnorstro-mal hematopoiesis. In leukemia microenvironment they play an important and complex role: BMSCs promote AML cell growth and drug resistance [37] via IL-6 secretion, JAK/STAT pathway activation [38] and by activating pro-survival pathways via integrin-linked kinases [39]. In
chronic myeloid leukemia, BMSCs stabilize leukemia cells by promoting the clustering of CXCR4 in the lipid rafts and facilitating the migration of leukemia cells in the bone marrow [14]. BMSCs via the secretion of sol-uble factors also inhibit drug-induced apoptosis of AML [40] and myeloma cells [41]. It has been found that con-ditioned media from BMSCs cultured alone had no ef-fect on myeloma cells, but soluble factors produced by BMSCs in contact with myeloma induced some anti-apoptotic properties suggesting a dynamic interaction between BMSCs and myeloma [41].
[image:11.595.57.537.87.350.2]Our studies found a similar dynamic relationship be-tween BMSCs and leukemia cells. We confirmed that BMSCs affect leukemia cells and found that leukemia cells change the profile of cytokines produced by BMSCs to a proinflammatory signature. These changes did not require direct contact between BMSCs and leukemia cells; they were mediated by soluble factors. In anin vitro co-culture model, BMSCs responded to the presence of leukemia cells undergoing changes in gene expression and cytokine release. After co-culture with leukemia cells 1540 BMSC genes were differentially expressed. The most up-regulated genes were involved in the acute inflammatory response and in the IL-17, CD40 and NFκB signaling Figure 6IL-17 signaling-related cytokine levels increase in supernatants from BMSCs co-cultured with leukemia cells: comparison of the effects of BMSCs from 3 different donors.BMSC mono-culture (black bars), TF1 (1), TF-1a (2) and K562 (3) leukemia cell (LC) mono-culture (white bars) and CD34+cell mono-culture (grey bars), BMSC/leukemia cell transwell co-culture (black and white stripped bars) and BMSC/CD34+
pathways. Moreover, in co-culture the levels of the IL-17 signaling pathway proteins CCL2 and IL-8 were increased in the culture supernatants. The IL-17 signaling pathway is highly involved in the inflammatory process, auto-immune diseases and in the tumor microenvironment [42].
The leukemia cell-induced changes in BMSCs were different than those induced by CD34+cells. The CD34+ cells from healthy donors induced changes in 4904 BMSC genes, but the fold change in expression was low. The genes most up-regulated by CD34+cells were
SER-PINB2, IL1B, RTP3, CCL7 and IL8, and the pathways
most represented among the differentially expressed genes were involved with metabolism.
Our gene expression profiling results found some differences in the effects of the three leukemia cell lines on BMSCs: TF-1 and K562 stimulated BMSC pro-inflammatory molecule production, while TF-1α down-regulated BMSCCol3A1expression and up-regulatingIRF8 although with a small fold change and the pathways most represented in the differentially expressed genes included Rac, actin cytoskeleton, growth factor hormone and death receptor signaling.
[image:12.595.60.538.89.294.2]CCL2 (pg/ml) IL-8 (pg/ml)
Figure 7CCL2 and IL-8 supernatant levels are greater in BMSCs co-cultured with leukemia cells.BMSC mono-culture (black bars), TF1, TF-1αand K562 leukemia cell mono-culture (white bars) and BMSC/leukemia cell transwell co-cultures (black and white stripped bars) supernatants were harvested after 48 h. The concentration (pg/ml) of CCL2 and IL-8 was measured using an ELISA assay. The sample labeling legend is at the top left. The figures represent the results of 3 experiments with BMSCs obtained from three different healthy donors.
[image:12.595.59.540.497.678.2]The analysis of BMSC-leukemia cell co-culture super-natant partially confirmed our gene expression data. The factors CCL2, IL-8, IFN-γand CD40L were detected in the supernatant. We found that the level of CCL2 was the high-est in BMSCs co-cultured with TF-1, lower with K562 and the lowest in BMSCs co-cultured with TF-1α. The levels of IFN-γ, CD40L and IL-8 were elevated in the co-culture supernatants; however, the magnitude of the changes in the factor levels differed among the three leukemia cell line experiments confirming their different effects on BMSCs.
We selected the leukemia cell lines according to their phenotype, with TF-1α being closer in phenotype to a leukemia stem cell and our results suggest that BMSCs might react to leukemia cells in a different way than LSCs. The variance in the effects of 3 leukemia cell lines also suggest that differences in the nature of the effects of the leukemia cells on BMSCs might contribute to dif-ferences in the clinical presentation among leukemia types. Interestingly, previously published studies of pa-tients with myeloid leukemia and acute lymphocytic leukemia have shown a deregulation of serum cytokine and chemokine profiles including higher levels of CCL2 and IL-8 [43-46] and in myeloid leukemia elevated levels of CCL2 and IL-8 were associated with an unfavorable prognosis [43-45]. Other studies have found that CCL2 and IL-8 inhibit myeloid progenitor proliferation [47-49].
We also noted differences in supernatant factor levels among cultures with BMSCs from different donors. This is likely due to differences among the BMSCs. Our group has previously shown substantial variance among BMSCs from healthy donors [50]. The results of the current study found that the cytokine expression was variable among the assays which used BMSCs from three different donors; BMSCs from only one of the donors reacted to the leukemia cells by increasing the expression of IFNγ and CD40L. More-over, the levels of CCL2 and IL-8 increased in the BMSCs from all three donors, but by different amounts. We spe-culate that variances among patients in outcome and response to the treatment might also be ascribable, in part, to differences among their bone marrow stromal cells. Others have also studied BMSC donor variations in cyto-kines expression profile and have found that the basal and post-inflammatory stimulation cytokine/chemokine pro-files are donor-dependent in in vitro experiments [51]. Much of the change in BMSCs induced by leukemia cells is likely due to soluble factors secreted by leukemia cells.
In conclusion, our results reveal that BMSCs react to leukemia cells by changing the profile of their ex-pressed cytokines and chemokines to an IL-17 signal-ing profile. In a microenvironment as finely regulated as the hematopoietic niche, this alteration of secreted factors likely collaborates with leukemia features to create a competitive niche more favorable to leukemia stem cells [52,53].
Competing interests
The authors declare that they have no competing interests.
Authors’contributions
SC, PJ: performed experiments and wrote the manuscript. JR, MS, JJ: generated BMSC. HW and YZ: helped with sample collections. LC: data analysis, FM and DS: study design and edited the draft manuscript. All authors read and approved the final manuscript.
Acknowledgement
The authors thank the Bone Marrow Stromal Cell Transplant Center, NIH for providing the BMSCs and Jeff Miller MD, NIDDK, NIH, Bethesda, Maryland for supplying the CD34+cells. These studies were supported by research funds
provided the Department of Transfusion Medicine, Clinical Center, NIH.
Author details
1Cell Processing Section, Department of Transfusion Medicine, Clinical
Center, National Institutes of Health (NIH), Building 10, Room 3C720, 9000 Rockville Pike, Bethesda, MD 20892-1184, USA.2Infectious Disease and
Immunogenetics Section (IDIS), Department of Transfusion Medicine, Clinical Center, National Institutes of Health (NIH), Bethesda, MD 20892, USA.3Sidra
Medical and Research Centre, Doha, Qatar.
Received: 25 November 2013 Accepted: 27 November 2013 Published: 4 December 2013
References
1. Wang Y, Krivtsov AV, Sinha AU, North TE, Goessling W, Feng Z,et al:
The Wnt/beta-catenin pathway is required for the development of leukemia stem cells in AML.Science2010,327(5973):1650–1653. 2. Hoang VT, Zepeda-Moreno A, Ho AD:Identification of leukemia stem cells
in acute myeloid leukemia and their clinical relevance.Biotechnol J2012,
7(6):779–788.
3. Ashton JM, Balys M, Neering SJ, Hassane DC, Cowley G, Root DE,et al:
Gene sets identified with oncogene cooperativity analysis regulate
in vivogrowth and survival of leukemia stem cells.Cell Stem Cell2012,
11(3):359–372.
4. Ferretti E, Cocco C, Airoldi I, Pistoia V:Targeting acute myeloid leukemia cells with cytokines.J Leukoc Biol2012,92(3):567–575.
5. Jordan CT, Upchurch D, Szilvassy SJ, Guzman ML, Howard DS, Pettigrew AL,et al:The interleukin-3 receptor alpha chain is a unique marker for human acute myelogenous leukemia stem cells. Leukemia: official journal of the Leukemia Society of America.Leukemia2000,
14(10):1777–1784.
6. van Rhenen A, Moshaver B, Kelder A, Feller N, Nieuwint AW, Zweegman S,
et al:Aberrant marker expression patterns on the CD34+CD38- stem cell compartment in acute myeloid leukemia allows to distinguish the malignant from the normal stem cell compartment both at diagnosis and in remission.Leukemia2007,21(8):1700–1707.
7. Hosen N, Park CY, Tatsumi N, Oji Y, Sugiyama H, Gramatzki M,et al:CD96 is a leukemic stem cell-specific marker in human acute myeloid leukemia. Proc Natl Acad Sci USA2007,104(26):11008–11013.
8. Majeti R, Chao MP, Alizadeh AA, Pang WW, Jaiswal S, Gibbs KD Jr,et al:
CD47 is an adverse prognostic factor and therapeutic antibody target on human acute myeloid leukemia stem cells.Cell2009,138(2):286–299. 9. Jaiswal S, Jamieson CH, Pang WW, Park CY, Chao MP, Majeti R,et al:CD47 is
upregulated on circulating hematopoietic stem cells and leukemia cells to avoid phagocytosis.Cell2009,138(2):271–285.
10. Colmone A, Amorim M, Pontier AL, Wang S, Jablonski E, Sipkins DA:
Leukemic cells create bone marrow niches that disrupt the behavior of normal hematopoietic progenitor cells.Science2008,
322(5909):1861–1865.
11. Konopleva MY, Jordan CT:Leukemia stem cells and microenvironment: biology and therapeutic targeting.J Clin Oncol2011,29(5):591–599. 12. Kojima K, McQueen T, Chen Y, Jacamo R, Konopleva M, Shinojima N,et al:
p53 activation of mesenchymal stromal cells partially abrogates microenvironment-mediated resistance to FLT3 inhibition in AML through HIF-1alpha-mediated down-regulation of CXCL12.Blood2011,
13. Zeng Z, Shi YX, Samudio IJ, Wang RY, Ling X, Frolova O,et al:Targeting the leukemia microenvironment by CXCR4 inhibition overcomes resistance to kinase inhibitors and chemotherapy in AML.Blood2009,113(24):6215–6224. 14. Tabe Y, Jin L, Iwabuchi K, Wang RY, Ichikawa N, Miida T,et al:Role of
stromal microenvironment in nonpharmacological resistance of CML to imatinib through Lyn/CXCR4 interactions in lipid rafts. Leukemia: official journal of the Leukemia Society of America.Leukemia2012,26(5):883–892. 15. Sansonetti A, Bourcier S, Durand L, Chomienne C, Smadja-Joffe F,
Robert-Lezenes J:CD44 activation enhances acute monoblastic leukemia cell survival via Mcl-1 upregulation.Leuk Res2012,36(3):358–362. 16. Becker PS:Dependence of acute myeloid leukemia on adhesion within
the bone marrow microenvironment.Scientific World Journal2012,
2012:856467.
17. Nagahisa H, Nagata Y, Ohnuki T, Osada M, Nagasawa T, Abe T,et al:
Bone marrow stromal cells produce thrombopoietin and stimulate megakaryocyte growth and maturation but suppress proplatelet formation.Blood1996,87(4):1309–1316.
18. Bianco P, Robey PG, Simmons PJ:Mesenchymal stem cells: revisiting history, concepts, and assays.Cell Stem Cell2008,2(4):313–319. 19. Mendez-Ferrer S, Michurina TV, Ferraro F, Mazloom AR, Macarthur BD, Lira SA,
et al:Mesenchymal and haematopoietic stem cells form a unique bone marrow niche.Nature2010,466(7308):829–834.
20. Nagasawa T, Omatsu Y, Sugiyama T:Control of hematopoietic stem cells by the bone marrow stromal niche: the role of reticular cells. Trends Immunol2011,32(7):315–320.
21. Westerterp M, Gourion-Arsiquaud S, Murphy AJ, Shih A, Cremers S, Levine RL,
et al:Regulation of hematopoietic stem and progenitor cell mobilization by cholesterol efflux pathways.Cell Stem Cell2012,11(2):195–206.
22. Bianco P:Minireview: The stem cell next door: skeletal and hematopoietic stem cell“niches”in bone.Endocrinology2011,152(8):2957–2962. 23. Dominici M, Le Blanc K, Mueller I, Slaper-Cortenbach I, Marini F, Krause D,
et al:Minimal criteria for defining multipotent mesenchymal stromal cells. The International Society for Cellular Therapy position statement. Cytotherapy2006,8(4):315–317.
24. Horwitz EM, Le Blanc K, Dominici M, Mueller I, Slaper-Cortenbach I, Marini FC,
et al:Clarification of the nomenclature for MSC: The International Society for Cellular Therapy position statement.Cytotherapy2005,7(5):393–395. 25. Aggarwal S, Pittenger MF:Human mesenchymal stem cells modulate
allogeneic immune cell responses.Blood2005,105(4):1815–1822. 26. Caplan AI, Dennis JE:Mesenchymal stem cells as trophic mediators.
J Cell Biochem2006,98(5):1076–1084.
27. Ren G, Zhang L, Zhao X, Xu G, Zhang Y, Roberts AI,et al:Mesenchymal stem cell-mediated immunosuppression occurs via concerted action of chemokines and nitric oxide.Cell Stem Cell2008,2(2):141–150. 28. Horwitz EM, Dominici M:How do mesenchymal stromal cells exert their
therapeutic benefit?Cytotherapy2008,10(8):771–774.
29. Ren J, Jin P, Sabatino M, Balakumaran A, Feng J, Kuznetsov SA,et al:
Global transcriptome analysis of human bone marrow stromal cells (BMSC) reveals proliferative, mobile and interactive cells that produce abundant extracellular matrix proteins, some of which may affect BMSC potency.Cytotherapy2011,13(6):661–674.
30. Mercier FE, Ragu C, Scadden DT:The bone marrow at the crossroads of blood and immunity. Nature reviews.Immunology2012,12(1):49–60. 31. Zhang W, Trachootham D, Liu J, Chen G, Pelicano H, Garcia-Prieto C,et al:
Stromal control of cystine metabolism promotes cancer cell survival in chronic lymphocytic leukaemia.Nat Cell Biol2012,14(3):276–286. 32. Yusuf RZ, Wang YH, Scadden DT:The secrets of the bone marrow niche:
Metabolic priming for AML.Nat Med2012,18(6):865–867. 33. Shain KH, Yarde DN, Meads MB, Huang M, Jove R, Hazlehurst LA,et al:
Beta1 integrin adhesion enhances IL-6-mediated STAT3 signaling in myeloma cells: implications for microenvironment influence on tumor survival and proliferation.Cancer Res2009,69(3):1009–1015.
34. Bergfeld SA, DeClerck YA:Bone marrow-derived mesenchymal stem cells and the tumor microenvironment.Cancer Metastasis Rev2010,29(2):249–261. 35. Anderson KC, Carrasco RD:Pathogenesis of myeloma.Annu Rev Pathol
2011,6:249–274.
36. Sabatino M, Ren J, David-Ocampo V, England L, McGann M, Tran M,et al:
The establishment of a bank of stored clinical bone marrow stromal cell products.J Transl Med2012,10:23.
37. Garrido SM, Appelbaum FR, Willman CL, Banker DE:Acute myeloid leukemia cells are protected from spontaneous and drug-induced
apoptosis by direct contact with a human bone marrow stromal cell line (HS-5).Exp Hematol2001,29(4):448–457.
38. Weisberg E, Liu Q, Nelson E, Kung AL, Christie AL, Bronson R,et al:
Using combination therapy to override stromal-mediated chemoresistance in mutant FLT3-positive AML: synergism between FLT3 inhibitors, dasatinib/multi-targeted inhibitors and JAK inhibitors.Leukemia2012,
26(10):2233–2244.
39. Tabe Y, Jin L, Tsutsumi-Ishii Y, Xu Y, McQueen T, Priebe W,et al:Activation of integrin-linked kinase is a critical prosurvival pathway induced in leukemic cells by bone marrow-derived stromal cells.Cancer Res2007,
67(2):684–694.
40. Konopleva M, Konoplev S, Hu W, Zaritskey AY, Afanasiev BV, Andreeff M:
Stromal cells prevent apoptosis of AML cells by up-regulation of anti-apoptotic proteins.Leukemia2002,16(9):1713–1724.
41. Nefedova Y, Landowski TH, Dalton WS:Bone marrow stromal-derived soluble factors and direct cell contact contribute to de novo drug resistance of myeloma cells by distinct mechanisms.Leukemia2003,
17(6):1175–1182.
42. Qian Y, Kang Z, Liu C, Li X:IL-17 signaling in host defense and inflammatory diseases.Cell Mol Immunol2010,7(5):328–333. 43. Parmar A, Marz S, Rushton S, Holzwarth C, Lind K, Kayser S,et al:
Stromal niche cells protect early leukemic FLT3-ITD + progenitor cells against first-generation FLT3 tyrosine kinase inhibitors.Cancer Res2011,
71(13):4696–4706.
44. Reikvam H, Mosevoll KA, Melve GK, Gunther CC, Sjo M, Bentsen PT,et al:
The pretransplantation serum cytokine profile in allogeneic stem cell recipients differs from healthy individuals, and various profiles are associated with different risks of posttransplantation complications. Biol Blood Marrow Transplant2012,18(2):190–199.
45. Kornblau SM, McCue D, Singh N, Chen W, Estrov Z, Coombes KR:Recurrent expression signatures of cytokines and chemokines are present and are independently prognostic in acute myelogenous leukemia and myelodysplasia.Blood2010,116(20):4251–4261.
46. Burgess M, Cheung C, Chambers L, Ravindranath K, Minhas G, Knop L,et al:
CCL2 and CXCL2 enhance survival of primary chronic lymphocytic leukemia cellsin vitro.Leuk Lymphoma2012,53(10):1988–1998. 47. Cashman JD, Eaves CJ, Sarris AH, Eaves AC:MCP-1, not MIP-1alpha, is the
endogenous chemokine that cooperates with TGF-beta to inhibit the cycling of primitive normal but not leukemic (CML) progenitors in long-term human marrow cultures.Blood1998,92(7):2338–2344. 48. Broxmeyer HE, Cooper S, Cacalano G, Hague NL, Bailish E, Moore MW:
Involvement of Interleukin (IL) 8 receptor in negative regulation of myeloid progenitor cellsin vivo: evidence from mice lacking the murine IL-8 receptor homologue.J Exp Med1996,184(5):1825–1832.
49. Schwartz GN, Kammula U, Warren MK, Park MK, Yan XY, Marincola FM,et al:
Thrombopoietin and chemokine mRNA expression in patient post-chemotherapy andin vitrocytokine-treated marrow stromal cell layers.Stem Cells2000,18((5):331–342.
50. Ren J, Stroncek DF, Zhao Y, Jin P, Castiello L, Civini S,et al:Intra-subject variability in human bone marrow stromal cell (BMSC) replicative senescence: Molecular changes associated with BMSC senescence. Stem Cell Res2013,11(3):1060–1073.
51. Zhukareva V, Obrocka M, Houle JD, Fischer I, Neuhuber B:Secretion profile of human bone marrow stromal cells: donor variability and response to inflammatory stimuli.Cytokine2010,50(3):317–321.
52. Wei J, Wunderlich M, Fox C, Alvarez S, Cigudosa JC, Wilhelm JS,et al:
Microenvironment determines lineage fate in a human model of MLL-AF9 leukemia.Cancer Cell2008,13(6):483–495.
53. Hole PS, Darley RL, Tonks A:Do reactive oxygen species play a role in myeloid leukemias?Blood2011,117(22):5816–5826.
doi:10.1186/1479-5876-11-298