Alignment and Defect Structures in
Oriented Phosphatidylcholine Multilayers
The Harvard community has made this
article openly available.
Please share
how
this access benefits you. Your story matters
Citation Asher, Sanford A., and Peter S. Pershan. 1979. Alignment and defect
structures in oriented phosphatidylcholine multilayers. Biophysical Journal 27(3): 393-421.
Published Version doi:10.1016/S0006-3495(79)85225-X
Citable link http://nrs.harvard.edu/urn-3:HUL.InstRepos:10361979
Terms of Use This article was downloaded from Harvard University’s DASH repository, and is made available under the terms and conditions applicable to Other Posted Material, as set forth at http://
ALIGNMENT AND DEFECT
STRUCTURES
IN
ORIENTED
PHOSPHATIDYLCHOLINE
MULTILAYERS
SANFORD A. ASHERANDPETERS. PERSHAN, DivisionofApplied Sciences, Gordon McKayLaboratory, Harvard University, Cambridge, Massachusetts 02138
U.S.A.
ABSTRACT Thealignment of dilauryl-, dimyristoyl-, and dipalmitoylphosphatidylcholine at various water concentrations into large oriented monodomain multilayers by annealing at elevated temperatures (Powers and Clark. 1975. Proc. Natl. Acad. Sci. U.S.A.72:840;Powers and Pershan. 1977. Biophys. J. 20:137) is accompanied by the formation and subsequent dissolution of various defect structures. Some of these defects appear similar to those observed in thermotropic and otherlyotropicliquid crystals, reflecting the lamellar structure of these materials. The formation and evolution of defects during the alignment of the lipids into the
defect-free, monodomain, multilamellar geometry is studied using polarized microscopy. A combination of polarized and dark-fieldmicroscopyfacilitatedcharacterization of thedefects;
specific structural models are proposed.Anewalignment techniqueinvolving compression and dilation of the lipid, which effects sample alignmentattemperatures that are lowerthan those required by the Powers technique, is described. Lower temperature alignment avoids thermal
decompositionthat will sometimes occur if thelipid is maintainedatelevated temperatures for prolonged periods. With this technique, samples (80 ,tm thick) ofdilaurylphosphatidylcholine
with20% water by weight were aligned at room temperature. INTRODUCTION
Recently Powerset al.(1-3) described anannealingtechnique for phosphatidylcholine-water mixtures that produces large (> 125 ,um thick x I cm2 area) aligned monodomain multilayers. Aligned multilayers are of interest notonly for their liquid crystalline properties (4-7) but also becauseof their utility as model systems in thestudy of biological membranes (8,9). In
thelatter context they caneither be useddirectly for the study of the material properties of lipid bilayers (3,10-20) or as a matrix for the incorporation of biologically interesting ingredients (2,3).
In this article we will describe the use of polarized and dark-field microscopy to
characterize the numerous defect structures (3) observed during the alignment of the lipid multilayers by both the annealing process of Powers et al. (1-3) and by a new alignment technique involving repeated compression and dilation of the sample. This newtechniquecan
be used to induce alignment of lipid liquid crystals at much lower temperatures than the
annealing technique(1-3).This issignificant because in thePowerstechnique the samplesare
annealed at temperatures that would denature many biologically interesting adducts, e.g.,
about 1500C for dipalmitoylphosphatidylcholine (DPPC) with 7% water by weight. In addition, thehigh annealing temperaturescanlead todecomposition ofthelipid if thesample
ismaintainedatthesehigh temperatures forprolonged periods.ThePowerstechniqueis also
added after the sample wasaligned. A combination of the mechanical alignment technique and the annealing technique permits the direct alignment of the lipids with any water concentration up to thetwo-phaselimit.
Since the presence of defects can affect the results ofmany physical measurements, an
understanding of their properties and the conditions for their appearance is a necessary
prerequisitetocarefulstudies. For example, material addedtothemultilayersoftenbecomes
selectively incorporated within some of the defects, leading to concentration inhomogeneities within the sample. Indeed, Wu et al. (14) noted selective incorporation of the fluorescent probe NBD-PE (N-4-nitrobenz-2-oxa-1,3-diazole phosphatidylethanolamine) within
boun-daries between oriented domains. The selective incorporation of fluorescent or spin-label probes into defects could result in diffusion and fluidity measurements characteristic of the defects rather than of the aligned multilamellar domains.
Although manyof the defect structures appear spontaneously in freshlyprepared samples, there are others that are only seen when well-aligned samples are subjected to thermal or elastic stresses (7). Ifone wishes to maintainwell-aligned samples foranyperiodof time itis
essentialtounderstandandcontrol the conditions that leadtodefect formation. Additionally,
an understanding of the defect structures mayelucidate the factors that prevent alignment and suggestimproved alignment techniques. In this article we will describe the appearanceof
various lecithin samples during both the thermal annealing (1-3) and the mechanical alignment process. Some of these defects were observed earlier by Powers (3). Various defect
structureswill beidentified and interpreted in termsof specific models.
EXPERIMENTAL
Dipalmitoyl- and dimyristoylphosphatidylcholine (DPPC and DMPC) were purchased from Sigma ChemicalCo. (St. Louis, Mo.).Dilaurylphosphatidylcholine (DLPC) was purchasedfromCalbiochem
(San Diego, Calif.)Our initialstudieswerewith commercialDPPC samples thatwerechromotographed
on silica gel columns (Bio-Rad Laboratories, Richmond, Calif., Bio. Sil. A, 200-400 mesh) using a
chloroform methanol elution solvent. The lipid solution was rotary evaporated, leaving a waxy translucent solid, redissolved in benzene, and lyophilized into a fluffy powder. This powder was evacuated for 3 d at room temperature under <1.0 ,um vacuum to ensure solvent removal. We
subsequentlydiscovered that if commerciallipids showing no TLC-detectable impuritiesweresimilarly lyophilizedfrom benzene, they were experimentally indistinguishable from the chromatographed lipid in theiralignment,defect structures, andphase transition temperatures. Most of the experimentsreported
here utilized theunchromatographed, TLC-pure commercial lipids. Benzene lyophilization appearsto
facilitatelipidalignment into the monodomain form and results in fewer defects. This may be because
lipids dissolved in benzene have a high degree of local order (21). Recently we have observed that crystalline DPPC (Sigma Chemical Co., P6138) appears identical to the lyophilized lipids in its
alignment, defectstructures,and phase transition temperatures.
The lipid samples were monitored for purity by TLC on silica gel plates (EM Laboratories, Inc.,
Elmsford,N.Y.,#5763)with aneluting solvent consistingof chloroform, methanol, andwater(65:25:4 vol:vol). The plates were stained by iodine vapor and can detect as little as 0.5%lysolecithin.Allthreeof the lipids were studied using the Powers technique (1-3) and were aligned between 1-mm thick microscope slides separated by a 125.0-,um teflon spacer. Samples containing <10% water by weight
wereprepared by adding the appropriate amount of water to the dry,lyophilized lipid power that had been packedintothecavity formed by thespacer and one microscope slide. Amicrolitersyringewas
before annealing. Water concentrations were measured gravimetrically for some of the lower water samples (<8%) subsequent to the annealing process. The water concentrations observed were within
10% ofthe valuesexpected, indicating little lossofwater during theannealing process for the lower watersamples.
DPPC samples containing >10% water appear to require longer times for the water to become homogeneously distributed. To ensure water homogeneity, these samples were prepared in larger amounts(200mg) by sealing thedry lipid powder with the appropriate amount of water in a glass vial underaN2atmosphere.The DPPC-water mixturewasallowedtoequilibrateat roomtemperature inthe dark for 1 mo before use. No TLC-detectable lipid decomposition occurred during equilibration. Immediatelyafter breaking the sealonthe glassvial, about 10 mg of thelipid-watermixturewasplaced
into the cavityformedby the spacer and the bottommicroscopeslide. The top slidewas immediately clamped onto the sample. Thisproceduretook<15 sandwepresumethat therewaslittleexchange of waterwith thedry nitrogenatmosphereduringthesamplepreparation.
Powers et al. (1-3) suggested that pretreatment of the glass slides by the silane surfactant N,
N-dimethyl-N-octadecyl-3-aminopropyl-trimethoxy silyl chloride was essential for their alignment technique. However,wefound that iftheglass slideswerescrupulouslycleaned with hot chromic acid
andthen rinsedcarefullyinadistilledwatersteambath, alignmentwas obtainedequallywell withor
without thesurfactant. Ontheotherhand, thesurfactant-treated surfacesare moreconvenientto use since theyare both easilyprepared and stable for weeks if stored undernitrogen. Clean surfaces are
easily preparedsince no water spottingoccurs on the hydrophobic surfacesduring the finalrinse. In contrast,hydrophilicsurfacesareeasilycontaminated evenwithinanitrogen atmosphere (presumably
by traceorganicimpurities)andthe surfacesbecomeinhomogeneous.Thehydrophilic surfacesmustbe
used immediately aftertheyareprepared. Mostofour experimentsweredone withsurfactant-coated
slides.
The mechanical alignmentofDLPCwith20%water wasstudied at roomtemperature.The samples werepreparedbyweighingthe appropriateamountofwaterintoacapsule containing50 mgofdry lipid. The water wasdispersedin thelipid usingadentalamalgamator.Althoughtheglassslides containing thesampleswereidenticaltothoseused in theannealing technique,the spacerwasmade of latexrubber,
100 ,um thick.About 10 mgofthe fluidlipid-watermixturewasscrapedoutof theamalgamator capsule andplaced into thecavityformedbythe spacerandoneglassslide. The second slide sealedthecavity
and the entireassemblywasplacedinto theholder shown inFig.1.Theholder for theslides consists ofa
metal box andasteel plate that compresses theglassslides and rubber spacertogetherandagainstthe bottom of the box.The tensiononthesteelplatewasvariedbyset screwsaccessiblefrom the top of the
sampleholder. Holesweredrilledin thesampleholdertomonitor thealignment.Macroscopic alignment
ofDPLCcontaining 20%watercould be obtainedat roomtemperature(-250CaboveTC[8]) bygently
alternating between compressing and releasing the glass slides. There was little or nobowing of the microscope slidesduring thecompressionsordilations. Ingeneral,thecompressionwasnonuniform,and
flow from onepartof thesample toanother could be observed during the process. The flow maybe
BRASS ADJUSTABLE
-FRAME STEEL SET SCREW
\ ~~~PLATE
\ \
g\ZDD<zAMK
\ /L~~~~~IPID~~~~GLASS
S* - -H<zsys<,>/SLIDES
RUBBE R SPACER
FIGURE 1 Sample holder for the mechanical alignment of lipids. Typical spacer thickness and lipid cross-sectionalareaare100Amand1cm2, respectively.
partiallyresponsible for the growth ofthealignedhomeotropic areas asthe processis continued. The
mechanicalalignment technique can also be used toalign anyphosphatidylcholine-water mixture above thegel transition.
The alignment and defect structures were monitored continuously by using polarized optical
microscopy and conoscopy. Defect-induced phase shifts in the transmitted light were measured at selected points in thesample by using a Soleil-Babinet compensator attached to themicroscope.
RESULTS
Wellaligned samplesof DPPC, DMPC, and DLPC with variousamountsofwater (4-20%) attemperatures thatcorrespondtotheir smectic-Aor Laphaseareuniaxial(1-3, 16,20,22-25). The structureof these lipid liquid crystals has been shown by x-raydiffraction toconsist ofbilayers of lipid moleculesseparated bylayers ofwater (Fig. 2)(1,16,20,22-27).Although there is a well-defined order along the normal to the layer planes, there appears to be no
long-range order within the lipid layers (16,22-27). Since the optic axis of the
homeotropi-cally aligned lipid in the La phase is normal to the glass surfaces, a well-aligned sample appears uniformly dark when viewed between crossed polarizers. Defects in sample
align-ment, accompanied by tilts of the layers with respectto the glass slides, make the samples appear birefringent such that, when the plane of polarization of the incident light is neither
parallelnorperpendiculartothe tiltdirection, thelightleavingthesamplewillbeelliptically
polarized and willnot beextinguished by a crossedpolarizer. Themagnitudeof theeffect is related to theamountoftilt, the magnitude of the uniaxial optical anisotropy of thealigned system, and the length of the tilted region as measured parallel to the direction of light propagation, i.e., normal to theglass slides. Thus, an unaligned lipid-water sample observed microscopically with white light between crossed polarizers appears to be nonuniform and highly colored duetothelarge variation of thelayer tilts.
Thephasediagrams of lecithin-water mixtures have been investigated by numerous groups (22-31). Hydrated DPPCsamples containing >4 wt %water undergoa phase transition at
PhosphOpild Molecule
H20
Gloss Side NmN
HydrocarbonV
:
Toils -9 Y
Polor Heod-"
,a
err~~~~~~
GlowSlida "O"',ar100' or .40, 1.1, "I '00'
F R Se ipetot ougm id
* _^;^~st}taXtt-X-23-X:f $-XRS
temperatures between 40 and 700C (22,28) from a solid-like phase labeled
Lo'
in which therigid hydrocarbon chains are tilted with respect to the bilayers (28) to an La or smectic-A
phase where the hydrocarbon chains are fluid and perpendicular to the bilayers. The exact transition temperatures decrease with water content from ca. 650C at4wt% water to 420Cat
20 wt % water.
Less is known about the high temperature (>100IC) hydrated-DPPC phase diagram, but from x-ray studies of egg lecithin (22,23,29,30) and soaps (32,33) it appears that cubic, hexagonal, and rhombohedral phases can occur where the lipid molecules are organized into rods (22,23,29,32,33). The cubic phase is unique in that it appears optically isotropic (29). Luzzati et al. (29) have shown that for egg lecithin containing <4 wt % water the rhombohedral phase occurs at ca. 700C. This phase is followed by the cubic and hexagonal phases at about 90 and 1 200C for samplescontaining <4 wt % water. However, Loomis et al. (30) indicate that egg lecithin samples containing <1 wt % water show a rectangular phase between 50and 900Cfollowed by a cubic phase between 100 and 1400and a hexagonalphase between 140and 2400C. Incontrast, Small (23) indicated that the "viscous isotropic phase," which is cubic andoptically isotropic, occurs at ca. 100°C for dry egg lecithin and appears at ca. 2000C for 16 wt%water. Thephase transition temperature to the cubic isotropic phase increases with water content.
In ourobservations of DPPC samples containing 5-8% water, between room temperature
llOO aim
Ft V
FIGURE 3 Striationsalong flowlinesinasample ofDPPC with7%waterbyweight. Samplethicknessis
and 1600C, we observe the presence below ca. 700 of a solidlike birefringent phase (presumably L') that transforms at higher temperatures to a uniaxial phase containing defects indicative of the smectic-A or Laphase. The magnitude of the optical uniaxialityof
this phase decreases with temperature untila phase transitionoccurs to anoptically isotropic phase we presume is cubic. At temperatures slightly below this transition to the optically isotropic phase (-50C) defects begin to quicklyanneal into amonodomain uniaxialgeometry. Stresses on the sample willproduce novel defects, which have notpreviously been identified with the smectic-A phase. These defects may indicate the presence of an additional phase between the La and the cubic phase or they may simply result from pretransitional effects that decrease the smectic elastic constants andpermitnewdefectstructures.
Thermal Annealingof Lipid-Water Mixtures
Figs. 3-6 containtypical views of different stages in alignment ofa 125-,um thicksample of DPPC containing 7% water as observed microscopically between crossed polarizers. Dust spotsthat appear identical in someof theseare on themicroscopeand notin the sample. At room temperature, which is well below the transition to the La phase, the sample appears brightly colored, amorphous, and featureless. Without polarizers it is waxy and translucent. As the temperature is increased, the sample apparently becomes more fluid, and at about
450C
inhomogeneousflow
begins within the sample. Presumably this is the result ofH- 5OOsLm-r1
FIGURE 5 Oilystreaks separating black aligned domains in 125-jm thick sampleofDPPC with 7% waterby weight. T=830C. The streaksconnect at nodes. The polarizers areorientedhorizontally and
vertically.
inhomogeneous stresses produced when the sample was initially clamped between the glass
slides. Fig. 3 shows the sample at 670C. Striations, commonly referredto as"oilystreaks"in
theliquid crystal literature (3,6,30,34), can be observed. If these streaks are observed with white light and crossed polarizers, colored bands occur running parallel to someof the streaks. Additional structures, to be discussed later, can also be observedsuperimposedonthe streaks. Fig.4shows adifferent sectionof the same sample at 770C. Manyof the streaksareseparated off from the others and appear as isolated finelines. Mostof thesearewhiteorcolorless. The wider streaks are white on the edge and sometimes become yellow, red, andeven blueas one
progresses into the interior. The black regions separating the streaks can be shown by
conoscopy to beoptically uniaxial, and we conclude that they are aligned regions with the lamella parallel to the glasssurfaces. Fig.5 also showsadifferent section of thesamesample at 830C. The aligned areas are larger and the streaks connect at nodes that appear to be pinned to thesurfaces of the glass slides. Kleman et al. (6)pointedoutthat there appearstobe
a Kirchhoff's network relationshipto thenodes; the widthofanoily streakleaving anode is thesum of the widths of the oily streaks entering it. Although the widths of individual oily
streaks appear to varywidely (1-300
,um),
thewide streaks oftenseem toconsist of thinnerf
IF
FIGURE 6 Polygonal array between oilystreaks in 125-Mmsampleof DPPC with 7% water by weight. T= 110°C.Note thetransverse black lines in the oily streaks connect to the black lines of the polygonal arrays. Thepolarizers are oriented horizontally and vertically.
streaks result ina separationofthese parallel streaks. Impurities in the sample, such as dust
andnonlipid soluble materials, tend to first become trapped inthe streaks, and subsequently
movealong thestreaks,finally collectingin the nodes. If smooth, unstructured oily streaks as
thoseinFig. 5 areviewed between crossed polarizers orientedparallel (perpendicular) tothe longaxesof the streaks, thelight transmitted through thestreaks is extinguished, indicating that the layer tilts areeither along or perpendicular to the long axes. Observations using a Soleil-Babinetcompensatorindicate that the slowaxisis perpendiculartothe long axisof the streaks. Since thelipids are uniaxially positive (1-3) the layers must be tilted such that the layer normals remain perpendicular tothelong axis of the streak. Observations of the colors
transmittedthroughthecrossedpolarizersor measurementswitha Soleil-Babinet
compensa-torindicatethat themaximumbirefringenceoccurs atthecenterofanoily streak,decreasing
almost symmetrically to either side. Although variations are observed in the maximum
ellipticity ofthetransmitted lightindifferentstreaks,typically alongthecenterofastreak 40 ,um wide, the relative phase shift between light polarized parallel and perpendicular to the
long axiscorrespondstoapath differenceof -600nm. Forwideroilystreakspath differences aslargeas 1,000nmhave beenobserved.
Thebirefringence variesinanonlinearmanneracrosstheoily streak.Therateofchangeis
.-IOO.Lm--04
perceptibly fasterat theedgethan at thecenter,wherethe birefringence is maximal. The oily streaks are well delineated from the adjacent aligned smectic domains, indicating that the layer tilts giving rise to thebirefringence begin over a very short distance. In general, we find that the maximum birefringencefor an oily streak increases with the width of the streak.
Asthe temperature is increased further, the aligned areas between the streaks continue to getlarger andatabout 100°Capolygonal defect array appearsinallof the alignedareas.This is shown in Fig. 6 for the same sample as in the previousfigures, but for temperature (T) = 1OOOC. These polygonal arrays are observed in allof the lipids studied and can also be formed intotally aligned samples by either small temperature increases or by slight increases inthe spacing between the glass slides enclosing the sample (7). Similar polygonal arrays were
observed by Powers (3) in DPPC and by Rosevear in soaps (34). Figs. 7 a and b show a
crossed-polarizer and dark-field view of the polygonal array in a sample of DLPC containing 20% water by weight. This particular sample was aligned by the mechanical alignment technique and the polygonal array was formed by subjecting the sample to a small temperatureincrease (-20C).
The polygonal arrays have been discussed at some length in a separate publication (7) and there isnoneedtoreproduce the many observational detailshere.Suffice ittosay that when they first appear, the polygonal arrays will look like a square grid of black lines for some
orientations of the crossed polarizers with respecttothesample. Forotherorientations of the polarizer-analyzer combination,one still observed a square array, but with slightly different
(a) (b)
Cc) Cd)
FIGURE7 Crossedpolarizerand dark-fieldphotomicrographsofpolygonalarrays.(a)Weakly
birefrin-gentpolygonalarraysobserved between crossedpolarizersinasampleof DLPCcontaining20%waterby weightatroomtemperature. Focusisatthemidheightof thesample.Reticulelinesare50jAmapart.(b)
Same as (a), observed withdark-field microscopy. (c) Highly birefringent polygonal array observed between crossed polarizersinasampleof DLPCcontaining20%waterby weightatroomtemperature.
features. Theappearanceofthe arrayalso varies with theheightatwhich themicroscope is focused. Under dark-field illumination the array appears as small, fine, brightcrosses in a
uniformly dark field(Fig.7b). The position of thecrossescorrelate with certain verticesin the
grid pattern observed between crossed polarizers. Although the polygonal array is stable for many hours if the temperature and sample thickness are held fixed, it will disappear in a
matter of seconds if the temperature is lowered a few degreesorif theglass plates enclosing thesampleareslightly compressed.
The polygonal array that first appears is essentially colorlesseven though theoilystreaks
maybebrightly colored. With further increases in the temperatureorlargersample dilations the polygonal array becomes coarser (the period increases by a factor oftwo orthree) and
more birefringent, acquiring a yellow hue. Furthermore, for the initial array, when the polarizer-analyzer combination was parallel to the grid lines, the spaces between the lines were uniformly gray. For the new array there is definitely some structure. This is most strikingly seen inFig. 7, where thecrossed-polarizeranddark-field viewsof thetwoarraysare
compared. Thebirefringent polygonal array shown in Figs.7candd is taken fromadifferent section of the same sample, asshown in Figs. 7 aandb, and was formed by adilation of the sample(-1O,m).
When the polygonal arrays form upon a temperature increase or a sample dilation, fine
structureforms within theoily streakstransverse totheirlongaxes.Thistransverse structure
is most pronounced when the crossed polarizers are oriented either parallelorperpendicular to the streaks andcanbeclearlyseeninthe severalstreaksshowninFig.6.
Since the crossed polarizers are oriented horizontally and vertically, the streaks that are
mostvisiblearethose running450totheseaxes. On the otherhand, it ispossibletoidentifya
faint vertical streak in thecenterof Fig. 6, andaslightly moreevident one on the very right. If thepolarizer wererotated 450, the bright oneswould becomefaint and the faintones bright. Since the dark lines that make up the polygonal array run into the streaks, it is oftendifficult
todistinguish between a streak oriented along the polarizer analyzer axis and the surrounding array. In thisfigurethe vertical streak in the center canonly be identified by comparing the horizontal dark and light bands with the square pattern characteristic of the array. If, however, the temperature is lowered again, the polygonal array and thefinestructure in the oily streaks fade away while the oily streaks themselves remain.
Although there is not a precise description of the DPPC-water phase diagram at temperatures above -1 10°C, it is known that above this temperature the system can
transform for some water concentrations into a "cubic isotropic" phase (8,22,23,28). The actual transition temperature issensitiveto thewatercontentand sample purity (22,23) (see
below) and in our experiments it varies between 110 and 1600C. On the other hand, when samples containing morethan 8-10% water are heated to -1250C it appears as though the
FIGURE8 Myelinicfiguresseparating bubbles of steam in a125-,umthickDPPC sample containing 20% water by weight. T= 1350C.
disruption by steam formation we were unable to investigate lipid-water phases occurring above 1 250C for water concentrations above 10wt%.
With samiples containing <8-10% water, if the temperature is raised to within 50C of the transition to the cubic isotropic phase, the polygonal array will fade away in times of order of
minutes. The polygonal array starts to anneal at those sites that display crosses under dark-field illumination. This is easily seen when viewed between crossed polarizers, since the regions surrounding the crosses darken noticeably and the dark lines emanating from these sites broaden until the entire array disappears. Accompanying this process is a decrease in the
birefringenceof the unannealed portions of the array. Fig. 9, showing a polygonal array in the processof annealing away at 1 280C, demonstrates the sharp contrast that occurs between the annealed sections of the array and those parts that have not yetannealed away. The defect texture in Fig. 9 superficially resembles textures observed by Rosevear (34) in the middle phases of soaps. However, the texture in Fig. 9 results from an annealing of the polygonal array formed within the La phase into a planar uniaxial domain and is not a stable defect
texture at this temperature. Thus, the new texture observed at this temperature cannot be used to diagnose the presence of a new phase in lipids similartothemiddle phase of soaps.
The oily streaks are the last features to disappear, and one is left with auniformlyaligned
sample that is black between crossed polarizers, except for a few isolated pointlike defects. Conoscopy indicates that although the sample is uniaxial, the optical anisotrophy, An,atthese
--FIGURE 9 Polygonal arrays and oily streaks annealing away in a 125-,um thick sample of DPPC containing 7% water by weight. T=1280C.
temperatures is much smaller than the values measured at lower temperatures (1-3) (i.e.,
An<<0.01). Note that the gradual annealing of the polygonal arrays at temperatures slightly below theoptically isotropic phase is qualitatively different from the dissolution that occurs at lower temperatures,simultaneously with a decrease in sample temperature.
If the sample temperature is lowered slowly, a well-aligned, defect-free sample will be maintained and An becomes -0.03 at 800C (1-3). If, however, the temperature is lowered too quickly (i.e.,faster than 1°C/min), thinstrandlike defects appear thatrun between thepoint defects that remained in the aligned sample (Fig. 10). These strands will eventually anneal away at any temperature within the La phase. Slow cooling will maintain an aligned defect-free sample downto the gel transition temperature. If the aligned sample isstabilized
atsometemperatureabove the gel transition but more than -50C belowthe high temperature
transition to theoptically isotropic phase, small increases insample temperature(-0.1 C)or
small increases in sample thickness will immediately induce the polygonal array mentioned above. Reversal of the temperature or thickness increase causes the array to completely vanish. Ifthe aligned sampleis maintained at a temperature no more than -50C below the transition to the optically isotropic phase, the polygonal array will not appear under any conditions.
If thesample is cooled below the gel transition temperature,defects commonlyoccurinthe samplealignment. These defects appearas numerousdiffuseregions scatteredthroughout the
FIGURE 10 Strandlike defectsformed in aligneddomainsby afasttemperature decrease. The strands connectdefectsinthe 125-,umthick sample of DPPC containing 7% water by weight. The temperature wasloweredfrom1 300C to1220C in -1 min.
sample that transmit light through the crossed polarizers. Even for samples that appear macroscopically-oriented by conoscopy, microscopic observations will often indicate that the alignment is far fromperfect.
Thetransition to the opticallyisotropic phase can be monitored microscopically, sinceeven
after the polygonal arrays anneal away, -5° below the transition, the sample doesnotappear totally black. Presumably, some light is transmitted through the crossed polarizers due to
smalldeviations in the alignment of the sample. Theonset of theisotropic phaseisindicated
by the appearance ofa totally black area containing almost no defects. A definite border between the optically isotropic phase and the rest of the sample can be observed by using
natural illumination. If the entire sample becomes isotropic, the planar uniaxial phasecan neverberecovered and subsequentcoolingresults in theneedle-likestructuresshown inFigs. 11 a and b. However, if the sample is prevented from becoming completely isotropic by quicklyloweringthe temperatureafewdegreesatthe first appearance of theisotropic phase,
the sample appears as an inhomogeneous mixture of needle-like and planar domains. If the temperatureof the sampleis maintained no morethan -50C below the isotropictransition,
the needle-like domains slowly dissolve into the planarregions. Weobservetransitions to an optically isotropic phase for lipids containingbetween 3and 8wt%water.
|-4-- 0fi
0~-m-(a)
(b)
FIGURE 11 Needle-like defects formed upon a temperature decrease from the isptropic phase in a
125-,gmthick DPPC samplecontaining 7% water.(a) T =1480C.(b)T= 145°C.
In all of the DPPC samples that we have studied carefully, the isotropic phase transition decreases with time if the samples are maintained at elevated temperatures (>lOOAC) for prolonged periods. For example, a fresh DPPC sample containing 7% water by weight will initially show an isotropic transition temperature at about 1600C. However, ifthe sample is maintained at 1150C, the transition temperature will steadily fall and after about 1 wk will become opticallyisotropicat 1150C. This decrease in the transition temperature isnotdueto
water loss, sincesubsequent measurements of the water concentration agree with the expected watercontent. However, the decrease in the isotropic transition temperature can be correlated with theappearance of palmitic acid, lysolecithin, and other unidentified productsthatcan be detected byTLC. Theirconcentration increases with timefromwhat weestimatetobe -1% after 4 h at 1500C to =50% after 1 wk at 1500C. Although thermal decomposition of unsaturated lipids is well known, there is little published information on saturated lecithins exceptfor the observation of thermal decompositionat210°C (22).
The rateof decomposition is slowest inmonohydrate samples;after2d at 1500C the intensity of the lysolecithin spot on the TLC plate corresponds to that of a fresh lipid sample intentionally mixed with 5 wt % lysolecithin. The amount of lysolecithin in monohydrate
samples maintained at 900C for 2 d is below the limit of detection (<0.5%). In contrast, although 7% water samples maintainedat 1500C for 2 d areseverely degraded (-50%),one
can barely detect any lysolecithin in 7% water samples maintained at 900C for 2 d. This corresponds to <-0.5 wt %. A25% water sample shows abouta2%decomposition after2dat
900C. These results indicate that anylipid-water sample should be annealed foraminimum time above 100GC.
Thedefect structuresobserved in theselipid-water samples appear almost independent of sample purityfor samples containing <- 10wt% ofdegradation products.Themajor effect of
degradation that we observe is a lowering of the isotropic transition temperature (22,23). Moreseverely degraded samplesdo not align into homogeneous domains and havenumerous
defects. Interestingly, for those samplesmostseverelydegraded,thetexturesobserved under theoptical microscope suggest that theyarealignedwith thelayersperpendiculartotheglass slides.
As previously mentioned, the polygonal array will only form at temperatures that are
>-50C
below theisotropictransition temperature. However, if thesampleis<50Cbelow that transition, a newseries of defectstructures can beformed, either by dilating orcompressing thesample. The first of these appears attemperaturesjustabove the temperature wherethepolygonal array anneals away. Thisstructure mightalso be describedaspolygonal, although
its appearance is qualitativelydifferentfrom the appearance of the array thatwaspreviously termedpolygonal; e.g., compare Figs. 6and 12.The structureoften consists of short parallel
k--1OO1Fm
FIGURE 13 Concentric ringeddefectstructure induced in a 125-,um thick DPPC samplecontaining 7% water by weight by either dilating orcompressingthe sample. T=150°C.
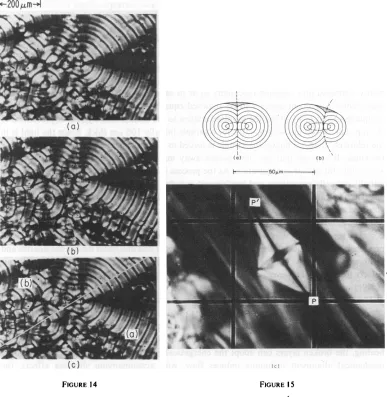
bands that form concentric polygonal rings about a central point. At a slightly higher temperature, but still below the isotropic phase, a somewhat different defect structure occurs (Fig. 13). The patternof concentric rings is morepronounced and extensive than those in Fig. 12,and the structure near the central point is smooth,displaying fewer kinks in the curvature of the concentric rings (e.g., Fig. 14). On the other hand, one can see in Fig. 13 that the concentric ringsarenotsmoothlycurved and facetsarestill visible.
The repeat distance between the light and dark rings of both of these defects is roughly constant and from two to three times the unit cell dimensions of the birefringent polygonal arraysobserved at lower temperatures (e.g., seeFig.7 c). The dark rings remain dark for all orientations of the crossed polarizers. The concentric light rings have superimposed dark
sections that formthearmsofa crosscentered within the concentric rings (Figs. 13and 14).
k-200um-1
(a)~~~~~~~~~~~~a b
Cc) (c)~~~~~~~~~~l b
,
~~~~~~~~~~~~~~~~~~~-0u
FIGURE 14 FIGURE 15~~~~~~~~~~~~~~~~1WL
illstrtedinhecomost (c).
FIGURE 15 (a)Layercurvaturesinafocalconicconsistingofalineandcirclepair. (b) Layercurvatures
inafocalconicconsistingofanellipseandhyperbola.(c)Focal conic observedin100--gma thick DLPC
sample containing20% cholesterol.T= 600C.
when the
segment's
outeredge
isalong
thepolarizer
axes. As the crossedpolarizers
arerotated,
asegmentthatis dark becomeslight
while theadjacent light
segmentbecomesdark. Thedirection of theoptic
axis appearstochange
discontinuously
between segments.Themaximal contrast between the
light
and darkrings
in these defects is observed when themicroscope
is focused at either the top or bottom of thesample
(Fig.
14).
Those black [image:18.482.39.426.51.448.2]they anneal away the widths of the blackrings increase andcorrespondingly the widths of the light ringsdecrease.
Mechanical Alignment of Lipid WaterMixtures
Alignedlipid-water samples can be prepared far belowtheir isotropic transition temperatures butabove their gel transition temperatures by using the sample holder shown inFig. 1. While observing the sample microscopically between crossed polarizers, the various set screws are gently tightened and loosened repeatedly so as to cause the material to flow parallel to the glass slides. Alignment appears to be achieved equally well by either a uniform change in sample thickness or by tilting the top slide relative to the bottom one. Typical displacement of the top slide is -40 um within -10 sfor a sample initially 100,tmthick. Since thelipid is in the relatively fluid Laphase, the sample is forced to flow in response to the changing sample thickness. It appears that the flow sweeps away many of the defects and forces others to anneal into theplanarconfiguration. Asthe process iscontinued, alignedareasappearin the initially optically amorphous andbirefringent sample. The aligned regions become larger and oily streaks can eventually be identified separating the aligned domains. The textures observed appear similar to those shown in Figs. 4-6. As the process continues further the aligned regions become larger and larger until the entire sample consists of aligned black domains separated by oily streaks. The polygonal textures shown in Figs. 6 and 7 and previouslyobservedduring the annealing process appear and disappear during the dilative and compressive stages.Asin thethermalannealing process, the oily streaks are the most difficult defects to remove. However, repeated cycles of dilation and compression slowly force their dissolution.
The flow and stresses resulting from changes in sample thickness during the mechanical
alignment technique presumably allow defectsto surmount the energy barriers necessary to form aligned domains. Dislocations within the sample can be squeezed out during the compressive stages (35) and layers not parallel to the glass slides may be broken. Upon healing, the broken layers can adopt the energetically favorable planar form. Although the mechanical alignment technique induces flow, with accompanying shearing effects, the
conceptual difference between it and the shear alignmenttechnique (3,4,18) canbe seenby
considering the idealized case ofa sample with nodefects and perfectly flat, parallel glass slides. Squeezing such a sample will onlycause flow if individual layerscan break, to form
some sortof dislocationlooporsimilardefect.Inthatcasetheloopis unstable andflowoccurs to relieve the built-up stress. At the end of the process such an idealized sample would be restored to the original state, except for being slightly thinner.Inrealsamples,squeezing will
causethe pre-existingdislocations and defectsto move at stresses below (35)thevalues that would causenewdefects. Theprimary action of the mechanical technique is thustodevelop conditions under which motion ofthedefectsoutof thesamplewould relieve the staticstress. Incontrast, for the idealizedperfect sample, the sheartechnique would producea homoge-neous velocity gradient that may or may not be stable for practical shear rates. If, for argument's sake, we assume the flow is stable in the ideal sample, the expected effect of defects on the flow,or conversely, the expected effect of flowon thedefects, isless obvious. One possible picture would have the lipid flow so as toavoid the defects. Presumably, this
The empirical facts are that bothtechniques will result in alignment. However,wehave found that the mechanical technique results in thicker aligned samples than the shear technique (-100 gm compared to -20-50 ,um). Although
for
both techniques polygonal arrays occurduring the aligning process, they are easily removed in the mechanical techhiique by readjusting the sample thickness. As apractical matter, if the shear technique wasdone with spacers, whose thickness could be carefully adjusted, this would be true for it also. The net
result is that the mechanical technique removes alldefects except the oily streaks and it does
notproduce any other stable typeof defect. Although the oily streaks can oftenbeeliminated
from the sample, this takes more care and patience than for other defects. Flow isobserved
duringthe mechanicalprocess and this often eliminatesdefects.
Themonodomain areasobtained by using the mechanical alignment techniqueare not as
large in area as those obtained withthePowers thermalalighment technique(1-3).However, the sample thickness of mechanically aligned samples is almost as large (- 100 ,um). The monodomain areas in these mechanically aligned samples aredefect-free and appear totally black between crossed polarizers. Although the samples contain some oily streaks, greater than 95% ofa 1-cm2mechanicallyalignedsample is in theplanardefect-free form.Typically, 3-mm2
aligned
domainscan bepreparedin afew hoursat roomtemperaturein 80-,um thick samples ofDLPC
containing 20% water. If the temperatureof the lipid sample isincreased,the mechanical alignment processproceedsmorerapidly, obtaining largeraligned regionsin
shorter times. For example, 10-mm2areas canbeprepared in -1 hat600Cin DLPCsamples
containing20% water byweight.
DISCUSSION
Phosphatidylcholines
areamphiphilic, due totheir distinct polarandnonpolar
parts (8). Thehydrophobic hydrocarbon chains of these molecules associate together in the La liquid
etystalline phasetoform bimolecular leaflets, while thehydrophiliccholineheadgroups face
out of the bilayer and are associated with the interleaved water layers (Fig. 2). In
thermodynamic
equilibrium,at afixed waterconcentration,
the repeatdistance between thebilayers
isflxed
by
thermalequilibriumconditions. In tontact withaplanarboundary of the type used in our eXperiments, the minimum free energy would be achieved for a perfectlyaligned, homogeneous system,withthe layers parallel to the glassslide.On the other hand, there is an extensive literature
coh'cerning
the types of defects that are observed to exist in lamellar or smectic-A systems that are not in states of minimum free energy (36-42).Presumably, kinetic effects, impurities,
pinning
sites at the boundaries, or other subtlerdefect-defect interactionsrender
the
defectsmetastable.Since themoststabledefects
should
causeonly
small increases in thefree energy over theplanarconfiguration,the interplanar repeat distance should be approximatelyconcervedand the layer curvature should be small throughout mostof the sample (38).
Thesd
criteria atecurvature of the individual toroidal layers lie along a line perpendicular to the circle and passing through its center. Asomewhat more complex and more commonfocalconic defect
occurs when the circle becomes an ellipse and the line becomes a hyperbola passing through oneof the foci of the ellipse (Fig. 15 b). Electron micrographs of lipid bilayer curvatures
similar to those shown in Figs. 15 a and b were recently obtained by Kleman et al. (36). Thesefocalconic defects areobserved in the optical microscope in lipid samples because of the refractive index discontinuities along the cusp lines(i.e., along the ellipse and hyperbola), and because the layer tilts around the defect modulate the sample birefringence. These particular defects have never been identified by usinpurelipid-water samples,but are seen in
samplesof DLPC-cholesterol and water (Fig. 15 c).
The focal conic shown in Fig. 15 c was photographed such that the focus of the microscope was at the centerof ellipse. The hyperbola running between points PP' lies in the plane of the figure and is almost a straight line. The ellipse in the figure is somewhat out of focus, butifthe focus of the microscope is changed it is very clear that an ellipse oriented almost edge on to the viewing plane is present.
PolygonalArrays
Adegenerate form of the focal conic defect results when the straight line and the circle are
deformed into two confocal parabolas. Rosenblatt et al. (37) have demonstrated that in thermotropic smecticliquid crystalsanetworkof parabolic focal conics (PFC's) is responsible for adefect structure that resembles thepolygonal structure discussed above. In an earlier paper(7)wehavedemonstratedunambiguously that the simple PFCstructureshown inFigs. 16 and 17is responsible for the least birefringent polygonalstructuresobserved in the lipids (Figs. 7aandb).
Because the detailed properties of these arrays were described elsewhere (7), we will restrict the presentdiscussionto someof theirmoreimportantfeatures. Fig. 16 illustrates an arrayof the confocal parabolasofa PFC array.As previously mentioned, the parabolic lines
arethe locusof cusps in thecurvatureof theindividual smecticlayers. Fig. 17illustratesthe layer curvatures atfour different heights in the sample foronesectionof the array shown in Fig. 16. Near the cusps in layer 1 ofFig. 17 a the layers are all tilted towards the points marked A.Since the system is locally uniaxial with the symmetry axis normal tothelayers, thesample, when viewed from above,willappearbirefringentwiththeopticaxisradiatingout
FIGURE 16 Three-dimensionalstructuresof the locus of the cusps of theparabolicfocal conics.(After
4~~~~~~~~~~~~~~~~~~~4
FIGURE 17 Representationof the smecticlayertilts inaPFCarrayandtheeffect of crossedpolarizers. (a)Three-dimensional viewof thelayertiltsatfour differentheightsin thesample.Points labeledAare
where thefourparabolas joinatthetop. Pointslabeled Barewhere theparabolascross.Points labeled C
arewhere thefourparabolasjoinatthe bottom.(b)Locusofextinguishedlight bythecrossedpolarizers
orientedalongtheparabola.
from
point
A.Theprojection
of theoptic
axes ontheviewing
plane
is shownby
thefine lines inFig.
17 b.Thus,
ifthislayer
wereisolated and viewed between crossedpolarizers
orientedasindicated above
Fig.
17b,oneshouldseethesquarenetwork shownby
theheavy lines.Infact,if the
sample
is viewed withamicroscope
that hasashortdepth
of focus and that is focusedat thissample height,
thepredicted
pattern isjust
this(7).
Similar effects areexpected
if themicroscope
isfocused atthe bottomlayer,
exceptthat the bottom network isdisplaced
relative tothetopnetwork.Focusing
atthemidheight
resultsina squarenetworkofhalf thespacing
(7).
The
largest
layer
tilts occur where the twoparabolas
wrap around one another in themidheight
of thefigure (and
in thesample also).
Theselarge
tilts and the refractive indexinhomogeneities they
create areresponsible
for the finelight
crosses seen in the dark-fi'eldmicroscopic
view shown inFig.
7b.Themore
birefringent
arraysshown inFig.
7 candseeninFig.
6 appearslightly
different from the others when viewed between crossed polarizers.Faint,
additional structure can beseen in the interior of the
square
arrays.Also,
when viewed with whitelight,
but between crossed polarizers, thesearrays are colored while theinitial,
lessbirefringent
arrays are not.The view with dark-field illumination, however, indicates that thesearrays are much more complicated thanthelessbirefringent arrays (compareFigs, 7a and b with 7 c andd).
Rosenblatt etal. (37) suggested that theformationofthe PFC arrays in the thermotropic
liquid crystal p-cyanobenzylidene-p-n-octyloxyaniline (CBOOA) was due to a mechanical instability when the aligned smectic is subjected to a dilativestress that stretches the layer
thickness more than a critical amount, The fact that the PFC's form upon a temperature increase
and
that thelipids
wearestudying havea negativecoefficient of thermal expansion (25,43-45) is consistent with their suggestion.Asimplified descriptionof the formation of the PFC'sisthatfor smallsampledilationsthe layers must buckle to increase the samplethickness while preserving the interlayer Reparation (46,47). As thedilationbecomes larger, thesamplecracks.Sincethe sample is geometrically
constrained
due to the fixed interbilayer spacing, the locii of thecracks are notrandom and formasconfocal parabolas.Attemperatures -50C belowthe isotropictransition temperature the PFC arrays beginto annealaway. Theannealing begins at the core of thedefects,where theparabolas cross, and widens, spreading along the parabolaarms. As thisprocess occurs, the remaining parts of the arraybecome lessbirefringent. Since the stored strain energy density in the PFC's is highest
nearthecoreit isreasonablefor annealingto startthere. Itisalsoreasonable thatannealing
onlyoccursnearthetemperature wherethesample becomesopticallyisotropic and where the
bilayer stability is reduced.
OilyStreaks
Fig. 18 ashowsapossible cross-sectional view through an oilystreakthat isconsistent With all of the above
observations.
This structure could be viewed as two equal and oppositedislocations with large Burgers vectors. In the figure the Burgers vectors are equal to 11
lattice vectors, but in someof the oily streaks
-5-
,n!wide the Burgers vector wouldhavetobe of theorderof 103 lattice spacings and it is not clear that it is profitabletospeak ofadefect ofthis
sizeasadislocation.
Theproposedstructurediffers from thefocalconicdefectsinthatfor each layer, thesingularity
in curvature is a line rather than a point, and the locus ofsingularitiesisaplanerather than a line. If thefocalconic
defect
isconsideredtobealineoraone-dimensionaldefect, weare proposing that theoilystreak is a planaror two-dimensional
defect.
The evidence supporting this structure is as follows: firstly, as indicated in Results, the
layers aretiltedsuchthat thelayer normalsremainperpendicular tothelongaxisof theoily
streak. Secondly, the phase shift or optical path difference between two vertical rays, one
polarized parallel to theaxisofthe streakandtheother perpendicular, is predicted from this model tovaryacross the width of thestreak. If weexpress the phaseshift as an optical path
difference,Ad, it isstraightforwardtodemonstrate that for the pathPP'showninFig. 18 a,
Ad= 2Anxtan' 2
where An isthe difference in indexofrefraction between light
polarized
alongthe uniaxialdirection and perpendicular to that axis, and t is the "effective height" of the sample.
p
(a) 700r
600_
500
-1400
300
-200_
100_
/ ~ ~ ~ ~ ~ ~ ~~IIII
5 10 15 20
X (Mm)-~
(b)
FIGURE 18 (a)Proposed structurefor oily streaks showing layer curvatures.(b) Measuredbirefringence as afunctionofxacrosshalfofanoilystreak 40,um wide ina 125-umsampleof DPPC with 7%water.
Thebirefringenceissymmetricwithrespecttothelong axis of the streak. T = 900C.Adisoptical path
oily streaks contact the surface except at nodes where the oily streaks join. Previously, we
drew the same conclusions from studies of the PFC arrays (7). This suggests that the layers close to thesurfaces are not readily deformable. Fig. 18 b compares the phaseshift acrossan
oily streak measured with a Soleil-Babinet compensator with values obtained from this formula using An= 0.015and t= 80 ,um. The agreement is satisfactory giventhe fact that the
model completely neglects the small but finite compressibility of the layers and the small but finite elastic resistance to layer curvature. Both of these should induce small deviations between the layer tiltsin Fig. 18 a and the true values. Additional layers might also exist
along the disclination plane to alleviate the larger layer curvatures. Thirdly, the black lines observed in the PFC structures for suitable orientations of the polarizer and analyzer were observed to continue into the oily streak (Fig. 6). This is consistent with the proposed structure, since the middle of the oily streak consists of only a thin disclination linenear the
midheightof the streak. Above and below this disclination the sample is essentially planar and there is no reasonwhy thefocal conic lines that make up the PFC array should not extend into this part of thesample. The transverse linesdonotappeartocontinuethrough the oily streak. Instead, they curve, anda zigzag pattern is observed, often centered along the middle of the streak. Thecomplicated pattern of dark zigzagging lines transverse to the streak changes as the focus is shifted; other zigzag patterns emerge atdifferent heights. Although we do not have a model for this complicated pattern, the model we propose for the oily streaks is sufficiently well-orderedsothat oneexpectsfocal conic-like defects to existinthe streakitself. These lines, interacting with the disclination line that forms the core of the streak, could themselvesformnewconjugatefocalcurves.
Fourthly, it is energetically unfavorable forimpurities suchasdust and insoluble materials
toexist in planar regions of the sample and these materials would be expected to be expelled
outof thealigned regions (35).Inthefirst instancethey could very well become trapped along the highly strained core regions of the oily streak. However, since the streak is itself well-ordered along its length, it is not surprising that the impurities would migrate along the streak, eventually becoming located atthe nodes. Fifthly, it is easy to visualize that several
oily streaks may be located alongside each other and that transverse flow patterns could supply the forces necessary to separate them. Variations on the simple model are also not ruled out. For example, thetwo coresmaynotalways beatthe same height, or one may find
anoilystreakconsistingofonelarge Burgersvectormatched withtwo or moresmalleronesof opposite sign.
Finally, it is wellknownthat Kirchhoff networksareessential features of dislocations and,
asKlemanetal.(6) pointed out, thesearecharacteristic of theoily streaksweobserve.
RingDefects
Thering defects that are shown inFigs. 13 and 14only appearwithin,5°ofthe transition to
the isotropic phase and do not last long enough to allow careful study. Nevertheless, their properties, when viewed between crossed polarizers, indicate that thesmectic layer normals
are perpendicular to the light and dark bands. Also, the observation that the pattern seen when themicroscopeisfocusedonthe topof the sample (Fig. 14a) is the precise complement of the one seen when focused on the bottom (Fig. 14 b) suggests some sort of staggered
of lens effects in which the lightisbroughttodifferentfocii byindex ofrefractiongradients in the sample. For lipids the refractive indexgradientsare anorder ofmagnitude smaller than thoseinthermotropic liquid crystals and thesameinterpretation isnotpossible.
Fig. 19 a schematically describes the layer curvatures for one structure that could be responsible for the observations. Since the bilayers are locally uniaxial, the bilayertilts are accompanied by refractive index inhomogeneities. Fig. 19 b illustrates the difference
Aneff
between the indices of refraction for light propagating normal to the glass and polarized parallel and perpendicular to the plane of the figure. The three curves indicate the spatial behavior for
Anneff
at the top, middle, andbottomofthe sample. Lightthat ispolarizedneitherparallel nor perpendicular to the plane of the figure will become elliptically polarized after traversing the sample. If the microscope were focused at points A at the top (or bottom) of the sample, the acceptance angle of the microscope objective would allow the cones of light enclosed by the triangular sections 1 (or 2) to besampled. Since the light rays within these cones traverse sections containing only small layer tilts, the light remains largely linearly polarized andcanbeextinguished by a crossed polarizer, rendering pointsAat the top(and bottom) of the sample dark. However, if the focus occurs at other points in the sample, the acceptance cone lies in more strongly tilted regions of the sample and the light becomes elliptically polarized and is partially transmitted through the crossed polarizer (see sections 3-5 in Fig. 19 b), rendering the sample bright. Thus, a staggered pattern of light and dark
occurswhen themicroscope is focused at the top and bottom of the sample. The widths of the blackareasshould be smaller than thoseof the light areas.
The concentric ring patternsobserved in Figs. 13 and 14 can be explained if the structure in Fig. 19a had a rotation axis along the line marked P. A series of concentric light and dark rings would appear with the dark rings at the bottom surface occurring in the center of the light rings observed at the top and vice versa.
P
15 (D (Z) (D @
B A B A B A B B B A 1B3 A
Anleff
MIDDLE Alf
BOTTOM A\neff
A B A A B A A B AA B
(a) (b)
FIGURE 19 (a) Possible structure for the ring defects shown inFigs. 13 and 14. The lines represent averagelayerscurvaturesandnotindividuallayers.(b) Qualitativerepresentationof the variation ofAnff
The projection of the local optic axes of the defect on the viewing plane would be
everywhere radial; light would be extinguishedin the light bands along lines oriented along thepolarizer axes. Thus, a largedark cross would be observed centered atPand would rotate asthe crossed polarizers were rotated with respect to the sample.
Relationship between Defect Structures and Lipid Phases
Wehave observed that the PFC'sand the oily streaks are defect textures characteristic of the Laphase of lipids. ThePFC's result from small elastic strains on planaraligned domains. The origin of the oily streaks is less clear. However, large strains occurring within the La phase
canformdefects similar to the oily streaks (Fig. 1O),suggesting that they may resultfrom the large sample strains that occurduring the
L#
to Latransition (24,28). The oily streaks could also result from otherfactors, suchasmolecularpacking inthesamples below the La phaseorwater concentrationinhomogeneities.
The structure we propose for the ring defects assumes a layered geometry similar to that in the La phase. However, we cannot neglect the possibility that this new texturecould be due to the presence ofanadditional phaseconfined to a narrow temperature region between theLa
and the isotropic phase. This phase would be uniaxial withasmallrefractive index anisotropy and could be hexagonal or rhombohedral (29). However, we cannot detect any border between sample domains that support PFC's and those domains that support ringdefects. In
contrast, aclearborder is observed by using unpolarized light between ring defect regions and optically-isotropic lipid domains. The evolution of the ring defect texture with increasing temperaturefrom an angular polygonal texture reminiscent of PFC's to a smooth ring texture may indicate that the ring texture originates from pretransitional effects near the phase transition from the La phase to anoptically isotropic phase, which we presume is cubic in
nature. The smectic elastic constants would change near the transition and possibly permit this new defect. Alternatively, the domains supporting the ringed defects may be regions where microscopic domainsof the La and optically isotropic phase coexist.
SteamformationinLipid-Water Samples
Although published phase diagrams of hydrated lecithins indicate that the La phase can
absorb up to 40% water by weight for all temperatures at which the La phase is stable (8,22,23), the experimental datawe are awareof only documents this for temperatures below 100°C.Presumablyat40%by weightthechemicalpotentialforwaterwithin thelipid phase is equal to that of bulk waterand thetwosystemscoexist in thermal equilbrium. The fact that the phase boundary remains at 40% for all temperatures below 1OOOC suggests that at
maximumhydration the waterwithin the Laphase is not verydifferent from bulk water. In
contrast, ourobservation ofsteamformationinlipid samplescontainingaslittle as 10%water
by weight demonstrates that for atmospheric pressure and 1200C thecondition formaximum
hydrationis determined by coexistence of the lipid with water vaporrather than with liquid water.
the vapor pressure of water in the lipid are monotonically increasing functions of water Content, if the water vapor pressure of a lipid water sample is maintained at 1 atm, equilibrium between the water in the lipid and water vapor demands that the water concentration inthe lipid will hate todecreasefor temperatures above 100GC. Ifweassume that the gas bubbles observed at 1200C in samples containing 10% water by weight correspond to water vapor at 1 atm, we can estimate the difference between thechemical potential of water in lipid samples containing 40and 10% water by weight at 1200C from
A=u -RT lnPS/PL,where
P,
is thesaturated vapor pressure of steamat 1200C (51) and PL. = 1 atm; A,A = -523 cal/mol. Using Elworthy's (49,50) results for the partial pressure ofwater overDPPC samplescontaining 10%waterby weight, we obtainAA = -316cal/mol at
40QC. The agreement is surprisingly good in view of the
crude,
assumptions we have used,especiallysince PLmustbe>1 atm toforce thelipidoutofoursampleholders.Infact,if A = -316cal/mol at 1200C,thepartial pressure of water would be1.3atm.
Although Small (23) interpreted his resultssoas tomakea distinctionbetweenfreewater
(above 16%) and bound water (below 16%), more recent studies (10,52) demonstrate that there is not a cleardistinction between thetwo.Thegreatestchanges in thechemical potential
for wateroccurfor lower concentrations and the valueof
Ali
that wecalculateisonlya small fraction of the binding energy of thefirstfew percentof waterthatisaddedtotheanhydroussystem.
The appearance of an additional water vapor phase at atmospheric pressure and at
temperatures above 100°C is not reflected in any of the published phase diagrams we are
aware of. This means that at high temperatures sealed samples with small free volumes
cannot be treated as though they were at constant pressure and samples with large free volumes areprobably notadequately treated by assuming fixedwater content.
CONCLUSIONS
Numerous defect structures are observed and characterized in these lipid liquid crystals. All
of these can be annealed out at temperatures close to the smectic-isotropic transition. However, if the entiresample is taken into theisotropic phase,a set ofdefects appears that does notannealaway. Caremustbe taken inaligning these systemsatelevated temperatures
toavoid thermaldecomposition of thelipid;tomaintain high purity alignedsamples thehigh
temperature annealing process must be as brief as possible. A mechanical alignment
technique is discussed that avoids thermaldecomposition byfacilitating sample alignmentat
lower temperatures than the Powers technique. Lipid samples containing >8% water by weight cannot be thermally annealed into aligned samples due to steam formation that
disrupts the sample. However, these samples can be aligned by the mechanical alignment technique. The observations ofsteamformation insamples with waterconcentrations aslow
as 10%byweight attemperatures >1 200C indicatesthe coexistence of bothalipid-waterand water vapor phase above -1200C. This fact is not reflected in any of the published phase diagramsthat we are aware of.
Wewould like togratefully acknowledge helpful conversations and criticisms from Robert Meyer, Michael Fisch, JeffCollett,and Marc Peterson. Wewould also liketoacknowledgeMr. PaulDemchakfor technical assistance in the
This work hasbeen sponsored inpartbytheJointServices ElectronicsProgram(U.S.Army, Navy,andAir Force)
undercontractN00014-75-C-0648, by the National ScienceFoundation undergrantDMR-76-01111,andby the NationalInstitutes of Health undergrantGM-24081-01.
Receivedforpublication 18 December 1978 and in revisedform 26 March 1979.
REFERENCES
1. POWERS, L.,andP. S. PERSHAN. 1977. Monodomain samplesof dipalmitoylphosphatidylcholine with varying concentrationsof water and other ingredients. Biophys. J. 20:137-152.
2. POWERS, L., and N. A. CLARK. 1975. Preparation oflarge monodomain phospholipid bilayer smectic liquid crystals. Proc. Natl.Acad. Sci. U.S.A. 72:840-843.
3. POWERS, L. 1976. Preparation and investigation of monodomain phospholipid bilayer-water systems. Ph.D. Thesis.HarvardUniversity, Cambridge,Mass.
4. MICCIANCIO,S., and F. RONDELEZ. 1978. Evidence for shear-induced biaxiality in La lecithins close to solid
surfaces.J.Phys. (Paris) Lett.L-5-9.
5. BROCHARD, F.,and P. G.DEGENNES. 1975.Hydrodynamic properties of fluid lamellar phases of lipid/water. Pramana.Suppl.1, 1-21.
6. KLEMAN, M.,C. COLLIEX, and M. VEYSSIE. 1976. Recognition of defects in water-lecithin La phases. Adv.
Chem.Ser. 152:71-84.
7. ASHER,S. A., and P. S. PERSHAN. 1979. Parabolicfocalconics and polygonal textures in lipid-liquid crystals. J. Phys. (Paris). 40:161-173.
8. CHAPMAN, D. 1975. Phase transitions andfluiditycharacteristicsoflipids and cell membranes. Q. Rev. Biophys.
8:185-235.
9. MELCHIOR, D. L.,and J. M.STEIN. 1976.Thermotropic transitions in biomembranes. Annu. Rev. Biophys. Bioeng.5:205-238.
10. CHAN,W.K., andP. S. PERSHAN. 1978. Water andthermaldiffusivityin alipid-watersmectic phase.Biophys. J.23:427-449.
11. SMITH,B.A.,andH.M.MCCONNELL. 1978.Determination of molecularmotion inmembranes using periodic patternphotobleaching.Proc.Nat!. Acad. Sci. U.S.A. 75:2759-2763.
12. LEPESANT, J-P., L.POWERS, and P. S. PERSHAN. 1978. Brillouin light scattering measurements of the elastic propertiesof alignedmultilamellalipid samples. Proc.Nat!.Acad. Sci. U.S.A. 75:1792-1795.
13. CHAN,W., and P. S. PERSHAN. 1977.ForcedRayleigh scattering fromlipid-water smectic phases. Phys. Rev. Lett.39-.1368-1371.
14. Wu, E-S., K. JACOBSON, and D. PAPAHADJOPOULOS. 1977. Lateral diffusion in phospholipid multilayers measuredby fluorescence recoveryafterphotobleaching. Biochemistry.16:3936-3941.
15. JOST,P., L. J.LIBERTINI,V.C.HEBERT, and0.H.GRIFFITH.1971.Lipid spinlabels inlecithinmultilayers.A study of motion alongfatty acidchains. J. Mol.Biol.59:77-98.
16. LEVINE,Y.K., andM. H. F. WILKINS. 1971.Structureof oriented lipid bilayers,Nat. NewBiol.230:69-72. 17. HsIA,J-C.,H.SCHNEIDER, andI. C. P.SMITH.1970.Spinlabel studies of orientedphospholipids:egglecithin.
Biochim.Biophys.Acta.202:399-402.
18. SEELIG,J. 1970.Spinlabelstudies of orientedliquid crystals (amodel system forbilayer membranes).J.Am. Chem. Soc. 92:3881-3887.
19. LIBERTINI,L.J.,A.S. WAGGONER,P.C.JOST, and 0. H.GRIFFITH. 1969.Orientation oflipid spin labelsin
lecithinmultilayers,Proc.Natl.Acad. Sci.U.S. A. 64:13-19.
20. LEVINE,Y.K., A.I. BAILEY, and M. H. F. WILKINS. 1968.Multilayers of phospholipid bimolecular leaflets,
Nature(Lond.).220:577-578.
21. ELWORTHY, P. H. 1959. The structure of lecithin micelles in benzene solution J. Chem Soc. (Lond.).
1951-1956.
22. CHAPMAN, D., R. M. WILLIAMS, and B. D. LADBROOKE. 1967. Physical studies of phospholipids. VI.
Thermotropic andlyotropicmesomorphismofsome1,2-diacyl-phosphatidylcholines (lecithins),Chem.Phys. Lipids.1:445-475.
23. SMALL, D. M. 1967. Phaseequilibriaandstructureofdryandhydratedegglecithin,J.LipidRes.8:551-557. 24. WILLIAMS,R.M.,and D. CHAPMAN. 1970.Phospholipids, liquidcrystalsand cellmembranes, Prog.Chem.Fats
OtherLipids.11:1-79.
26. LuZZATI, V., and A. TARDIEU. 1974. Lipid phases: Structures and structural transitions. Annu. Rev. Phys.
Chem.25:79-94.
27. JANIAK, M. J., D. M. SMALL, and G. G. SHIPLEY. 1976. Natureof the thermal pretransition of synthetic phospholipids,dimyristoyl anddipalmitoyl-lecithin.Biochemistry. 15:4575.
28. TARDIEU,A., V. LuZZATI,andF.C.REMAN. 1973.Structure and polymorphismofthehydrocarbon chainsof lipids: A study of lecithin-water phases. J. Mol. Biol. 75:711-733.
29. LUZZATI, V., T. GULIK-KRZYWICKI, and A. TARDIEU. 1968. Polymorphism of lecithins. Nature (Lond.).
218:1031-1034.
30. LooMis, C.R., M. J. JANIAK, D. M.SMALL, and G. G. SHIPLEY. 1974.Thebinary phase diagram oflecithin and cholesteryl linolenate. J. Mol. Biol. 86:309-324.
31. LENTZ, B. R., E. FREIRE, and R. L. BILTONEN. 1978. Fluorescenceandcalorimetricstudiesof phase transitions inphosphatidylcholine multilayers: Kinetics of the pretransition. Biochemistry. 17:4475-4480.
32. LUZZATI,V.,andP. A.SPEGT.1967.Polymorphismoflipids. Nature(Lond.).215:701-704.
33. LUZZATI, V., A. TARDIEU, T. GULIK-KRZYWICKI. 1968. Polymorphism oflipids. Nature (Lond.). 217:1028-1031.
34. ROSEVEAR, F. B.1954.Themicroscopyoftheliquidcrystalline neatand middlephases ofsoapsandsynthetic
detergents.J. Am.Oil Chem. Soc.31:628-638.
35. PERSHAN, P. S., and J. PROST. 1975.Dislocation and impurity effects in smectic-A liquid crystals. J. Appl.Phys. 46:2343-2353.
36. KLEMAN, M., C.E.WILLIAMS,M.J.COSTELLO, andT.GULIK-KRZYWICKI. 1977.Defectstructuresinlyotropic
smectic phases revealed byfreeze-fracture electron microscopy. Phil.Mag.35:33-56.
37. ROSENBLATT, C.S.,R. PINDAK, N. A.CLARK, andR. B. MEYER. 1977.Theparabolicfocal conic:A newsmectic
Adefect.J.Phys.(Paris).38:1105-1115.
38. KLEMAN,M. 1976.Remarks on apossibleelasticityofmembranesandlamellarmedia: disorderedlayers.Proc. Roy.Soc.Lond.A.Math. Phys.Sci. 347:387-404.
39. KLEMAN, M. 1977. Energetics of the focal conicsofsmectic phases. J. Phys.(Paris).38:1511-1518.
40. BOULIGAND,Y. 1972.R6ch6rchessurles textures des etatsm6somorphes 1. Les arrangementsfocauxdans le
smectiques:rappels etconsiderationsth6oretiques.J.Phys.(Paris).33:525-547. 41. BRAGG,W. H. 1934.Liquid crystals. Nature(Lond.). 133:445-456.
42. FRIEDEL, G. M. 1922. Les6tatsmesomorphesdela matiere. Ann.Phys.18:273.
43. RAND, R. P., and W. A. PANGBORN. 1973. A structural transition in egg lecithin-cholesterol bilayers at 12°C. Biochim.Biophys.Acta.318:299-305.
44. RANCK, J. L., L. MATEY, D. M. SADLER, A. TARDIEU, T. GULIK-KRZYwIcKI, and V. LUZZATI. 1974.
Order-disorder conformational transitions of thehydrocarbon chains oflipids.J.Mol. Biol. 85:249-277.
45. LUZZATI, V.,H.MUSTACCHI,A.STOULIOS,and F.JUSSON. 1960.Lastructuredes colloides d'association.I.Les
phases liquidecristallines dessystemes-8au, ActaCrystallogr. 13:660477.
46. CLARK,N.A.,and R. B. MEYER. 1973.Straininducedinstability of monodomain smecticAandcholesteric
liquidcrystals.Appl.Phys.Lett.22:493-494.
47. DELAYE,M., R.RIBorrA, and G.DURAND. 1973.Bucklinginstabilityofthelayersinasmetic-Aliquid crystal. Phys.Lett.44A:1 39-140.
48. DEGENNES,P.B.1974.ThePhysics ofLiquid Crystals, Oxford UniversityPress,London,196.
49. ELWORTHY, P. H. 1961. The absorption ofwatervapor by lecithin and lysolecithin, and the hydrationof
lysolecithinmicelles. J.Chem.Soc.00.5385-5389.
50. ELWORTHY,P. H. 1962.Sorption studiesonphosphatides.Part II.Sorption ofwatervaporbyasyntheticlecithin
andcephalin.J.Chem. Soc.(Lond.).00:4879-4900.
51. Handbook ofChemistry and Physics. ChemicalRubberCo., Cleveland.Vol. 45. E9.